Original Article
, Volume: 13( 1)Prognosis and Diagnosis of Breast Cancer Using Interactive Dashboard Through Big Data Analytics
- *Correspondence:
- Sandhya P , Assistant Professor, Department of Science and Humanities, Veltech Dr. RR & Dr. SR University University, Chennai 600062, India, Tel: 9786433290; E-mail: sandy.spk22@gmail.com
Received: January 17, 2016; Accepted: February 27, 2017; Published: March 01, 2017
Citation: Gomathi N, Sandhya P. Prognosis and Diagnosis of Breast Cancer Using Interactive Dashboard Through Big Data Analytics. Biotechnol Ind J. 2017;13(1):128.
Abstract
Background: Cancer is a life threatening disease of present scenario among which breast cancer is the second highly mortal disease in women. There are several stages of cancer and an early detection of breast cancer can reduce the mortality rate. The primary detection of breast cancer is mammography due to the naked eye prediction of the disease by radiologist, they suggest for the next level of diagnosis like MRI, PET or biopsy. These tests are time consuming and not cost effective. In this work, we aim for an interactive dashboard methodology to determine the presence or absence of a distinct mass called tumor in mammographic image. Here we also tend to confirm the mass to be benign or malignant by analyzing the shape of the mass using image processing techniques. We also predict a possibility to determine the stages of breast cancer using big data and cloud as a next level to the computer aided method of cancer detection. Methodology: In this paper, we also use Backpropagation and Support vector machine system (SVM) for analysis of benign or malignant cancer, we can also predict the stage of cancer using mammographic images. Conclusion: The results performed in nntraintool determine the performance rate, training state, regression and error histogram of the test image. And the cloud and big data analysis idea suggest to a next level of home level cancer stage prediction.
Keywords
Microcalcifications; PET scan; nntraintool; ANN; SVM
Introduction
Breast cancer is the most commonly diagnosed cancer among women in United States. Breast cancer based on the stages the risk factor of the disease also increases. The cancer death rate is expected to reduce if the disease was to be diagnosed earlier. A periodical mammogram for women is always recommended to reduce the risk of breast cancer especially to women with a family history of cancer [1]. WHO’s special agency International agency of research on cancer evaluates the expiry rate of female death by breast cancer to be 400000 per year and it consecutively increasing every year [2]. The different stages of breast cancer are classified to different stages as the tumor size in breast and its invasion that has occurred in the auxiliary lymph nodes and other organs of human body [3]. The following are the stages of breast cancer explaining the characteristics of cancer cell.
The first step to detection of cancer in human body is by mammography. The mammogram images are visually examined by radiologist and report on the presence of cancer is given as positive or negative. The accuracy of visual conception of mammographic images is less due to the optical weariness (Table 1 and Figure. 1). To increase the accuracy of mammographic reading, we can follow several techniques like computer aided design, neural network, image processing etc. [4]. In few previous works, they focus on increasing the accuracy of mammography reading, ease of disease detection and to assist patients in a self-confirmation of disease and stages of disease instead of a second opinion. In several cases the mammographic screening leads to misinterpretation of noncancerous growth and the prediction can be termed as false-positive value for positive and false-negative value for negative. There are also several cases where the screening gives a type I error i.e. false-negative error on a positive case [5]. This leads to the severity of unidentified cancer within a short period of time due to high rate of proliferation. Sometimes even highly dense breast gives very less information on cancerous cell presence by mammography due to the lack of accuracy normally the radiologist directs the patients for a next level of detection such as MRI, PET scan and biopsy. In such cases the computer science creates a great platform to the next level of disease determination that reduces cost and time [6,7]. The outputs of mammography with the help of computer technologies help to predict cancer and the cancer present to be benign or malignant. The various techniques like Machine learning techniques, and Deep Learning methods and computer aided design technologies are utilized to detect the presence of cancer cells from the mammographic images. The most common tool that has inspired human in modeling complex nonlinear function is Artificial Neural network (ANN). This model recognizes the image patterns and helps in the detection of lumps in the mammogram images [8,9].

Figure 1: Mammographic images of different stages of cancer. The mammographic images of different stages of cancer. (1a) Stage o, where the tumor is benign, (1b) Stage IA, where the tumor is malignant without invasion, (1c) Stage IB, where the tumor is malignant with invasion, (1d) Stage IIA, where more than 2cm tumor observed, (1e) Stage IIB, where 0.2 mm to 2 mm sized invasion observed, (1f) Stage III, where a tumor more than 5 cm observed, (1g) Stage IV, where a very large tumor with high spreading to numerous region in breast and outside breast.
| Stage | Definition |
|---|---|
| Stage 0 Is carcinoma in situ |
Tumors that have not grown beyond their site of origin and invaded the neighbouring tissue. they include: -ductal carcinoma in situ -lobular carcinoma in situ |
| Stage 1 | Tumor size <2cm, metastases to other organs and tissues not available |
| Stage 2a | Tumor <2cm in cross-section with involvement of the lymph node or tumor from 2 cm to 5 cm without involvement of the axillary lymph nodes |
| Stage 2b | Tumor more than 5cm in cross-section (the result of the axillary lymph node research is negative for cancer cells) or tumor from 2 cm to 5cm in diameter with involvement of axillary lymph nodes |
| Stage 3a | Also, called local spread of breast cancer: tumor more than 5 cm with spread to axillary lymph nodes or tumor of any size with metastases in axillary lymph nodes, which are knitted to each other or with the surrounding tissues |
| Stage 3b | Tumor of any size with metastases into the skin, chest wall or internal lymph nodes of the mammary glands (located below the breast inside the chest) |
| Stage 3c | Tumor of any size with a more wide spread metastases and involvement of more lymph nodes |
| Stage 4 | Defined as the presence of tumors (regardless of the sizes ), spread to the parts of the body that are located far removed from the chest(bones, lungs ,liver, brainor distant lymph nodes) |
Table 1: The result of patients and control over time.
The computer aided detection is used in the field of medicine recently to reduce the medical expenses. This technique is used to determine the doubtful lesion and characterize the malignancy of the specific lesion. The detection side of this technique, the CADe helps to recognize and locate the cancerous area from the input image whereas the CADx system helps to diagnose the disease and classify the cancerous location to be benign or malignant tissue [10-13]. The cancer detection tool CADe follows a region based or pixel based algorithm to extract the Region of interest (ROIs) from the mammographic images. These methods consider the size, color, and morphology of the tumor. When the input feed of the size and morphology of the tumor is fed to the algorithm helps in detecting the region to be cancerous or normal. By sharpness and the margin distinction in any mammography image the computer aided design searches for a specific mass that denotes greater possibility to malignancy. From the image after the distinction of the mass there needs to be an extraction of the region with a higher resolution. The next step is the classification of the extracted image to be benign or malignant [14-17]. Microcalcifications are small calcium deposits that might be a symbol of starting stage of cancer in the future. Techniques like walvelet transforms, local area threshold are used to locate high spatial frequencies in the image to locate the calcification [18,19]. Right after mammography, MRI and PET biopsy is a compulsory option for the confirmation of grades of cancer. By using a CADx system the image extracted and expected to be the tumor mass can be predicted as benign or malignant [20]. The main aim of this work is to use image processing technique, neural networking to predict tumor and by using back propagation and support vector machine algorithm to detect weather the extracted tumor is benign or malignant. Here as a next level of computer aided prediction we propose a method to determine the extracted tumor image as stage I, II, III or IV. This method gives better accuracy and reduces the time and cost consumption compared to the traditional methods of cancer stage detection.
Materials and methods
Proposed system
We suggest in this paper a unique method of digital mammogram reading. There are several computer aided and image processing methods to determine the presence of breast cancer. In this paper we propose a method to determine the presence of breast cancer using Deep learning algorithm. Here we implement to use an anisotropic diffusion filtering algorithm to reduce the image noise that is observed in a negative like mammogram image. The mammogram image is subjected to peak signal to noise ratio, mean squared error, and contrast to noise ratio as a measure of image quality to increase the sharpness of the image. We also use a backpropagation and support vector machine as an optimization and regression analysis.
Big data analysis
For analyzing and storing a huge amount of mammographic images, big data analytics is a solution. The life cycle of big data is the primary prediction system. The system stimulates a predicting model, analysing disease patterns and statistical implements and algorithms to improve clinical tribulation design and more. The system being the initial stage but is the future of the while research of some immensely colossal data analytics is promising for a healthier population with an increase of life expectancy and reduction of health care cost (Scheme.1).

Scheme. 1: Complete flowchart of diagnosis of breast cancer using interactive dashboard through bigdata analysis.
Machine learning
Machine learning based on Artificial Neural Networks and Support Vector Machines have predicted a better accuracy in tumor detection and microcalcification differentiation. The mass and microcalcifications are to be differentiated to differentiate a tumor from benign or malignant. So the differentiation is usually done by the shape and margin of the mass (Figure. 2). The system by a superficial mode determines the mass shape to be regular or irregular. In most cases the regular image is benign and the irregular being malignant [21-23].

Figure 2: Neural network training tool.
The following are the few machine learning methods:
SVM-Based featureless approach
• Here the SVM utilizes 2 classifiers whereas the mass retrivation is performed by the first SVM and the other reduces false positive.
• The input datasets from the mammographic images are used as a source to compare with the test image. The stored input images are the trained images and it is done using the ANN based classifiers and logistic regression.
• The automated CAD helps in the refining of the test image by using edge based segmentation to extract ROI.
• The following five modules (Preprocessing, Filtering process, Enhancement process, Feature extraction process, Classification process) are followed to get to a conclusion of benign or malignant tissue from the ROI image extracted from the test image.
Preprocessing
The pre-processing of the input image is performed to recognize any abnormality when compared to a normal breast image [24].
Step 1: The test image is superimposed over a normal breast image to restrict the further analysis to Region of Interest (ROI). The only difference from the normal breast image to the test image will be the tumor. This specific tumor region will be extracted and that is considered as region of interest.
Step 2: In our first module, we reduce Speckle noise, a noise that reduces the quality of the image in a form of synthetic aperture radar (SAR), active radar, medical ultrasound and coherence tomography images.
Step 3: The image is saved to a JPG, DICOM, and PGM format with an image dimension changed to 256*256 or 512*512
Step 4: The size of the image is calculated.
Step 5: Speckle noise reduction is achieved by converting the image to grey color.
Filtering process
A nonlinear median filtering operation commonly used in image processing is a major tool to reduce noise in image. Most images have variations in illumination and intensity. There is also a possibility of poor contrast leading to the discomfort in using the image directly. Due to this major reason, we follow a process called as filtering to convert the pixel intensity of image to improve the corrupted image and also this process improves the contrast of the image by removing noises and helps in revealing certain minute characteristics of image. There will be template matching performed that detects the known patterns of the image to the background image given [25].
Step 1: In our next module, we use median filtering in matlab
Step 2: B = medfilt2 (A)
Median filtering performs a median filtering of the matrix A in two dimensions. The output obtained is in pixel and the result contains a median value in a 3-by-3 neighborhood around the corresponding pixel in the input image.
Step 3: Perona-Malik diffusion, another name for anisotropic diffusion is a technique to perform noise reduction without affecting the image or removing any important parts from the image content.
Enhancement process
To improve the digital image quality and to adjust the image quality the process of enlargement is usually used. Here we can brighten an image, remove the noise and also sharpen the image which helps in the easier detection of key features [26].
Step 1: To perform the process of enhancement a histogram technique is followed.
Step 2: Histogram(X) creates a histogram plot of X where the automatic bucketing is performed. It is performed to reduce minor observation errors. The main data values uses an automatic bucketin algorithm that returns bins with a uniform range that covers a specific range of elements in X focusing the background shape of distribution.
Feature extraction process
In image processing the basic feature extraction given an initial set of values and develops a set of derived values that is expected to be informative and non-redundant [27]. This leads to the following steps:
Step 1: A large input data to an algorithm that is needed to be performed can be transformed to a set of specific features that is reduced to a limited size.
Step 2: The extracted features with the necessary input to be used for further process as it is better than using the complete image of larger size.
Classification process
The support vector machine algorithm is used as a final process here to differentiate and split -ve and +ve.
If -ve “Breast cancer not confirmed” is the result obtained.
If +ve “Breast cancer” is confirmed and we analysis what kind of breast cancer using back propagation and support vector machine.
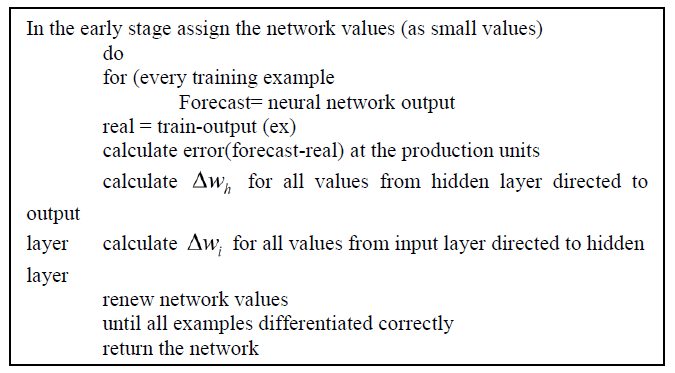
Back propagation
The multi-layered feed forward neural network is a basic structural unit where there is a multiple input fed with characteristic features in it that can be compared to the output image. The multilayer input only plays the role of passing the input vector feeding to the network. Now the hidden layer that has a connection with input layer is also connected to the output layer with connection weights.
The variations of the back propagation algorithm are as follows:
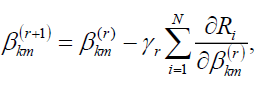
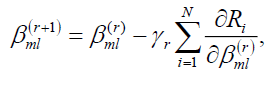
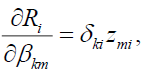
The unique approach to minimize the errors is by using gradient descent [R (θ)], called back-propagation in this setting [28]. The updated weights and biases follow,
Let  . Then:
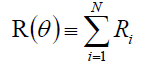
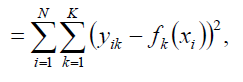
With the following derivatives:
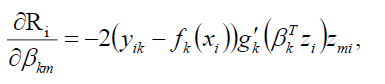
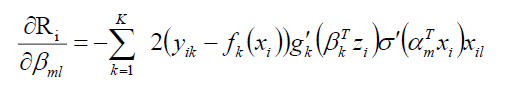
These derivatives give a (r + 1) st iteration where the learning rate is denoted as γr:
The simplified derivatives are,
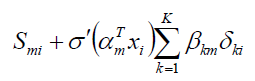
The δki and smi are quantities called as “errors”
The output layer errors 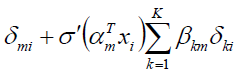
As their definition satisfying the back-propagation equations:
The two pass algorithm is used as a forward pass and backward pass to review on the errors.
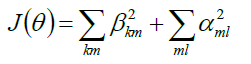
The penalty to the error, 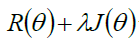 where:
Algorithm
SVM algorithm: It is a supervised learning model with a learning algorithm that uses the input data to give a result on regression analysis. A non-probabilistic binary linear classification called kernel trick is used to map their inputs into a high dimensional feature spaces. It is a hyperplane with infinite dimensional space that is utilized for regression calculation, classification etc.
The hyperplanes set a kernel function k(x, y) vector in the space.
The hyperplane vector parameter: αi
The hyperplane feature vector: xi
The hyperplane feature space: x
These are mapped in space with the relation: 
Neural network training tool: The function of nntraintool provides hidden layers and hidden neuron based on the complexity of the tool. The following characteristics of function are:
• Formula
• Data
• Hidden data
• Threshold
• Repetitions
• Start weights
• Algorithm
The number of hidden neurons should be determined in relation to the needed complexity.
Levenberg-Marquardt
Second order training speed followed the quasi-Newton methods, in which the Levenberg-Marquardt algorithm was designed [29].
The tool helps in giving the following results
• Performance
• Training state
• Error histogram
• Regression
Existing System and Proposed System
Comparison of performance-perceptron and SVM
In the below chart we can very distinctively find that perceptron, previously followed computer aided tool showed less accuracy compared to the SVM tool (Figure. 3a).

Figure 3: Existing and proposed system comparison Existing and proposed system comparison (Fig 3a) Comparison of performance of perceptron and SVM (Fig 3b) Comparison of performance of Backpropagation and SVM.
Comparison of performance-backpropagation and SVM
The comparison is done using the two important tools of Artificial Neural Networks. The performance rates of the tools are shown in the form of chart. The chart explains the performance of Backpropagation and SVM to be effective and accurate with a high-performance rate (Figure. 3b).
Results
This paper, establishes a unique method of high accuracy to predict a computer aided breast cancer analysis. The usage of Artificial Neural Network with a Support Vector Machine and Backpropagation algorithm to classify the mass of tumor as benign or malignant has been discovered to be a very efficient method with high precision. The previously used tool perceptron was shown with a less performance rate when compared to the back propagation and SVM tool. The presence f breast cancer and the classification of breast cancer with high accuracy can be performed and confirmed with neural networking tools. In this paper, we also propose a new field of research to which the ROI extracted can be compared to a series of input image to determine the shape and size of the image. Once the size of the image is determined we can predict the stages of breast cancer an early determination of breast cancer is curable. This same protocol extending to the next level of stage determination of breast cancer can also be extended and proved using the same method.
The test image fed as input (Figure. 4) to the system is compared to the healthy breast image. The test image we have fed has a presence of tumor. This test image is resized and filtered to determine the mass region of the breast (Figure. 5). When a superimposing of the image over the normal image is done only the mass expected to be the tumor is distinguished. In this test image the mass is figured filtered to increase the haziness in the image and distinguished as a region of interest (ROI) (Figure. 6). The filtered image increases the accuracy to determine the ROI. The ROI image is extracted separately erosion and segmentation of the image is performed to remove the noise in the image (Figure. 7). The image where the noise is removed undergoes an analysis to determine the calcification and shape of the image (Figure. 8). Based on the ROI the mass is separated and detected to give the end result as presence of “Breast Cancer” (Figure. 9).

Figure 4: Process Output 1. Test image saved is opened to follow the serious of process to determine the tumour.

Figure 5: Process output 2. Superimposition of test image with data sets, resizing and filtering of the mammographic image.

Figure 6: Process output 3. The Region of Interest (ROI) extraction process.

Figure 7: Process output 4. The erosion and segmentation process.

Figure 8: Process output 5. Enhancement and calcification cancer regions.

Figure 9: Process output 6. Presence of Breast cancer confirmation.
For the classification of breast cancer to be benign or malignant a major analysis of the mass is to be observed. If the mass extracted is of a specific shape probably rounded, then the cancer has not started its proliferation to the neighboring region. So, if the mass observed is round or with a specific shape then the cancer expected can be classified as benign. If there is any irregular shape observed in the extracted mass it can be concluded as the tumor has started spreading to the neighboring regions leading to an irregular mass. This irregular mass observed can be proposed as malignant cancer. The tumor determined output fed to the neural network training tool (Figure. 10) performances several tasks to confirm the accuracy of the image extraction and result prediction. The training tool gives a performance result that shows a mean squared error chart as a comparison with training set and the test input (Figure. 11). The tool also gives an error histogram result, regression chart and training state of the input image (Figure. 12-14). These are tools for a confirmation of accuracy determination in the process performed.

Figure 10: Process output 7-Neural Network Training (nntraintool) Neural network training tool-fed with the output result.

Figure 11: Neural network training tool-Performance chart. Performance chart-The test image showing the 10° Mean Squared Error performance rate when compared to the validation and train data set values.

Figure 12: Neural Network Training state gradient graph.

Figure 13: Neural network training error histogram.

Figure 14: Neural network regression graph
Discussion and Conclusion
This paper, establishes a unique method of high accuracy to predict a computer aided breast cancer analysis. The usage of Artificial Neural Network with a Support Vector Machine and Backpropagation algorithm to classify the mass of tumor as benign or malignant has been discovered to be a very efficient method with high precision. The previously used tool perceptron was shown with a less performance rate when compared to the back propagation and SVM tool. The presence of breast cancer and the classification of breast cancer with high accuracy can be performed and confirmed with neural networking tools.
In this paper, we also propose a new field of research to which the ROI extracted can be compared to a series of input image to determine the shape and size of the image. Once the size of the image is determined we can predict the stages of breast cancer an early determination of breast cancer are curable. This same protocol extending to the next level of stage determination of breast cancer can also be extended and proved using the same method.
Acknowledgements
We acknowledge and are very grateful for the support of Veltech Dr. RR & Dr.SR University in the implementation of this work.
References
- Ireaneus Anna Rejani Y, Thamaraiselvi S. Breast cancer detection using multilevel thresholding. Int J comput sci infsecur. 2009;6:25-32.
- Edriss Ali E, Zhi Feng W. Attribution CC BY breast cancer classification using support vector machine and neural network. Int JSciRes. 2014;5:6-14.
- Al Muhrib TK, Al-Raheem SN, Atoum MF, et al.TNM staging and classification (familial and nonfamilial) of breast cancer in Jordanian females. South Asian J Cancer. 2010;47:194-8.
- Moh?dRasoul A, Al-Hadidi, Mohammed Y, et al. Solving mammography problems of breast cancer detection usingartificial neural networks and image processing techniques.J Pharm Biomed Anal. 2012;5:74-84.
- Bird RE, Wallace T, Yankaskas B. Analysis of cancers missed at screening mammography. OJRad. 1992;184:613-7.
- Kerlikowske K. Performance of screening mammography among women with and without a first-degree relative with breast cancer. Ann Intern Med. 2000;133:855-8.
- Giger ML. Computer-aided diagnosis in radiology. AcadRadiol. 2002;9:1-8.
- Kumari M, Godara S. Comparative study of data mining classification methods in cardiovascular disease prediction. J Chromatogr. 2011;2:304-8.
- Abbass HA, An evolutionary artificial neural networks approach for breast cancer diagnosis. ArtifIntell Med. 2002;25:265-71.
- Getty DJ. Enhanced interpretation of diagnostic images. Invest Radiol. 1998;23:240-5.
- Horsch K. Classification of breast lesions with multimodality computer-aided diagnosis: observer study results on an independent clinical data set. South Asian J Cancer. 2006;240(2):357-68.
- Huo Z. Effectiveness of computer-aided diagnosis: Observer study with independent database of mammograms. AcadRadiol. 2002;224:560-8.
- Jiang Y. Improving breast cancer diagnosis with computer-aided diagnosis. AcadRadiol. 1999;6:22-33.
- Matsubara T. Development of mass detection algorithm based on adaptive thresholding technique in digital mammograms. Arzneim-Forsch/Drug Res. 1996;1:391-6.
- Brzakovic D, Luo X, Brzakovic P. An approach to automated detection of tumors in mammograms. IEEE Trans Med Imaging. 1990;9:233-41.
- Qian W. Digital mammography: Comparison of adaptive and non-adaptive CAD methods for mass detection. AcadRadiol. 1999;6;471-80.
- Brake GM, Karssemeijer N, Hendriks JHCL. An automatic method to discriminate malignant masses from normal tissue in digital mammograms. Phys Med Biol. 2000;45:28-32.
- Yoshida H. An improved computer-assisted diagnostic scheme using wavelet transform for detecting clustered microcalcifications in digital mammograms. AcadRadiol. 1996;3:621-7.
- A training algorithm for optimal margin classifiers, in: Proceedings of the fifth annual workshop on computational learning theory. Geneva, October, 1992.
- Nishikawa RM, et al. Computer-aided detection of clustered microcalcifications on digital mammograms. Indian Drugs. 2012;33:174-8.
- Marzban C. The ROC curve and the area under it as performance measures. Indian Drugs. 2004;19:1106-14.
- Setiono R. Generating concise and accurate classification rules for breast cancer diagnosis. ArtifIntell Med. 2000;18:205-19.
- BelciugS. A two stage decision model for breast cancer detection. Mathematics and Computer Science Series. 2010;37:27-35.
- DanjumaKJ. Performance evaluation of machine learning algorithms in post-operative life expectancy in the lung cancer patients.ArtifIntell Med. 2000;16:106-13.
- Manyika M, Chui B, Brown J, et al. Big data: The next frontier for innovation, competition, and productivity. Acad Radiol. 2011;5:420-8.
- Noble M, Bruening W, Uhl S, et al. Computer-aided detection mammography for breast cancer screening: Systematic review and meta-analysis.South Asian J Cancer. 2009;10:279:281.
- Paulin F, Santhakumaran A. Classification of breast cancer by comparing backpropagation training algorithms. Int J comput sci inf Sec. 2011;3:327-32.
- Randall Wilsona D, Martinez TR. The general inefficiency of batch training for gradient descent learning. Int J of NeurNetw. 2003;16:1429-51.
- Shantha Lakshmi G, Mohamed Faize Basha B.Colorectal cancer detection using image processing based on IGVF model.Int JComput Eng Info Technol. 2014;16:39-43.