Original Article
, Volume: 12( 2)Synthesis and Characterization of Binuclear Complexes Derived from (E, E)-N, N''-(6-Aminopyrimidine-2, 4-Diyl) Bis-(N'-Phenylcarbimidothioic Acid; L1) and its Biological Activity
- *Correspondence:
- Mohsen M Mostafa Department of Chemistry, Mansoura University, Egypt, Tel: 00-202-01067446662; E-mail: amohsenmostafa@yahoo.com
Received Date: June 27, 2017 Accepted Date: July 16, 2017 Published Date: July 24, 2017
Citation: Mosaad RM, Mohsen MM. Synthesis and Characterization of Binuclear Complexes Derived From (E, E)-N, N''-(6- Aminopyrimidine-2,4-Diyl) Bis-(N'-Phenylcarbimidothioic Acid; L1) and It’s Biological Activity. Inorg Chem Ind J. 2017;12(2):113
Abstract
Binuclear Cu2+, Co2+, Pt4+, Pd2+ and Nd3+ complexes derived from L1 were synthesized and characterized by elemental analyses, spectral, magnetic and thermal measurements. IR, 1H-NMR and 13C-NMR spectra suggest that L1 behaves as binegative tetradentate coordinating in the thiol form via the two nitrogen of pyrimidine rings and two thiol sulfurs with losing two protons from the SH groups in all complexes except Nd3+. Tetrahedral geometry is proposed for Cu2+ and Co2+, octahedral for Pt4+ and square-planar for Pd2+ complexes. The HOMO and LUMO were estimated to confirm the geometry of L1 and the complexes. Cu2+, Co2+ and Nd3+ complexes exhibit the potent antioxidant activity upon coordination while L1, Pd2+ and Pt4+ complexes didn’t show SOD like radical scavenger activity. Finally, the cytotoxic activity assay against HePG2 cell line proved that the Nd3+ and Pd2+ complex have the highest cytotoxic activity, while L1 and other complexes showed no cytotoxic activity.
Keywords
Spectral studies; Thermal analysis; DFT calculations; Antioxidant activity; Cytotoxic activity
Introduction
Pyrimidine derivatives represent a class of heterocycles of great importance. Many pyrimidines or their derivatives possess remarkable biological activity and have been widely used in fields ranging from the medicinal to industrial applications. Certain Pt2+ complexes with pyrimidines display a definite on costatic effect [1-3]. The ability of 2-aminopyrimidine to form complexes with transition metal ions is of great interest. Complexes of 2-aminopyrimidine of the type cis- or trans-[PtL2X2] type were known [4]. 2-Aminopyrimidines are coordinated to the inner-sphere of Pt2+ as a monodentate ligands and the bond with the metal is formed with the heterocyclic (N) nitrogen atom of the pyrimidine ring [4]. On contrast a literature survey revealed only an example of Pd2+ complex with 2-amino-4, 6-dimethylpyrimidine which is bound to the ligand through the pyrimidine ring nitrogen atom while the amino group is not involved in the complex formation [5]. Thiourea derivatives have been extensively studied as a potential anti-TB, anti-HIV, anti-tumor and plant growth regulators [6-8]. Poly azomethines have been widely studied for their high thermal stability, mechanical properties, electrical and magnetic properties, liquid crystal properties and non-linear optical properties [9,10]. Thiourea and its related molecules are important as structural components and as intermediates in agricultural and pharmaceutical chemistry [11]. Recently, these compounds have attracted considerable attention for their potential use as binding units for artificial receptors in supramolecular chemistry because of their characteristic behavior based on Lewis acids and strong hydrogen-bond donors [12]. Furthermore, thioureas serve as a useful scaffold by connecting them to electroluminescent organic dyes [13]. Their enormous potential led to the development of several methods for preparing thiourea derivatives [14]. The most common of these methods involves the condensation of isothiocyanates with amino derivatives. However, despite its utility and simplicity, limitations are sometimes encountered, particularly with less reactive amine substrates. The present work aims to synthesize and characterize complexes of (E,E)-N, N''-(6-aminopyrimidine-2, 4-diyl) bis-(N'-phenylcarbamimidothioic acid) with Cu2+, Co2+, Pt4+, Pd2+ and Nd3+ ions. The possible modes of chelation, the geometry and the nature of bonding of the complexes are discussed on the basis of various spectroscopic techniques, elemental analyses, spectral (IR, UV-vis., 1H-NMR, 13C-NMR and mass), magnetic and thermal measurements. Moreover, our attention is directed to evaluate of the antioxidant and anticancer activity of L1 and the isolated complexes.
Experimental
Instrumentation and materials
All the chemicals were purchased from Aldrich and Fluka and used without further purification. Sodium pyrophosphate, NBT (nitro blue tetrazolium), NADH (nicotin amide adenine dinucleotide; reduced form (sodium salt, Sigma), phenazine methosulfate (sodium salt). The growth medium DMEM-Dulbecco's Modified Eagle Medium (Gibco®), fetal bovine serum (FBS), penicillin, streptomycin and trypsin were used in the studies of biological activity. Carbon, hydrogen and metal contents (Cu2+, Co2+, Pt4+, Pd2+ and Nd3+ ions) were determined by the standard methods [15]. IR spectra (4000 cm-1-400 cm-1) for KBr discs were recorded on a Mattson 5000 FTIR spectrophotometer. Electronic spectra were recorded on a Unicam UV-Vis and UV2 and V-100 spectrophotometers. The magnetic measurements were carried out at room temperature (25°C) on a Sherwood magnetic balance. Diamagnetic corrections were calculated using Pascal's constants [16]. 1H-NMR and 13C-NMR measurements in d6-DMSO at room temperature were carried out on Jeol-90Q Fourier transform (400 MHz) spectrometer at the Microanalytical Unit, Cairo University and King Saud University, Saudi Arabia. The mass spectra of the ligands were recorded on MS 70 eV EIGC, MS QP-1000 EX Shimadzu (Japan) mass spectrometer at Cairo University. Also, the mass spectra of the four complexes were recorded using direct inlet unit (DI-50) of Mass Spectrometer model SHIMADZU GC/MS-QP5050A at the Regional Center for Mycology and Biotechnology, Al-Azhar University. TGA measurements in the range 20°C-800°C were recorded on a TGA-50 Shimadzu TGA analyzer at a heating rate of 15°C/min and nitrogen flow rate of 20 mL/min.
Synthesis of (E, E)-N, N''-(6-aminopyrimidine-2, 4-diyl) bis-(N'-phenylcarbamimidothioic acid) (L1): L1 was synthesized by refluxing hot ethanolic solution of pyrimidine-2, 4, 6-triamine (1.3 g, 0.01 mol) and phenyl isothiosyanate (2.4 g, 0.02 mol) in 1:2 M ratio for 4 h. The solution was evaporated and after cooling a yellow solid was precipitated. The precipitate was filtered off, recrystallized from absolute ethanol (Yield: 78%) and finally dried in a desiccator over anhydrous P4O10. The purity was checked by TLC and spectra (IR, 1H-NMR, 13C-NMR and mass). The melting point of L1 was found to be (190°C).
Synthesis of Cu2+, Co2+, Pt4+ , Pd2+ and Nd3+ complexes: A hot EtOH solution of metal chlorides (CuCl2, CoCl2, PtCl4, PdCl2 and NdCl3; 0.0025 mol) was added to hot EtOH solution of L1 (1 g, 0.0025 mol) in 1:1 (M:L) molar ratio. The mixture was heated under reflux for 1.5 h. The pH of the solutions was found in the range 4, 5, 2, 5 and 4, respectively. The isolated solid complexes were filtered off, washed with EtOH followed by diethyl ether and finally dried in a vacuum desiccator over anhydrous P4O10. The complexes are stable in air and soluble in polar solvents.
Biological studies
Superoxide dismutase (SOD) like radical scavenger activity: The antioxidant activity of the isolated complexes and L1 was evaluated [17]. This assay relies on the ability of L1 or its complex to inhibit the phenazine methosulphate-mediated reduction of nitroblue tetrazolium (NBT) dye. The SOD reaction mixture was contained in a final volume of 3.0 mL. It was composed of 0.5 mL of 0.3 mmol NBT, 0.5 mL of 0.47 mmol NADH, 1.8 mL of 0.1 M sodium pyrophosphate buffer, 0.1 mL of L1 or complex and 0.1 mL of 0.093 mmol phenazine methosulfate (PMS). The reaction was initiated by the addition of PMS and the increase in absorbance at 560 nm was followed with a recording spectrophotometer for five min. The percent inhibition was evaluated as reported earlier [17].
Viability of HepG2 cell cultures: Hepatocellular carcinoma (HCC) cell line HepG2 was obtained from VACSERA, Egypt. The viability of HepG2 cells in culture was calculated by the MTT assay [18]. All experiments were performed in triplicate.
Computational details
We performed cluster calculations using DMOL3 program [19-24] in Materials Studio package [25], which is designed for the realization of large-scale density functional theory (DFT) calculations. DFT semi-core pseudopods calculations (dspp) were performed with the double numerical basis sets plus polarization functional (DNP). The DNP basis sets are of comparable quality to 6-31G Gaussian basis sets [26]. Delley et al. showed that the DNP basis sets are more accurate than Gaussian basis sets of the same size [25]. The RPBE functional [27] is so far the best exchange-correlation functional [28], based on the generalized gradient approximation (GGA), is employed to take account of the exchange and correlation effects of electrons. The geometric optimization is performed without any symmetry restriction.
Results and Discussion
The data of elemental analyses together with some physical properties of the complexes are listed in Table 1. The structures of the complexes are established by elemental analyses and by weight loss determination. The values of molar conductivity of all complexes lie in the 6 ohm-1 cm2 mol-1-13 ohm-1 cm2 mol-1 range (Table 1) indicating their non-electrolytic nature except the Cu2+ complex (82 ohm-1 cm2 mol-1) which is electrolytic in nature [29].
| Compound (Empirical formula) |
M.Wt | Color | M.P.; (°C) |
% Found (Calcd.) | A+ m DMSO |
Yield (%) |
|||
|---|---|---|---|---|---|---|---|---|---|
| C | H | M | Cl | ||||||
| L1.EtOH; C20H23N7OS2 | 441.585 | Yellow | 190 | 53.6 (54.4) |
4.5 (5.3) |
--- | --- | --- | 78 |
| [Cu2(L1)(H2O)4]2Cl.3H2O C18H29Cu2N7O7S2Cl2 |
717.609 | Greenish-brown | 250 (char.) |
29.3 (30.1) |
3.8 (4.1) |
17.4 (17.7) |
9.7 (9.9) |
82 | 83 |
| [Co2(L1)(H2O)2Cl2] C18H19Co2N7O2S2Cl2 |
618.297 | Green | 243 (char.) |
35.3 (35.0) |
3.9 (3.1) |
18.9 (19.1) |
11.4 (11.5) |
8 | 76 |
| [Pt2(L1)(H2O)2Cl6].EtOH C20H25Pt2N7O3S2Cl6 |
1078.479 | Light brown | >300 | 21.6 (22.3) |
3.0 (2.3) |
--- | 20.0 (19.7) |
13 | 90 |
| [Pd2(L1)(H2O)2Cl2].1/2EtOH C19H22Pd2N7O5/2S2Cl2 |
736.312 | Dark brown | 240 (char.) |
30.0 (30.9) |
3.8 (3.0) |
29.4 (28.9) |
10.1 (9.6) |
11 | 69 |
| [Nd2(L1)(H2O)2Cl6] C18H33Nd2N2O8S2Cl6 |
1040.841 | Pale yellow | >300 | 21.4 (20.8) |
3.6 (3.2) |
28.2 (27.7) |
19.8 (20.4) |
6 | 87 |
Table 1. Analytical and physical data of L1and its metal complexes.
IR spectra
The IR bands of L1 and its complexes are recorded in Table 2. L1 can be represented by two tautomeric forms, the thione (a) and thiol (b) forms as shown in (Figure 1). The IR spectrum of L1 in KBr shows three bands at 3445 cm-1, 3412 cm-1 and 3337 cm-1 assigned to ν (OH, EtOH), νa (NH2) and νs (NH2) [30], vibrations, respectively. Also, the spectrum shows three bands at 3308 cm-1, 3278 cm-1 and 3178 cm-1 assigned to ν (NH) vibrations [31]. The observation of three bands for the NH group suggests that the possibility of thione/thiol tautomerism (HN-C=S/N=C-SH). The bands located at 3661cm-1, 1606 cm-1 and 1555 cm-1 are assigned to (C=N)azo., (C=C) phenyl and (C=N) of the pyrimidine ring, respectively [32]. The weak band at 2360 cm-1 which is characteristic for the SH group. The presence this band suggests that the free ligand exists mainly in the thiol form [33] (Figure 1b). The previous assumption is confirmed by the molecular modeling of L1 as shown in (Figure 2).

Figure 1: (E, E)-N, N''-(6-aminopyrimidine-2, 4-diyl) bis-(N'-phenylcarbamimidothioic acid; L1).

Figure 2: Molecular modeling of (a) L1 (b) electron density.
| Compound | ν (OH) | ν (NH2) | ν(NH) | ν(SH) | ν(C=N)azo | ν(C=N)pyr | ν(M-S) | ν(M-N) |
|---|---|---|---|---|---|---|---|---|
| L1.EtOH; C20H23N7OS2 | 3445 | (3412)as (3337)s |
3308 3278 3187 |
2360 | 1663 | 1555 | ---- | ---- |
| [Cu2(L1)(H2O)4]2Cl.3H2O C18H29Cu2N7O7S2Cl2 |
3441 | (3400)as (3337)s |
3186 | ---- | 1668 | 1533 | 473 | 430 |
| [Co2(L1)(H2O)2Cl2] C18H19Co2N7O2S2Cl2 |
3552 | (3437)as (3327)s |
3192 | ---- | 1655 | 1551 | 447 | 421 |
| [Pt2(L1)(H2O)2Cl6].EtOH C20H25Pt2N7O3S2Cl6 |
3523 | (3410)as (3317)s |
3194 | ---- | 1642 | 1534 | 480 | 430 |
| [Pd2(L1)(H2O)2Cl2].1/2EtOH C19H22Pd2N7O5/2S2Cl2 |
3437 | (3415)as (3319)s |
3180 | ---- | 1643 | 1536 | 490 | 425 |
| [Nd2(L1)(H2O)8Cl6] C18H33Nd2N7O8S2Cl6 |
3445 | (3411)as (3339)s |
3278 3191 |
---- | 1661 | 1550 | 450 | 429 |
azo: azomethine; pyr: pyrimidine ring
Table 2. Principle IR bands of L1 and its metal complexes.
A comparison of the IR spectra of L1and its metal complexes (Table 2) shows that L1 coordinates to all metal ions in a ratio 2:1 (M: L). L1 behaves as binegative tetradentate coordinating in the thiol form via the two nitrogen of pyrimidine ring and two thiol sulfurs with losing two protons from the SH groups in all complexes except Nd3+ complex in which L1 behaves as binegative tetradentate coordinating in the thione form through the two nitrogen of pyrimidine ring and two thione sulfurs. The presence of thiol form in Cu2+, Co2+, Pt4+ and Pd2+ complexes is supported by the absence of the bands assigned to (SH) and (C=S) in the spectra of complexes. L1 behaves as a binegative NNSS tetradentate ligand via the two nitrogen of the pyrimidine ring and the two thiol sulfur atoms in case of Cu2+ and Co2+ complexes with the general formulae, [Cu2(L1) (H2O)2]2Cl.3H2O and [Co2(L1) (H2O)2Cl2], (Figure 3 and Figure 4). This behavior is supported by:

Figure 3: Molecular modeling of [Cu2(L1) (H2O)2]2Cl.3H2O.

Figure 4: Molecular modeling of [Co2(L1)(H2O)2Cl2].
i. The disappearance of the band assigned to (SH) indicates the participation of this group in coordination with deprotonation [13].
ii. The negative shifts of the bands in the regions 1551 cm-1-1553 cm-1 attributed to pyrimidine ring indicate that this group takes part in coordination (163).
iii. The appearance of band in the region 1668 cm-1-1655 cm-1 assigned to azomethine group (C=N) is taken as an additional evidence of the presence of thiol form.
iv. New bands are observed in the regions (473, 447 and 430, 421) cm-1 assigned to (M-S) and (M-N), respectively [15].
v. The spectra of the complexes show a broad medium band at 3441 cm-1 and 3552 cm-1, attributable to water of coordination as well as the water of solvation [16].
In [Pt2 (L1) (H2O)2Cl6]. EtOH and [Pd2 (L1) (H2O)2Cl2].1/2EtOH complexes (Figure 5 and Figure 6), L1 behaves as a binegative NNSS tetradentate manner through two (C=N) of pyrimidine ring and two S atoms of deprotonated C-SH groups. This behavior is revealed by the shift of (C=N)pyr to lower wavenumber, the appearance of band assignable to (C=N)azo and disappearance attributed to (S-H) bands. The spectra of the complexes show a broad medium band at 3523 cm-1 and 3437 cm-1 attributable to water of coordination as well as the EtOH of solvation, respectively [36].

Figure 5: Molecular modeling of [Pt2(L1) (H2O)2Cl6].EtOH.

Figure 6: Molecular modeling of [Pd2(L1) (H2O)2Cl2].1/2EtOH.
The IR spectrum of [Nd2 (L1) (H2O)8Cl6] (Figure 7) shows that L1acts as NSNS neutral tetradentate via two (C=N)pyr and both (C=S).

Figure 7: Molecular modeling of [Nd2 (L1) (H2O)8Cl6].
This behavior is supported by:
i. Shift of (C=N)pyr to lower wavenumber indicating the coordination of the metal ions to pyrimidine nitrogen [17].
ii. The appearance of band at 3278 cm-1 assigned (NH) vibration and no observation of a band characteristic for a thiol group (2300 cm-1-2650 cm-1) is found in the spectrum of the Nd3+ complex is taken as evidence of the presence of thione form [18,39].
iii. The existence of water within the coordination sphere in the hydrated complex is supported by the appearance of band at 3445 cm-1 in the IR spectra of the Nd3+ complex [34].
iv. New bands are observed in case of Nd3+ complex at 450 cm-1 and 429 cm-1 which are tentatively assigned to the (M-S) and (M-N) [36], respectively.
1H-NMR and 13C-NMR spectra
The 1H-NMR spectrum of L1 in d6-DMSO displays three signals at 11.52 ppm, 7.72 ppm and 5.91 ppm, relative to TMS, assigned to SH [41], NH [30] and CH [42,43] protons, respectively. The multiplet signals at (6.16-7.37) ppm are assigned to the protons of the phenyl ring. The signal at 3.4 ppm is attributed to the NH2 protons while the signals at 4.8 ppm, 3.5 ppm and 1.1 ppm are attributed to OH, CH2 and CH3 protons of EtOH [40] confirming the proposed formula. The presence of SH signal confirms that the ligand is existed in the thiol form in the solid state as shown in (Figure 1b). Additional evidence for the structure of L1 comes from the 13C-NMR spectrum (Figure 8) in which the chemical shift of (C6 and C2) are observed at 195.5 ppm [44] and the (N5) atom causes a large downfield shift of the (C6 and C2) resonance. Also, the signal of (C9-SH) is observed at 161.8 ppm while the signal of (C4) appears at 160.7 ppm. Aromatic phenyl carbons give signals in overlapped areas of the spectrum with chemical shift values from 140.4 ppm-124.3 ppm and the signal due to CH of pyrimidine ring is observed at 94.6 ppm. The signals due to (CH2 and CH3) of EtOH are observed at 57 ppm and 19 ppm, which is taken as a strong evidence of the existence of EtOH.

Figure 8: 13C-NMR spectrum of L1 in d6-DMSO.
The 1H-NMR spectra of Pt4+ and Pd2+ complexes show the absence of the signal at 11.52 ppm assignable to (SH) proton confirming the participation of two thiol group in coordination to the metal ion together deprotonation. The presence of signals at 10 ppm and 4 ppm which disappeared upon addition of D2O attributed to NH and (OH of EtOH and H2O). The signals observed at 1.05 ppm and 3.5 ppm in Pt4+ and Pd2+ complexes are attributed to the protons of CH3, CH2 of EtOH which is existed outside the coordination sphere [40].
The 1H-NMR spectrum of Nd3+ complex (Figure 8) displays two signals at 12.0 and 3.4 ppm, relative to TMS, assigned to NH [30] and NH2 protons, respectively. The signal of the OH proton of the H2O molecule is combined with NH2 signal and observed at 3.4 ppm. The observation of the first signal at 12.0 ppm, downfield of TMS, in comparison to that observed in the spectrum of the free L1 suggests that the complex is mainly exists in the thione form. The multiplet signals at (7.2-7.5) ppm are assigned to the protons of the phenyl ring and CH of pyrimidine ring [42,43]. Additional evidence for the structure of the Nd3+ complex comes from the 13C-NMR spectrum, in which chemical shift of (C9-S) is observed at 189.5 ppm suggests that the complex is mainly exists in the thione form. The signals of the carbons characterized to the C6, C2 and C4 are overlapped together and are observed at 152.97 ppm [44]. This signal is shifted to up field in comparison to that observed in the spectrum of the free ligand due to the involvement of N5 and N3 in coordination. Aromatic phenyl carbons give signals in overlapped areas of the spectrum with chemical shift values from 140.04 ppm-124.1 ppm. The signal due to CH of pyrimidine ring is observed at 93.3 ppm.
Mass spectrum of L1
The mass spectrum of L1 (Figure 9) shows the molecular ion peak at m/z=441 (72%) corresponding to (C20H23N7OS2), M.wt=441.585. Also, the results of elemental analyses, 1H-NMR and 13C-NMR spectra are taken as evidences for the proposed structure.

Figure 9: Mass spectrum of L1.
The fragmentation pattern of L1 shows corresponding to the successive degradation of the ligand (C20H23N7OS2). The first peak at m/z=441 with 72% abundance represents the molecular ion (Calcd. 441.585). The peak in 394 with 26% abundance correspond to [C18H17N7S2]+ (Calcd. 395.515). There are signals represent the stepwise loss of Ph-N, SH and Ph-N fragments; [C12H12N6S2]+ in 304.9 with 8% (Calcd. 304.4), [C12H11N6S]+ in 272.9 with 30% Calcd. 272.33) and [C6H6N6S]+ in 180.9 with 27% abundance (Calcd. 180.22), respectively, and the peak in 133 with 100% abundance represent of [C5H5N5]+ (Calcd. 135.13) fragment. The peaks at 120 and 61 with 7 and 84% abundance (Calcd. 120.12 and 63.1) correspond to [C5H4N4]+ and [C4HN]+ fragments, respectively.
Electronic spectra and magnetic data
The electronic spectra of L1 and its complexes were displayed in Nujol mull. The spectra of the complexes are dominated by intense intra-ligand charge-transfer bands. The spectrum of the ligand shows two bands at 292 nm and 344 nm (34246 and 29069 cm-1) region assignable to π → π* transition of (C=N)azo and (C=N) pyrimidine rings, respectively [45].
The electronic spectrum of the Cu2+ complex in Nujol shows two bands at 604 nm and 492 nm (16556 cm-1 and 20325 cm-1) assigned to the 2B2 → 2E and 2B2 → 2B1 transitions in a tetrahedral geometry around the Cu2+ion [46]. Also, the band at 441 nm (22675 cm-1) is assigned to charge-transfer of the type (L → M) transition. Moreover, the value of the corrected magnetic moment (μeff=1.3 BM) per each Cu2+ion [47]. The electronic spectrum of the Co2+ complex shows four bands at 671 nm, 600 nm, 172 nm and 436 nm (14903 cm-1, 16666 cm-1, 21186 cm-1 and 22935 cm-1). The first band is attributed to 4A2 → 4T1 (F) in a tetrahedral geometry around the Co2+ ion. The second band (16666 cm-1) is assigned to 4A2 → 4T1 (P) [48]. The other two bands at 21186 cm-1and 22935 cm-1 are assigned to charge-transfer (L → M). Also, the value of the corrected magnetic moment (μeff=4.3 BM) per each Co2+ ion is taken as a strong evidence for the existence of a tetrahedral geometry around the Co2+ [49]. The ligand field parameters were calculated and found to be (Dq, B and β) are: 640.8 cm-1, 513.1 cm-1 and 0.53 cm-1 respectively.
The electronic spectrum of the diamagnetic [Pd2 (L1) (H2O)2Cl2].1/2EtOH, shows bands at 401 nm and 485 nm (24937 cm-1 and 20618 cm-1) due to 1A1g →1B1g and 1A1g →1Eg transitions in a square-planar configuration. But the absorption band 539 nm (18552 cm-1) is assigned to combination of charge-transfer transitions from the Pd2+ d-orbital to the π*-orbital of L1 [50,51]. The Nd3+ complex shows four bands at 802 nm, 746 nm, 428 nm and 304 nm (12468 cm-1, 13404 cm-1, 23364 cm-1and 32894 cm-1). The two first bands are assigned to 4I9/2 → 4I13/2 and 4I9/2 → 4I15/2, while the other two bands are assigned to 4I9/2 → 4F3/2 and 4I9/2 → 4F5/2. The value of magnetic moment (μeff=3.8 BM) falls in the range reported for Nd3+ ions [52] per each Nd3+ ion.
Molecular modeling
Geometry optimization with DFT method: The analysis of the data in Tables 1 and 2 calculated for the bond lengths and angles for the bond, one can conclude the following remarks:
The bond angles of the L1 are altered somewhat upon coordination, the largest change affects C (3)-Npyr (1)-C (2), C (2)-N (12)-C (19), N (12)-C (19)-S (21), N (5)-C (4)-N (10), C (4)-N (10)-C (9), and N (10)-C (9)-S (11), which are reduced or increased on complex formation as a consequence of bonding [53].
1. The bond angles in case of [Cu2(L1) (H2O)4]2Cl.3H2O and [Co2(L1)(H2O)2Cl2] complexes afforded an tetrahedral geometry, while in the [Pt2(L1)(H2O)2Cl6].EtOH is quite near to an octahedral geometry predicting, and adopts a square-planar arrangement in [Pd2(L1)(H2O)2Cl2].1/2EtOH.
2. All the active groups taking part in coordination have bond lengths longer than that already exist in the ligand (like C-S and C=Npyr) [53].
3. The optimized C=N bond length in the pyrimidine ring is elongated due to its coordination in all complexes. The N (10)-C (9), Nazo (8)-C (9), N (12)-C (19), Nazo (20)-C (19), C (9)-S (11) and C (19)-S (21), bond lengths become slightly longer in complexes as the coordination takes place via S (11) and S (12) atoms which is formed on deprotonation of SH group in [Cu2(L1)(H2O)4]2Cl.3H2O, [Co2(L1)(H2O)2Cl2], [Pt2(L1)(H2O)2Cl6].EtOH and [Pd2(L1)(H2O)2Cl2].1/2EtOH. This is taken as evidence that the ligand is coordinated to the metal ion in thiol form.
4. S (11)-C (9) and S (21)-C (19) thione type in [Nd2(L1) (H2O)8Cl6] no enolized leading to appearance of double bond character over S (11)-C (9) and S (21)-C (19) and its absence over N (10)-(C9) and N (20)-C (19).
5. The complexes of L1 can be arranged according to M-Npyr bond length as follows: N (5)-Nd (29)>N (5)-Pt (28)>N (5)-Co (28)>N (5)-Pd (28)>N (5)-Cu (28).
6. The complexes of L1 can be arranged according to M-S bond lengths as follows: S(11)-Nd (29)>S (11)-Pt (28)>S (11)-Co (28)>S (11)-Pd (28)>S (11)-Cu (28).
7. All bond lengths correlate with the experimental IR frequencies. As there is an elongation in the bonds, a lower energy of the vibration frequency is needed and the lower frequency is approved by the experimental IR frequency values.
8. The bond angles within the L1 backbone do not change significantly but the angles around the metal undergo appreciable variations upon changing the metal center.
Chemical reactivity
Global reactivity descriptors: The determination of energies of the HOMO (π donor) and LUMO (π acceptor) are important parameters in quantum chemical calculations. The HOMO is the orbital that primarily acts as an electron donor and the LUMO is the orbital that largely act as the electron acceptor. These molecular orbitals are also called the frontier molecular orbitals (FMOs).
i. The EHOMO and ELUMO and their neighboring orbitals are all negative (Table 3), which indicate that the prepared molecules are stable [54].
| Compound | EH eV |
EL eV |
(EH-EL) eV |
χ eV |
µ eV |
Η eV |
S eV-1 |
ω eV |
? eV |
|---|---|---|---|---|---|---|---|---|---|
| APCA | -4.836 | -1.828 | -3.008 | 3.332 | -3.332 | 1.504 | 0.752 | 8.348872 | 0.664894 |
| Cu complex | -3.762 | -1.877 | -1.885 | 2.8195 | -2.8195 | 0.9425 | 0.47125 | 3.74624 | 1.061008 |
| Co complex | -4.042 | -2.447 | -1.595 | 3.2445 | -3.2445 | 0.7975 | 0.39875 | 4.197554 | 1.253918 |
| Pt complex | -4.18 | -2.816 | -1.364 | 3.498 | -3.498 | 0.682 | 0.341 | 4.172477 | 1.466276 |
| Pd complex | -4.807 | -3.534 | -1.273 | 4.1705 | -4.1705 | 0.6365 | 0.31825 | 5.535345 | 1.571092 |
| Nd complex | -5.568 | -3.085 | -2.483 | 4.3265 | -4.3265 | 1.2415 | 0.62075 | 11.61957 | 0.805477 |
H: HOMO; L:LUMO
Table 3. Calculated EHOMO, ELUMO, energy band gap (EH-EL), chemical potential (μ), electronegativity (χ), global hardness (η), global softness (S), global electrophilicity index (ω) and softness (?) for L1 and its complexes.
ii. The FMOs theory predicts sites of coordination (electrophilic attack) on aromatic compounds. An initial assumption is that the reaction takes place with maximum overlap between the HOMO on one molecule and the LUMO on the other. The overlap between the HOMO and the LUMO is a governing factor in many reactions. The aim of calculations is to search for the largest values of molecular orbital coefficients. So, orbitals of the ligand with the largest value of molecular orbital coefficients may be considered as the sites of coordination. This conclusion is confirmed by the data obtained from the calculations indicating that the nitrogen of the (C=N) pyrimidine groups and sulfur of deprotonated (C-SH) groups have the largest values of molecular orbital coefficients.
iii. Gutmann’s variation rules, ‘‘the bond strength increases as the adjacent bonds become weaker’’ such as found by Linert et al. [55]. This interpretation agrees well with the resultant as the increase of the EHOMO is accompanied by a weakness (elongation) of the metal-ligand bonds, which leads to a strengthening (shortness) of the sites adjacent to the metal ligand centers.
iv. The HOMO level is mostly localized on the N (3), N (5) and deprotonated S (11) and S (21) atoms (Figure 10) indicating that this atom are the preferred nucleophilic sites at the central metal ion. This means that these moieties, with high coefficients of HOMO density are oriented toward the metal ions.

Figure 10: 3D plots frontier orbital energies using DFT method for L1.
v. The energy gap (EHOMO-ELUMO) is an important stability index which helps to characterize the chemical reactivity and kinetic stability of the molecule [56]. The gap (EHOMO-ELUMO) is applied to develop a theoretical model for explaining the structure and conformation barriers in many molecular systems and influences the biological activity of the molecule. A molecule with a small gap is more polarized and is known as soft molecule. Soft molecules are more reactive than hard ones because they easily offer electrons to an acceptor. The energy gap is small in L1 indicating that charge transfer easily occurs in it, which influences the biological activity of the molecule. Low value of energy gap is also attributed to the groups that enter into conjugation [57].
vi. The lower HOMO energy values show that molecules donating electron ability is the weaker. On contrary, the higher HOMO energy implies that the molecule is a good electron donor. LUMO energy presents the ability of a molecule receiving electron [58].
DFT method concepts can indicate the chemical reactivity and site selectivity of the molecular systems. The energies of frontier molecular orbitals (EHOMO+ ELUMO), energy band gap (EHOMO-ELUMO) which explains the eventual charge transfer interaction within the molecule, electronegativity (χ), chemical potential (μ), global hardness (η), global softness (S) and global electrophilicity index (ω) [58,59] are listed in Table 3.
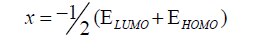 (1)
(1)
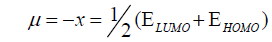 (2)
(2)
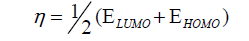 (3)
(3)
 (4)
(4)
 (5)
(5)
The inverse value of the global hardness is designed as the softness (?) as follow:
?=1/η (6)
Electrophilicity index is one of the most important quantum chemical descriptors in describing toxicity of various pollutants in terms of their reactivity and site selectivity [60]. In addition, the electrophilicity properly quantifies the biological activity of drug receptor interaction. This new reactivity index measures the stabilization in energy when the system acquires an additional electronic charge from the environment. The importance of η and ? is to measure the molecular stability and reactivity. In a complex formation system, the ligand acts as a Lewis base while the metal ion acts as a Lewis acid.
Molecular electrostatic potential (MEP)
The MEP is a plot of electrostatic potential mapped onto the constant electron density surface. It is also very useful in research of molecular structure with its physiochemical property relationship as well as hydrogen bonding interactions [63-61]. The electrostatic potential V(r) at a given point r (x, y, z) is defined in terms of the interaction energy between the electrical charge generated from the molecule electrons, nuclei and proton located at r [63,65]. In the present study, 3D plots of molecular electrostatic potential (MEP) of L1 (Figure 11) have been drew. The maximum negative, region which preferred site for electrophilic attack is indicated by a red color, the maximum positive region which preferred site for nucleophilic attack symptoms as blue color. Potential increases in the order red<green<blue, where blue shows the strongest attraction and red shows the strongest repulsion. Regions having the negative potential are over the electronegative atoms while the regions having the positive potential are over the hydrogen atoms.

Figure 11: Molecular electrostatic potential (map) for L1.
Dipole moment and other molecular properties
The calculations of the binding energy revealed that the increase of the value of the calculated binding energy of complexes compared to L1 indicates that the stability of the formed metal complexes is higher than that of L1. Also, energy components were calculated by DFT method shown in Table 4.
| Compound | HOMO (eV) |
LOMO (eV) |
Binding energy (Kcal/mol) |
Total energy (Kcal/mol) |
Dipole moment (D) |
|---|---|---|---|---|---|
| L1 | -4.836 | -1.828 | -4929.7 | -1.2 × 10⁶ | 6.1686 |
| [Cu2(L1)(H2O)4]2Cl.3H2O | -3.762 | -1.877 | -5872.1 | -1.6 × 10⁶ | 9.1791 |
| [Co2(L1)(H2O)2Cl2] | -4.042 | -2.447 | -6187.2 | -2.1 × 10⁶ | 7.4084 |
| [Pt2(L1)(H2O)2Cl6].EtOH | -4.180 | -2.816 | -6375.1 | -3.3 × 10⁶ | 5.3967 |
| [Pd2(L1)(H2O)2Cl2].(EtOH)1/2 | -4.807 | -3.534 | -5512.7 | -2.1 × 10⁶ | 7.3525 |
| [Nd2(L1)(H2O)8Cl6] | -5.568 | -3.085 | -8411.2 | -3.4 × 10⁶ | 5.8821 |
Table 4. Some of energetic properties of L1 and its complexes calculated by DMOL3 using DFT-method.
Thermogravimetric studies
The stages of decomposition, temperature range, decomposition product as well as the weight loss percentages of Cu2+, Pt4+ and Pd2+ complexes are given in Table 4. Figure 11 shows the TGA/DTG curves of three metal complexes. The experimental weight loss values are in good agreement with the calculated values. The final decomposition product was identified by the conventional chemical analysis method. In the TG thermogram of the [Cu2(L1)(H2O)4]2Cl.3H2O complex the first stage at 33°C-178°C with weight loss of 6.9 (Calcd. 7.5%) is corresponding to the loss of 3H2O lattice water molecules. The second step with weight loss of 10.7 (Calcd. 10%) at 178°C-257°C is attributed to the elimination of 4H2O coordination water molecules. The third step corresponds to the elimination of NH2+ 2HCl fragments with weight loss of 12.3 (Calcd. 12.3%) at 258°C-375°C. The fourth step at 375°C-628°C with weight loss of 19.3 (Calcd. 19.7%) is referring to the removal of C6H5S2 fragment. The fifth step is observed in the range 629°C-787°C with gradual mass loss corresponding to C6H6N2 fragment, 14.9 (Calcd. 14.6%). The residual part is [Cu6 (CN)4]+2C (Found 35.9, Calcd. 35.6%). In case of [Pt2(L1) (H2O)2Cl6].EtOH complex the TG/DTG curve shows a first step in range 38°C-144°C with gradual mass loss 4.7 (Calcd. 4.3%) corresponding to EtOH molecule out of side coordination sphere. The second step with weight loss of 10.7 (Calcd. 10.1%) at 145°C-291°C is attributed to the elimination of 2HCl and two coordinated water molecules. The third step is observed in the range 292°C-365°C with gradual mass loss corresponding to two chlorine ions 6.1 (Calcd. 6.6%). The fourth step at 365°C-560°C with weight loss of 38.9 (Calcd. 39.2%) is referring to the removal of [(C6H5SCN)2+NH2+CH+2Cl+ C2N2] fragments. The residual part is 2Pt+ 3C (Found 39.6, Calcd. 39.5%). Similar to the [Pd2(L1) (H2O)2Cl2].1/2EtOH complex the TG/DTG curve shows a first step in range 35°C-134°C with gradual mass loss 3.1 (Calcd. 3.1%) correspond ing to (EtOH)1/2molecule out of side coordination sphere. The second stage at 150°C-359°C with weight loss of 12.4 (Calcd. 12.2%) is corresponding to the loss of the two coordinated water, HCl molecules and NH3 fragment. This is followed by loss of [(C6H5SCN)2+HCl] fragments with weight loss of 42 (Calcd. 41.7%) in the range 359°C-794°C. The residual part is [Pd6 (CN)4] (Found 42.5, Calcd. 43%). An inspection of the data represented in Table 4 indicates that TG thermograms displayed a high residual part for the studied complexes reflecting a higher thermal stability.
Biological application
Antioxidant activity: Superoxide radical is formed in all aerobic cells by the reduction of O2 with the addition of a singlet electron. Normally the superoxide anion is short-lived and is converted to hydrogen peroxide and molecular oxygen by superoxide dismutase which maintains the steady-state levels of superoxide [66]. All cellular components can react with oxygen-derived free radicals at the level of unsaturated bonds and thiol groups. Proteins, some amino acids and nucleic acids are very sensitive to the attacks of superoxide radical, which could lead to induction of enzymatic activity alterations, changes in conformation: generating DNA strand breaks or base modifications, leading to point mutations in DNA [67]. Antioxidants are the compounds that prevent such oxidative damage due to their free radical scavenging ability. The superoxide dismutase is thought to be present in all oxygen-metabolizing cells, and has a protective mechanism against superoxide radical and its potential damaging reactivates generated by aerobic metabolic reactions. All the compounds were tested for antioxidant activity using superoxide dismutase like activity assay. An inspection of the data indicates that Cu2+, Co2+ and Nd3+ complexes exhibits the potent anti-oxidative activity (Figure 12). On the other hand, ligand itself and Pt4+ complex did not show any antioxidant activity. While the Pd2+ showed from low to mediate anti-oxidative activity. The complexes of Cu2+, Co2+ and Nd3+ had the highest activity of quenching phenazine methosulphate radicals at 100%, 99.3% and 95.6% inhibition respectively. This high antioxidant capacity may be due to their unique coordination. These compounds can be considered to be an important group of promising antioxidants. They might help attenuate oxidative stress and participate in protection against the harmful action of reactive oxygen species, mainly oxygen free radicals.

Figure 12: Superoxide dismutase scavenging radicals like activity of L1 and its complexes.
Cytotoxic and antitumor activity
L1 and its Cu2+, Co2+, Pt4+, Pd2+, and Nd3+ complexes were screened at different concentrations, ranging from 500 μM to 2.1 μM, for their antitumor activity against hepatocellular carcinoma cell line HepG2, as shown in Figure 13. After 48 h incubation period of the HPG2 liver cancer cells with different concentrations of ligand and its complexes, Nd3+ and Pd2+ complexes proved to have the highest cytotoxic activity with IC50 of 7.4, and 71.7 μM, respectively.

Figure 13: Cytotoxic activity of the L1 and its complexes.
Conclusion
The viability of HPG2 tumor cells, after incubation with the Nd3+ and Pd2+ complexes was significantly affected. The cell layer partially condensed forming cell-free areas, and finally detached from the culture plate. The ligand, Cu2+, Co2+ and Pt4+ complexes showed no cytotoxic activity.
References
- Stetsenko AI, Presnov M, Konovalova AL. The chemistry of antitumour platinum complexes. Russian Chemical Reviews. 1981;50:353.
- Presnov MA, Konovalova AL, Stetsenko AI, et al. Antineoplastic properties of complex compounds of platinum (II). Doklady Akademii Nauk SSSR. 1976;230:1357.
- Dyachenko SA, Konovalova AL, Bochkov DN, et al. An effective method of factorization. Akademii Nauk SSSR. 1982;34:15.
- Yakovlev KI, Stetsenko AI, Yu I. Mamel'kina, Palladium (II) and platinum (II), (IV) complexes of 2-amino pyrimdine and its derivatives. Koord Khim. 1986;12:1373.
- Kovala-Demertzi JM, Tsangaris HO, Desseyn BJ. Spectroscopic study of the Pd (II) complexes with 2-amino-4, 6-dimethylpyrimidin. Bull Soc Chim Belg.1987;96:7.
- Liav A, Angala SK, Brennan BJ et al. N-D-Aldopentofuranosyl-N′-[p-(isoamyloxy)phenyl]-thiourea derivatives: potential anti-TB therapeutic agents. Med Chem Lett. 2008;18:2649.
- Kucukguzel I, Tatar E, Kucukguzel SG, et al. Synthesis and antiviral activity of benzimidazolyland triazolyl-1, 3, 5-triazines. Eur J Med Chem. 2008;43:381.
- Li Z, Zhang Y, Wang Y. Synthesis and characterization of N-benzoyl-N'-carboxyalkyl substituted thiourea derivatives. Phosphorous Sulfur Silicon.2003;178:293.
- Kaya I, Ulhao glu SC, Gul M. Synthesis, characterization, conductivity and thermal degradation of oligo-2-[(4-morpholin-4-yl-phenyl) imino] methylphenol and its oligomer-metal complex compounds. Synth Met. 2006;156:1123.
- Cerrada P, Oriol L, Pinol MJ. Copper-containing semiflexible hydroxypolyazomethines: Metallomesogenic units inducing enhanced mechanical properties. Am Chem Soc.1997;119:7581.
- Venkatachalam TK, Sudbeck EA, Uckun FM. Regiospecific synthesis, X-ray crystal structure and biological activities of 5-bromothiophenethyl thioureas. Tetrahedron Lett. 2001;42:6629.
- Boas U, Karlsson AJ, de Waal BFM, et al. Synthesis and properties of new thiourea-functionalized poly (propylene imine) dendrimers and their role as hosts for urea functionalized guests. J Org Chem. 2001;66:2136.
- Ueda M, Sawai Y, Yamamura S. Syntheses of fluorescence-labeled artificial leaf-opening substances, fluorescent probe compounds useful for bioorganic studies of nyctinasty. Tetrahedron Lett. 2000;41:3433.
- Satchell DPN, Satchell RS. In the chemistry of sulfur-containing functional group. Patai S, Rappoport Z ,editors. Wiley: Chapter 12; New York. 1993:599-631.
- Vogel AI. A Text Book of Quantitative Inorganic Chemistry. Longmans, London;1961.
- Bain GA, John FB. Diamagnetic corrections and Pascal's constants. Chem Educ. 2008;85:532.
- Nishikimi M, Appaji N, Yagi K. The occurrence of superoxide anion in the reaction of reduced phenazine methosulfate and molecular oxygen. Biochem Biophys Res Commun.1972;46:849.
- Selvakumaran M. Enhanced cisplatin cytotoxicity by disturbing the nucleotide excision repair pathway in ovarian cancer cell lines. Cancer Res. 2003;63:1311.
- Delley B. An all?electron numerical method for solving the local density functional for polyatomic molecules. J Chem Phys. 1990;92:508.
- Delley B. A scattering theoretic approach to scalar relativistic corrections on bonding. Int J Quantum Chem. 1998;69:423-433.
- Delley B. Density-functional study of water and- sorption on the PuO2 (110) surface. From molecules to solids with the DMol3 approach. J Chem Phys. 2000;113:7756.
- Wu X, Ray AK. Density-functional study of water and sorption on the PuO2 (110) surface. Phys Rev B. 2002;65 85403.
- Kessi A, Delley B. Density functional crystal vs. cluster models as applied to zeolites. Int J Quantum Chem. 1998; 68:135.
- Materials studio v 5.0 copyright 2009. Accelrys Software Inc.
- Hehre WJ, Radom L, Schleyer PVR. Ab Initio molecular orbital theory. John Wiley, New York;1986.
- Hammer B, Hansen LB, Nørskov JK. Improved adsorption energetics within density-functional theory using revised Perdew-Burke-Ernzerhof functionals. Phys Rev B. 1999;59:7413.
- Matveev A, Staufer M, Mayer M, et al. Density functional study of small molecules and transition-metal carbonyls using revised PBE functionals. Int J Quantum Chem.1999;75:863.
- Geary WJ, Coord. The use of conductivity measurements in organic solvents for the characterization of coordination compounds. Chem Rev. 1971;7:81.
- Ketcham KA, Garcia I, Swearingen JK. Spectral studies and x-ray crystal structures of three nickel (II) complexes of 2-pyridineformamide 3-piperidylthiosemicarbazone. Polyhedron. 2002;21:859.
- Mostafa SI, Bekheit MM, El-Agez MM. Synthesis, spectral, magnetic and thermal studies of 1-phenylacetyl 4-phenyl-3-thiosemicarbazide complexes. Synth React Inorg Met-Org Chem. 2000;30:2029.
- Alpert NL, Keiser WE, Szmanski HA. IR Theory and practice of infrared spectroscopy. Plenum Press, New York;1970.
- Rapheal PF, Manoj E and Kurup MRP. Copper (II) complexes of N (4)-substituted thiosemicarbazones derived from pyridine-2-carbaldehyde: Crystal structure of a binuclear complex. Polyhedron. 2007:26;818.
- Salam SA, Bahgat KM, El-Tanany AZ, et al. Lanthanide complexes with D-penicillamine methyl ester: Formation constants, spectral and thermal properties. J Coord Chem. 2006;59:2055.
- Nakamoto K. Infrared and Raman spectra of inorganic and coordination compounds. 6th ed. John Wiley and Sons, Inc. New Jersey; 2009.
- Ferraro JR, Walker WR. Infrared spectra of hydroxy-bridged copper (II) compounds. Inorg Chem.1965:4:1382.
- Rastoh DK, Sharma KC. Spectroscopic characterization, pH-metric and thermal behavior on Co (II) complexes formed with 4-(2-pyridyl)-3-thiosemicarbazide derivatives. J Inorg Nucl Chem. 1974;36:2219.
- Mayer R, Janssen MJ, editors. Organosulfur Chemistry. Wiley Interscience, New York, 1967;219-240.
- Philip V, Suni V, Prathapachandra Kurup MR, et al. Novel binuclear copper(II) complexes of di-2-pyridyl ketone N(4)-methyl, N(4)-phenylthiosemicarbazone: Structural and spectral investigations. Polyhedron. 2005;24;1133.
- Silverstein, Bassler GC. Spectroscopic Identification of Organic Compounds. Wiley, New York;1967.
- Nomiya K, Sekino K, Ishikawa M, et al. Syntheses, crystal structures and antimicrobial activities of monomeric 8-coordinate, and dimeric and monomeric 7-coordinate bismuth(III) complexes with tridentate and pentadentate thiosemicarbazones and pentadentate semicarbazone ligands. J Inorg Biochem. 2004;98:601.
- Mostafa MM. Spectroscopic studies of some thiosemicarbazide compounds derived from Girard’s T and P. Acta Spectrochim Acta A Mol Biomol Spectrosc. 2006;66:480.
- Angelusiu MV, Barbuceanu SF, Draghici C, et al. New Cu (II), Co (II), Ni(II) complexes with aroylhydrazone based ligand. Synthesis, spectroscopic characterization and in vitro antibacterial evaluation. Eur J Med Chem. 2010;45:2055-2062.
- Holzer W, Vilkauskait? G, Arbaciauskiene E, et al. Dipyrazolo [1, 5-a:4', 3'-c] pyridines - A new heterocyclic system accessed via multicomponent reaction. J Org Chem. 2012;8:2223.
- Tossidis IA, Bolos CA, Aslinidis PN, et al. Monohalogenobenzoylhydrazones III. Synthesis and structural studies of Pt (II), Pd (I1) and Rh (II1) complexes of di-(2-pyridyl) ketonechlorobenzoyl hydrazones Inorg Chim Acta, 1987;133:275-280.
- Lever ABP. Inorganic Electronic Spectroscopy, Elsevier, Amsterdam;1968.
- Kato M, Jonassen KB, Fanning GC. Copper (II) complexes with subnormal magnetic moments. Chem Revs. 1964;64: 99.
- Kettle SFA. Coordination Compounds. Thomas Nelson and Sons Let. London;1969.
- Lewis J, Wilkins RG. Modern Coordination Chemistry, Interscince, New York;1960.
- Al-Assy WH, El-Askalany AH, Mostafa MM. Structural comparative studies on new Mn II, Cr III and Ru III complexes derived from 2, 4, 6-tri-(2-pyridyl)-1, 3, 5-triazine (TPTZ). Spectrochim Acta. 2013;116:401.
- CM Harris, Livingstone SE. Spectrophotometric evidence for the solvation of halogenopalladate (II) ions by various polar solvents. J Chem Soc. 1959;1505.
- Shavaleev NM, Accorsi G, Virgili D. Syntheses and crystal structures of dinuclear complexes containing d-block and f-block luminophores. Sensitization of NIR luminescence from Yb (III), Nd (III), and Er (III) centers by energy transfer from Re (I)-and Pt (II)-bipyrimidine metal centers. Inorg Chem. 2005;44:61.
- West DK, Swearingen JK, Valdés-Martinez J, et al. Spectral and structural studies of iron (III), cobalt (II, III) and nickel(II) complexes of 2-pyridineformamide N(4)-methylthiosemicarbazone. Polyhedron. 1999;18:2919.
- Yousef TA, Abu El-Reash GM, El Morshedy RM. Quantum chemical calculations, experimental investigations and DNA studies on (E)-2-((3-hydroxynaphthalen-2-yl) methylene)-N-(pyridin-2-yl) hydrazinecarbothioamide and its Mn(II), Ni(II), Cu(II), Zn(II) and Cd(II) complexes. Polyhedron. 2012;45:71.
- Linert W, Taha A. Coordination of solvent molecules to square-planar mixed-ligand nickel (l1) complexes: A thermodynamic and quantum-mechanical study. J Chem Soc Dalton Trans. 1994:1091.
- Govindarajan M, Periandy S, Carthigayen K. FT-IR and FT-Raman spectra, Thermo dynamical behavior, HOMO and LUMO, UV, NLO properties, computed frequency estimation analysis and electronic structure calculations on a-bromotoluene. Spectrochim. 2012;97:411.
- Abu El-Reash GM, El-Gammal OA, Ghazy SE. Characterization and biological studies on Co (II), Ni (II) and Cu (II) complexes of carbohydrazones ending by pyridyl ring. Spectrochim Acta. 2013;104:26.
- RG Pearson. Absolute electronegativity and hardness: applications to organic chemistry. J Org Chem. 1989;54:1423.
- Padmanabhan J, Parthasarathi R, Subramanian V, et al. Frequency and time-resolved coherence transfer spectroscopy. J Phys Chem. 2007;111:1358.
- Parthasarathi R, Padmanabhan J, Sarkar U. Toxicity analysis of benzidine through chemical reactivity and selectivity profiles: A DFT approach. Internet Electronic. J Mol Des. 2003;2:798.
- Scrocco E, Tomasi J. Electronic Molecular Structure, Advances in Quantum Chemistry. Academic Press, 115;1978.
- Luque FJ, López JM, Orozco M. Perspective on electrostatic interactions of a solute with a continuum. A direct utilization of ab initio molecular potentials for the prevision of solvent effects. Theor Chem Acc. 2000;103:343.
- Okulik N, Ubert AHJ. Internet Electron. Theoretical analysis of the reactive sites of non-steroidal anti-inflammatory Drugs. Internet electron. J Mol Des. 2005;4:17.
- Politzer P, Laurence PR, Jayasuriya K. Molecular electrostatic potentials: An effective tool for the elucidation of biochemical phenomena. Environ Health Perspect. 1985;61:191.
- Scrocco E, Tomasi J. The electrostatic molecular potential as a tool for the interpretation of molecular properties, in new concepts II, Springer. 1973;95.
- Fridovich I, J Biol Chem. Superoxide anion radical (O2-), superoxide dismutases and related matters. 2721997;272:18515.
- Fridovich I. The biology of oxygen radicals. Science.1978;4359:875.
- Velavan S, Nagulendran K, Mahesh R, et al. In vitro antioxidant activity of Asparagus racemosus root. Pharmacognosy Magazine. 2007;3:26.