Original Article
, Volume: 13( 4)Optimization of Alkaline Protease Production Medium Components and Physical Parameters by Bacillus Cereus Strain P5 Through Central Composite Design
- *Correspondence:
- Pramoda Kumari J
Department of Microbiology
S.V. University, Tirupati, A.P, India
Tel: 0877-2289547
E-mail: pramodakumarij@gmail.com
Received: July 28, 2017; Accepted: August 16, 2017; Published: August 21, 2017
Citation: Sreedevi B, Chandrasekhar K, Pramoda Kumari J. Optimization of Alkaline Protease Production Medium Components and Physical Parameters by Bacillus Cereus Strain P5 Through Central Composite Design. Biotechnol Ind J. 2017;13(4):146
Abstract
Optimization of the medium for enhanced alkaline protease production was studied using Bacillus cereus P5. Central composite design was applied to optimize the medium components and study the effects of four medium constituents, such as fructose, beef extract, incubation time and pH. The optimum values for the tested variables were fructose 2.8%, beef extract 1.5%, incubation time 72 h and pH 9.0. The model was very sensitive as the coefficient of determination was 0.94. Experiments were validated to verify the sensitivity of the model and the observed values follow the predicted values obtained by CCD. The enzyme production was enhanced up to 1538 U mL−1 at 72 h of incubation and 1.64-fold increase in enzyme production was observed.
Keywords
Alkaline protease; Bacillus Cereus; CCD; Optimization; Response surface methodology
Introduction
Alkaline proteases are a commercially important group of enzymes, which play a specific catalytic role in the hydrolysis of proteins. The genus Bacillus contains a number of industrially important species and applied in commercial production of alkaline protease under extreme pH and temperatures [1]. Deepti Jain, extrapolate the potential of Bacillus strain which have functional activity at broad pH ranges, temperatures (20°C to 80°C) and salinity up to 20%. Extracellular protease production in microorganisms is greatly influenced by media compositions, variation in carbon and nitrogen sources [2,3]. Physical factors such as dissolved oxygen, temperature, pH and incubation time also affect the yield of protease production [4]. Media compositions have great influence on the extracellular protease production and are differ for each microorganism; about 30% to 40% of the production costs is estimated to account for the cost of the growth medium [5]. The medium components and their composition have to be optimized. Statistical methods are used due to the number of advantages by using the method [6,7]. There is a growing tendency for using statistical experimental designs in biotechnology processes. Several studies have been carried out using statistical approaches for the optimization of microbial protease production. Obviously, these approaches resulted in the quick, cheap, and exact determination of optimized conditions. Response surface methodology (RSM) is used for selection of medium components and their composition and to study physical parameters such as pH, temperature, incubation period, inoculums volume and incubation RPM at which level they enhance enzyme production. Response surface methodology is a collection of mathematical and statistical techniques for building empirical models, and is gaining a powerful approach for optimizing conditions for the production of products such as chemicals and enzymes [8]. The principal objective of this study was to optimize the levels of the variables, for alkaline protease production by employing Bacillus Cereus P5. In this study, response surface methodology was applied for the study of components (variables) that enhance enzyme production in order to investigate the interaction effects of independent variables including, fructose, beef extract, pH and incubation period.
Materials and Methods
Microorganism
Bacillus Cereus P5 producing alkaline protease was isolated from leather industry effluents. The bacterium was identified on the basis of biochemical properties and 16S rRNA analysis. The 16S rRNA sequence of the strain was compared with the sequences in GenBank using BLAST and aligned with the sequences retrieved from NCBI GenBank database using the ClustalW method. The sequence has been submitted to the Genbank with accession number KF758385 (Bacillus Cereus strain P5).
Inoculum preparation
Bacillus Cereus P5 was grown in nutrient agar medium for 24 h and this overnight culture was used as inoculum for enzyme production.
Alkaline protease production medium
Inoculum was transferred into an Erlenmeyer flask (250 mL) containing 50 mL of fermentation medium in which the composition was varied based on the experimental designs. Enzyme protease production was carried out in medium containing (g/L) fructose-5 g, beef extract-7.5 g, NaCl-5 g, MgSO4.7H2O-5 g, FeSO4.7H2O-0.1 g. The pH of the medium was adjusted to 10.0. The production medium was inoculated with 10% of inoculum and incubated at 37°C for 72h at 150 rpm in shaking incubator. After the completion of fermentation, the whole fermented broth was centrifuged at 10000 rpm for 15 min at 4°C and the clear supernatant was recovered and used as an enzyme source.
Alkaline protease assay
Protease activity was determined by Anson method [9,10] using 1% casein as substrate. 0.2 mL of enzyme solution was added to 0.8 mL of substrate solution (1% V/V, casein with 50 mM Glycine-NaOH buffer, pH 10.0) and incubated at 60°C for 15 min. The reaction was stopped by adding 1 mL of 10% TCA and centrifugation was done at 10000 rpm for 15 min at 4°C. 1 mL of supernatant was added to 3 mL of 0.4 M Na2CO3 solution. 0.5 mL of Folin reagent was added to each tube, vortexed and kept for 30 min at room temperature. This provides coloration (measured at OD 660 nm) equivalent to 1 μmol of tyrosine, in the presence of the Folin-Ciocalteau reagent by using a tyrosine standard curve [11].
Design of experiments
Protease production was enhanced by various levels of different factors and was selected during primary optimization experiments. In the preliminary study, it was identified that fructose (%)-X1, beef extract (%)-X2, incubation time (h)-X3 and pH-X4 were the major four variables which enhance the protease production (Y).
Optimization of enzyme production by response surface methodology
Response surface method (RSM) is used to optimize medium and physical parameters by using full factorial central composite design (CCD) [12]. Response surface methodology (RSM) Box-Behnken consists of a group of empirical techniques devoted to the evaluation of relations existing between a cluster of controlled experimental factors and measured responses, according to one or more selected criteria. Four independent medium compositions were evaluated at two levels (high and low) and designated as level+1 and level-1 respectively. The significant variables were screened in 28 combinations in accordance with the design matrix and the responses were measured according to the protease activity. For the selection of variables, Design Expert (Stat-Ease, Inc.,) was used to calculate the design. 23-1 fractional factorial designs were employed to fit the second order polynomial model which indicated that 28 experiments were required to analyze.
The coded values of the variables were studied by the following equation:
Where xi-coded valve of the ith variable, Xi-uncoded valve of the ith test variable and Xo-uncoded valve of the ith test variable. The range and levels of individual variables are given in the Table 1 and Table 2. The regression analysis was performed to estimate the response function as a second order polynomial.
| Variables | Levels | ||
|---|---|---|---|
| -1 | 0 | 1 | |
| Fructose (%) [X1] | 2.0 | 2.5 | 3.0 |
| Beef extract (%) [X2] | 0.75 | 1.0 | 1.25 |
| Incubation time (h) [X3] | 48 | 72 | 96 |
| pH[X4] | 8.5 | 9.0 | 9.5 |
Table 1: Range and levels of the independent variables.
| Run no. | X1 | X2 | X3 | X4 | Enzyme activity (U/mL) |
|---|---|---|---|---|---|
| 1 | -1 | -1 | -1 | -1 | 468.240 |
| 2 | 1 | -1 | -1 | -1 | 497.210 |
| 3 | -1 | 1 | -1 | -1 | 506.020 |
| 4 | 1 | 1 | -1 | -1 | 586.120 |
| 5 | -1 | -1 | 1 | -1 | 736.780 |
| 6 | 1 | -1 | 1 | -1 | 696.130 |
| 7 | -1 | 1 | 1 | -1 | 672.710 |
| 88 | 1 | 1 | 1 | -1 | 637.430 |
| 9 | -1 | -1 | -1 | 1 | 705.540 |
| 10 | 1 | -1 | -1 | 1 | 696.420 |
| 11 | -1 | 1 | -1 | 1 | 698.190 |
| 12 | 1 | 1 | -1 | 1 | 724.640 |
| 13 | -1 | -1 | 1 | 1 | 798.750 |
| 14 | 1 | -1 | 1 | 1 | 862.370 |
| 15 | -1 | 1 | 1 | 1 | 824.720 |
| 16 | 1 | 1 | 1 | 1 | 830.910 |
| 17 | -1 | 0 | 0 | 0 | 876.430 |
| 18 | 1 | 0 | 0 | 0 | 917.290 |
| 19 | 0 | -1 | 0 | 0 | 927.760 |
| 20 | 0 | 1 | 0 | 0 | 884.490 |
| 21 | 0 | 0 | -1 | 0 | 929.470 |
| 22 | 0 | 0 | 1 | 0 | 979.190 |
| 23 | 0 | 0 | 0 | -1 | 946.660 |
| 24 | 0 | 0 | 0 | 1 | 1017.160 |
| 25 | 0 | 0 | 0 | 0 | 1073.810 |
| 26 | 0 | 0 | 0 | 0 | 1052.480 |
| 27 | 0 | 0 | 0 | 0 | 1062.670 |
| 28 | 0 | 0 | 0 | 0 | 1064.890 |
Table 2: Central composite design consisting of 28 experiments for the study of three experimental factors in coded units along with observed values.
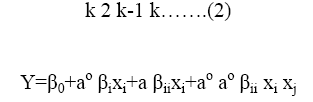
Where Y is the predicted response, βi, βj and βij are coefficients estimated from regression. They represent the linear, quadratic and cross products of X1, X2, X3 and X4 on response.
Experimental model validation
The statistical model was validated according to all the four variables in the given design space. 15 experimental combinations were used randomly to study enzyme production in 250 mL shake flasks.
Results and Discussion
The experiments were done as per the design (Table 2) with 28 experiments in triplicate, for 96 h incubation time. CCD experiments consisted of predicted and observed response values for studying the effects of four independent variables; fructose, beef extract, incubation and pH on enzyme production (Table 3). The second order response surface model results are in the form of analysis of variance (ANOVA) (Table 4). The Fisher F-test [F (13, 15)=321.6823] with a low probability value (pmodel>F=0.000000) demonstrate accuracy of the regression model. The efficiency of the model was calculated by the determination coefficient (R2). In this study, the value of the determination coefficient (R2=0.94) indicates that only 5.9% of the total variations are not explained by the model. The regression equation calculated from analysis of variance indicated that the R2 value is 0.94 (a value>0.75 indicates accuracy of the model) [13]. The method explains 94% variation in the observed response. The adjusted determination coefficient value (Adj. R2=0.88) is also high to judge the goodness of the model. A higher value of the correlation coefficient, R (=0.97), justifies an excellent correlation between the independent variables. R2 value should be close to 1.0 for best statistical model and all the four factors should be positive and close to each other.
| Run no. | Alkaline protease activity (U/mL) | Residual value | |
|---|---|---|---|
| Observed response | Predicted value | ||
| 1 | 468.240 | 480.869 | -12.6290 |
| 2 | 497.210 | 514.120 | -16.9096 |
| 3 | 506.020 | 519.560 | -13.5396 |
| 4 | 586.120 | 558.970 | 37.1499 |
| 5 | 736.780 | 708.420 | 28.3599 |
| 6 | 696.130 | 701.041 | -4.9107 |
| 7 | 672.710 | 665.656 | 7.0543 |
| 8 | 637.430 | 664.436 | -27.0062 |
| 9 | 705.540 | 670.780 | 35.7605 |
| 10 | 696.420 | 710.030 | -13.6101 |
| 11 | 698.190 | 699.835 | -1.6451 |
| 12 | 724.640 | 745.246 | -21.6056 |
| 13 | 798.750 | 842.456 | -43.7056 |
| 14 | 862.370 | 841.076 | 21.2938 |
| 15 | 824.720 | 790.056 | 34.6637 |
| 16 | 830.910 | 794.837 | 36.0733 |
| 17 | 876.430 | 909.749 | -33.3192 |
| 18 | 917.290 | 928.765 | -11.4747 |
| 19 | 927.760 | 930.409 | -2.6492 |
| 20 | 884.490 | 926.635 | -42.1447 |
| 21 | 929.470 | 892.441 | 37.0286 |
| 22 | 979.190 | 1031.013 | -52.8225 |
| 23 | 946.660 | 904.229 | 42.4308 |
| 24 | 1017.160 | 1064.385 | -47.2247 |
| 25 | 1073.810 | 1037.367 | 36.4429 |
| 26 | 1052.480 | 1037.367 | 15.1129 |
| 27 | 1062.670 | 1037.367 | 45.3029 |
| 28 | 1064.890 | 1037.367 | 27.5229 |
Table 3: Experimental and predicted values.
| Sources of variation | Sum of squares | Degrees of freedom | Mean square | F value | Prob (P)>F |
|---|---|---|---|---|---|
| Regress. | 19157243 | 15 | 1277150 | 321.6823 | 0.000000 |
| Residual | 51613 | 13 | 3970 | ||
| Total | 19208856 | 28 | |||
| Corrected total | 895553 | 27 | |||
| Regression vs. corrected total | 19157243 | 15 | 1277150 | 38.5047 | 0.000000 |
| R2=0.94, R=0.97, Adjusted R2=0.88 | |||||
Table 4: Analysis of variance for the four-factorial design.
The response surface methodology yielded the regression Eq. (3), the values of protease production and variables in coded unit

where, Y=predicted response, X1, X2, X3 and X4 are the coded values of fructose, beef extract, incubation time and pH, respectively. X11, X22, X33 and X44 are the measures of the main effects of variables fructose, beef extract, incubation time and pH, respectively.
The significance of each coefficient was determined by t-test and p-values (Table 5). The magnitude of the t-value is larger and the p-value is smaller, the corresponding coefficient is more significant. The first order main effects of fructose, beef extract, incubation time and pH are significant due to evident from their respective p-values (px3<0.0004, px4<0.0001) and with their second order main effects (px11<0.01 and px22=0.015). The values indicate that the concentration of fructose and beef extract have a positive effect on the production of the enzyme. Response surface contour plots are as a function of two factors at a time, holding all other factors at fixed levels (zero) and are useful in understanding the main and the combination effects of two factors. These plots can be easily obtained by calculating from the model, the values taken by one factor while the second varies (from −1 to +1, step 1 for instance) with constraint of a given Y value. Figure 1-6 show that each contour curve slope of one variable is dependent on the level of the other and each contour curve slopes of one variable is independent of the level of the other. Fructose and beef extract are main factors which control the synthesis of the enzyme and at low concentration enzyme production was maximum. The experimental data were fitted into the equation 3, and the optimum levels of each variable were determined to be as follows: fructose 2.8%, beef extract 1.5%, incubation time 72 and pH 9.0 [14]. Cheng et al. used fructose and yeast extract for optimized alkaline protease production (946.36 U mL-1). Lakshmi, 2016 [11] reported optimized alkaline protease production from Bacillus licheniformis by using rice husk and KNO3 (185.4 U/mL) [15,16]. Bhunia [2] investigated optimized conditions for protease production in the shake flask (315.28 U) through RSM.
| Factor | Coefficient | Computed t-value | p-value |
|---|---|---|---|
| Intercept | 1037.367 | 47.61269 | 0.000000* |
| X1 | 9.508 | 0.64019 | 0.533172 |
| X2 | -1.887 | -0.12707 | 0.900828 |
| X3 | 69.286 | 4.66521 | 0.000442* |
| X4 | 80.078 | 5.39189 | 0.000123* |
| X1X2 | 1.540 | 0.09776 | 0.923613 |
| X1X3 | -10.158 | -0.64482 | 0.530258 |
| X1X4 | 1.500 | 0.09522 | 0.925589 |
| X2X3 | -20.364 | -1.29274 | 0.218606 |
| X2X4 | -2.409 | -0.15291 | 0.880815 |
| X3X4 | -13.969 | -0.88677 | 0.391314 |
| X11 | -118.110 | -3.01053 | 0.010034* |
| X22 | -108.845 | -2.77437 | 0.015785* |
| X33 | -75.640 | -1.92800 | 0.075986 |
| X44 | -53.060 | -1.35246 | 0.199287 |
| *Significant at p<0.01 | |||
Table 5: Multiples linear regression analysis.

Figure 1: Response surface plot showing the effect of varying fructose and beef extract concentration and their interaction effect on the production or yield of alkaline proteases keeping other variables constant (incubation time-72 h, pH-9.0).

Figure 2: Response surface plot showing the effect of varying incubation time and fructose concentration and their interaction effect on the production or yield of alkaline proteases keeping other variables constant (beef extract-1.0%, pH-9.0).

Figure 3: Response surface plot showing the effect of varying fructose concentration and pH value and their interaction effect on the production or yield of alkaline proteases keeping other variables constant (incubation time-72 h, beef extract-1.0%).

Figure 4: Response surface plot showing the effect of varying beef extract concentration and incubation time and their interaction effect on the production or yield of alkaline proteases keeping another variables constant (fructose-2.5%, pH-9.0).

Figure 5: Response surface plot showing the effect of varying beef extract concentration and pH value and their interaction effect on the production or yield of alkaline proteases keeping other variables constant (fructose-2.5%, incubation time-72 h).

Figure 6: Response surface plot showing the effect of varying incubation time and pH value and their interaction effect on the production or yield of alkaline proteases keeping other variables constant (fructose-2.5%, beef extract-1.0%).
Validation of the model predicted in shakes flask culture
The validation of the statistically optimized condition for the production of protease by Bacillus Cereus P5 strain was verified by conducting shake flask fermentation with in the design space [17]. The model indicated that the selected concentrations of fructose and beef extract were limiting, therefore, further increase in their concentrations and should be used for validation. Under the final optimized conditions, the predicted response for protease production was 1025 U/mL, and the observed result was 1538 U/mL in statistically optimized medium (Figure 7) after 70 h. However, the major decline in enzyme production was obtained after 76 h. The results evaluate the validity of the model and the optimization of the media led to 1.64-fold increase in the enzyme activity than the initial activity (937.48 U/mL) in unoptimized medium. Some researchers previously reported about the protease production, 939 U/mL by Bacillus sp. RKY3 [18], 770.66 U/mL by Aspergillus clavatus ES1 (Hajji, 2008), 796 U mL–1 by Bacillus aquimaris [19], 202.7 U mL–1 by Microbacterium sp. [20]. The main use of statistical experimental design methods is to determine the suitable ranges of the control factors in obtaining the optimum response. The use of statistical design is to determine the concentration of medium composition and determination of the factors and interactions between them. Enzyme production was influenced by medium components including carbon source, nitrogen source, but also by culture conditions including pH, temperature, dissolved oxygen, and inoculum density.

Figure 7: Time intervals of alkaline protease production by B.cereus P5 under optimized and unoptimized conditions.
Conclusion
Statistical experimental approaches proved useful for the maximum alkaline protease production by Bacillus Cereus P5, about 1.64 time’s higher enzyme activity than that using the unoptimized medium in a shake flask culture. Under the optimized conditions, the predicted response for protease production was 1025 U/mL, and the observed result was 1538 U/mL in statistically optimized medium. The central composite design method allowed to study and explores culture conditions supporting changes in concentrations of medium components. The results indicated that Bacillus Cereus P5 strain can be used in industries such as detergents industry and leather industry because of bulk production of alkaline protease in a defined medium. A high degree of similarity was observed between the predicted and observed values that demonstrate the accuracy of response surface methodology to optimize the process for alkaline protease enzyme production.
References
- Anson ML. The estimation of pepsin, trypsin, papain and cathepsin with haemoglobin. J Gen Physiol. 1938;22:79-89.
- Bhunia B, Dutta D, Chaudhuri S. Selection of suitable carbon, nitrogen and sulphate source for the production of alkaline protease by Bacillus licheniformis NCIM-2042. Sci Biol. 2010;2(2):56-9.
- Biswanath B, Dey A. Statistical approach for optimization ofphysiochemical requirements on alkaline protease production from Bacillus licheniformis NCIM 2042. Enzyme Research. 2012;1-13.
- Box GEP, Hunter WG, Hunter JS. Statistics for Experiments: An Introduction to Design Data Analysis and Model Building. John Wiley, New York, 1978.
- Chen SW, Wang YF, Wang ML. Statistical optimization of medium compositions for alkaline protease production by newly isolated Bacillus amyloliquefaciens.ChemBiochem Eng. 2012;26(3):225-31.
- Jain D, Pancha I, Mishra SK, et al. Purification and characterization of haloalkalinethermoactive, solvent stable and SDS induced protease from Bacillussp; A potential additive for laundry detergents. Bioresource Technology. 2012;115:228-36.
- Folin O, Ciocalteu V. On tyrosine and tryptophan determination in proteins. J Biol Chem. 1927;73:627-650.
- Geisseler D, Horwath WR. Regulation of extracellular protease activity in in soil in reponse to different sources and concentrations of nitrogen and carbon. Soil BiolBiochem.2008;40:3040.
- Hajji M, Rebai A, Gharsallah N, et al. Optimization of alkaline protease production by Aspergillusclavatus ES1 in Mirabilis jalapatuber powder using statistical experimental design. Appl Microbial Biotechnol. 2008;79:915.
- Khurana S, Kapoor M, Gupta, et al. Statistical optimization of alkaline xylanase production from streptomycesviolaceoruber under submerged fermentation using response surface methodology. Indian Journal of Microbiology. 2007;47:144-52.
- Lakshmi BKM, Hemalatha KPJ. Production of alkaline protease from Bacillus licheniformis through statistical optimization ofgrowth media by response surface methodology. Ferment Technol. 2016;5:2-7.
- Li J, Ma C, Ma Y, et al. Medium optimization by combination of response surface methodology and desirability function: An application in glutamine production. ApplMicrobiolBiotechnol. 2007;74:563-71.
- Mahmoodi NM, Arami M, Mazahari F, et al. Degradation of sericin (degumming) of Persian silk by ultrasound and enzymes as a cleaner and environmentally friendly process. Journal of Cleaner Production. 2010;18:146-51.
- Oskouje SFG, Tabandeh F, Yakhchali B, et al. Response surface optimization of medium composition for alkaline protease production by Bacillus clausii. Biochemical Engineering Journal. 2008;39:37-42.
- Rahman RNZA, Geok LP, Basri M, et al. Physical factors affecting the production of organic solvent tolerant protease by Pseudomonas aeruginosa strain K. Bioresource Technol. 2005;96:429.
- Reddy LVA, Young-jung Wee, Jong-sun Y, et al. Optimization of alkaline protease production by batch culture of Bacillus sp. RKY3 through PlackettBurman and response surface methodological approaches. Bioresource Technology. 2008;99:2242-9.
- Shivanand P, Jayaraman G. Production of extracellular protease from halotolerant bacterium, Bacillus aquimaris strain VITP4 isolated from kumta coast. Process Biochemistry. 2009;44:1088-94.
- Tari C, Genckal H, Tokatli F. Optimization of a growth medium using a statistical approach for the production of an alkaline protease from a newly isolated Bacillussp. L21. Process Biochem. 2006;41:659.
- Thys RCS, Guzzon SO, Olivera C, et al. Optimization of protease production by Microbacteriumsp. in feather meal using response surface methodology. Process Biochem. 2006;41:67.
- Xiao ZJ, Liu PH, Qin JY, et al. Statistical optimization of medium components for enhanced acetoin production from molasses and soybean meal hydrolyzate. ApplMicrobiolBiotechnol. 2007;74:61-8.