Original Article
, Volume: 13( 1)Household Financial Assets Allocation and Behaviour of Art Collection Holding
- *Correspondence:
- Zhang Yu-Xia , School of Finance, Anhui University of Finance and Economics, No. 962, Caoshan Road, Bengbu city, Anhui Province, PR China
Tel: +865523171001; E-mail: mozhu_zyx@126.com
Received: September 29, 2016; Accepted: February 03, 2016; Published: February 11, 2017
Citation: Xia ZY, Hong Z. Household Financial Assets Allocation and Behaviour of Art Collection Holding. Biotechnol Ind J. 2017;13(1):124.
Abstract
Financial demands of household show a typical characteristic of hierarchy, which is reflected by financial assets allocation of household. The collection itself has dual-attributes of consumption and investment goods, which is becoming an important choice of household financial assets allocation. Using micro-survey data of China households and analyzing empirically, it is found that the higher the hierarchy of financial assets allocation, the stronger the tendency to hold the art collection for household. It is believed that financial assets allocation should be optimized further and the hierarchy of household financial demands should be enhanced based on the satisfaction of household transaction requirements in order to develop the art collection markets of China and absorb more households to participate in.
Keywords
Household; Financial assets allocation; Art collection holding; Hierarchy of demand
Introduction
Why are households willing to hold art collection? Generally speaking, dual attributes are reflected in art collection itself. For attribute of consumption, household obtains art collection to satisfy the real demand and aesthetic need in spirits for family members by money transference; for attribute of investment, household wishes to capture wealth effect by future strengthening of art collection, even get money profit directly by selling. But it is very difficult to distinguish them strictly in practice, which is not our purpose. In this paper, we try to solve two problems: 1). in real life, what kind of households prefer to hold art collection more? 2). Household could achieve return from art collection in future, so it has the characteristic of financial asset. For household, several kinds of financial assets allocation is essentially arranged in sequence that financial assets satisfy the financial demand with the consideration on condition of return and risk. With the art collection involved in the process of household asset allocation, considering the status of financial asset allocation, how will household choose to hold art collection? And how will the logical relationship between art collection and financial asset be reflected?
Analysis of Relationship between Household Financial Assets
Allocation and art collection holding
By financial market participation, household searches for appropriate financial instruments to satisfy two kinds of financial demands: transaction demand in daily life and assets value preservation-addition demand. As far as the achievement sequence of the two kinds of financial demands is concerned, transaction demand is prior to the value preservation-addition one. In existence of heterogeneity among households, the process of searching needs to carry on according to individual demand and supply condition of financial market. In summary, several factors is shown below:
Income: Household income could affect financial asset allocation by relieving liquidity constraints effectively. Taking the transaction demand as an example, when borrowing from commercial bank, households with high level income are often regarded as a higher credit grade, which is helpful to acquire bank loan for large expenditure easily (such as housing loans), while households with low level income may be discriminated by formal finance and then fails to acquire necessary liquidity for transaction, instead, turns to other informal channels [1]. Meanwhile, limited participation in risky assets also exists in these households because of their lower ability to afford investment cost of risky assets such as stock [2]. When household income level improves, transaction demand in household finance will be satisfied gradually with liquidity constraints eliminating, and value preservation-addition demand is becoming the dominant motive in household financial assets allocation. At this point, household converts extra money into other kinds of assets with higher return in order to compensate for opportunity cost of holding money and value preservation-addition demand will be satisfied finally.
Available types of financial assets for household: Household financial assets allocation also depends on abundance of products supply in financial markets. Caballero stated that compared to developed countries, creativity of financial asset in emerging market economy is obviously insufficient. Wealth from income improving can’t be con verted into domestic investment and consumption demand effectively. That’s why bubbles are created during the process of searching for speculation profit [3]. As for China, it results the phenomenon “Financial Assets Shortage”, which restricts supply of financial products, restraints the probability of achieving high-quality financial assets for households and hampers households’ participation in financial markets. In fact, only part of financial products in current financial market can satisfy household financial demand under the restraints. In face of different kinds of financial assets, households also have different sorting in them. Therefore, the satisfaction of household financial demand is significantly affected by abundance of financial products available for households.
In a word, household financial assets allocation presented such a pyramid in Figure 1. In the Pyramid, different financial products have an order: cash and deposits, stock, fund, art collection. With the improvement of income and increasing of financial asset types, this order is evident in a feature of solidification [4]. In this paper, art collection is involved in financial assets allocation on its value preservation-addition ability from scarcity and elegance. Comparing with security and real estate investment, art collection has strong function of value preservation and high safety with higher rate of return and moderate risk. Investor needn’t worry about risk of depreciation from market fluctuation once acquiring. After financial crises in 2008, 78% of individuals with high net worth in China are more inclined to choose investment types with value preservation-addition function. Persisted booming of art investment demand comes from its comparatively steady investment rate of return [5]. Specifically, only eliminating liquidity constraints can household demand of holding art collection arise; only diversification of household financial asset allocation can household increase the tendency to hold art collection.

Figure 1: Household hierarchy of financial demand.
There are two reasons that art collection could diversify risk: the first is scarcity. For example, it is well-known that every art work is unique in some stage of the artist’s career. Any art work can’t be repeated completely, so the art collection supply is scarce, sometimes even exclusive, which attracts more and more investors. So are the furniture made of scarce wood and high-grade musical instrument made by famous workers manually. The second reason is that the variety of art collection type is helpful to diversify risk by combining different art work. Although art collection has a higher average rate of return, difference between art works is affected by characteristics of times, style and regional feature.
In a word, household could diversify risk by holding different types of art collection, which will form attractive portfolio. Of course, risk of holding art collection, which is from authenticity identification and liquidity , also exists. And what’s more, other factors such as war is necessarily considered, too (Figure 1).
Statistical Analysis
The data in this paper comes from Program of China Family Panel Survey (CFPS) sponsored by Peking University in 2012, which contains 12465 questionnaires including household art collection and financial assets allocation.
Table 1 reports preliminary statistical results on relationship between household financial assets allocation and art collection. The household sample can be divided into single households whose financial assets are all cash and bank deposits and diverse households whose financial assets contains not only cash and bank deposits but also other types such as stock, bond etc. For the latter, the diverse household is further subdivided into risky households holding risky assets and risk-free households holding none risky assets.
| Average | Single household | Diverse household | ||
|---|---|---|---|---|
| No risky assets | Risky assets | |||
| Percentage total of holding East region art Middle region collection West region average annual income education input level Household population | 4.57% | 3.41% | 8.96% | 11.78% |
| 8.01% | 7.53% | 8.45% | 11.72% | |
| 4.65% | 3.62% | 7.83% | 12.97% | |
| 4.68% | 3.60% | 10.98% | 9.90% | |
| 46623.63 | 41019.87 | 60951.11 | 94404.03 | |
| 2967.30 | 2577.39 | 3555.19 | 6227.93 | |
| 3.89 | 3.90 | 4.02 | 3.42 | |
Table 1: Condition of household financial assets allocation and art collection in China.
It is revealed from Table 1 that 4.57% households choose art collection regardless of region difference. With considering risky assets into financial assets allocation, the percentage of households holding art collection arises, meanwhile accompanied by rising income, human capital and decreasing household population. The results show that there is a relationship of hierarchy between art collection holding and financial assets allocation. The percentage of holding art collection for single households is lower than that for diverse households, while in diverse households, the percentage of holding art collection for households with risky assets is higher than that for risk-free households. The reason is that the art collection, which needs some fundamental financial demand being satisfied as premise, including holding cash for transaction demand and possession of stock for preservation-addition demand, has a higher hierarchy. Only when fundamental financial demand is satisfied can household be more willing to own art collection. In addition, the result is also explained from the perspective of financial education: for financial activity in lower hierarchy, it is not necessary for household to have high-level financial literacy; for art collection, besides basic financial literacy, household should study professional knowledge about art collection, which will determine the market value in future. Therefore, a higher professional literacy requires a higher hierarchy.
Empirical analysis based on PSM
As is mentioned above, there is a relationship of hierarchy between holding art collection and financial assets allocation. Next, this paper will quantitatively analyze the behavior difference of holding art collection between households by propensity score matching(PSM).
Research Design
For household, how to allocate financial assets is the result of “self-selection” according to self-condition. Based on theoretical analysis above, specifically, this paper will consider the following 3 cases:
1. Division according to whether the type of household financial asset is single. Suppose that T1=0 indicates control group that type of household financial asset is all cash and bank deposits and that T1=1 indicates treatment group that type of household financial asset is diverse besides cash and bank deposits.
2. Division according to whether household owns risky assets. Suppose that T2=0 indicates control group that type of household financial asset is all risky-free and that T2=1 indicates treatment group that household holds risky assets.
3. In scope of diverse household, subdivision according to whether household owns risky assets. Suppose that T3=0 indicates control group that type of household financial asset is all risky-free and that T3=1 indicates treatment group that household holds risky assets.
Based on the three situations above, the self-selection behavior of holding art collection for household under the condition of Ti=1(i=1,2,3) is denoted by Y1, while Y0 is for the condition of Ti=0(i=1,2,3). Average Treatment Effect on the Treated group(ATT) for art collection holding of financial allocation in different household is focused on in this paper, which is denoted by ATT=E(Y1|Ti=1)- E(Y1|Ti=0). However, only the final result can be observed but the other one under another selection regardless of any types of financial allocation for household, which means that E(Y1|Ti=0) is unable to obtain. This situation is called Counter-factual Missing. If traditional method of linear regression is used to estimate parameter, E(Y0|Ti=1) needs to be substituted by E(Y0|Ti=0), which will cause a bias final result [6]. Propensity Scores Matching (PSM) can solve this problem effectively.
Several assumptions should be considered when unbiased estimation of ATT by using PSM will be acquired. These assumptions are theoretically proved by sponsors Rosenbaum and Rubin: suppose that firstly, (Y1, Y0) and treatment assignment Ti are known to be independent, which is called Strongly ignorable treatment assignment and secondly, 0<Pr(Ti =1|X)<1which is called Common support region assignment [7]. Matching samples are chosen by calculating propensity score in PSM, so several steps next should be followed in order to achieve goal we want: first, choosing variables reflecting household individual characteristic as independent variables and household financial assets condition as dependent variables, the parameters of variables reflecting household individual characteristic are estimated by Logit model and the propensity score of household financial assets is calculated, too; second, choosing the nearest propensity score of several individuals as samples in treatment group to match. At last, the result of ATT after matching is computed and tested statistically.
The major advantage of empirical analysis by PSM is effective elimination of endogeneity in model. Generally speaking, endogeneity in model is due to behavior of self-selection and omitted variables in most cases, which directly causes unbiased estimation of variables parameters in regression model. PSM is able to solve the problem of omitted variables caused by self-selection, which will make economic results from behavior of self-selection more pure.
Variable selection
This paper chooses individual characteristic of household below in Table 2. as independent variables and Y which means whether household holds art collection as dependent variable.
| Variable type | Label | Variable meaning | Variable value |
|---|---|---|---|
| Independent variables | East | Whether household is in east region. | Yes, east=1; no, east=0 |
| Middle | Whether household is in middle region. | Yes, middle=1; no, middle=0 | |
| Income | Household total income last year. | ||
| Home_own | Whether household own house. | Yes, home_own=1;no, home_own=0 | |
| Farmer | Whether some family member is farmer | Yes, farmer=1; no, farmer=0 | |
| Business | Whether some family member is in business | Yes, business=1; no, business=0 | |
| popu | Household population | Number of household members | |
| edu | Household education input level | Education expenditures per month | |
| Dependent variable | Y | Whether household holds art collection. | Yes, Y=1; no, Y=0 |
Table 2: Dependent and independent variables.
Econometric Model
As the research design is stated above, the econometric model is set below:
1. Assumptions:
(1) Strongly ignorable treatment assignment:  are independent variables in the model.
(2) Common support domain assignment: 
2. Propensity score calculation: First, household financial assets allocation as dependent variable are regressed in Logit and Probit model with the X as the independent variables; second, calculate propensity score based on the estimated coefficient above. The regression model is designed as:
 (1)
(1)
3. Confirm ATT estimation: ATT can be estimated by the formula below:
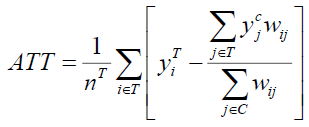 (2)
(2)
in formula (2), nT is the sample size of treatment group; y reflects art collection holding of household , i and j is separately a some household in treatment and control group; wij is weight, which means weight of y for household j when y for household i is substituted y for household j. It is determined by the difference of propensity score from two types of households [8].
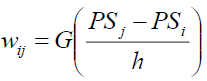 (3)
(3)
G (*) is stated as Gauss core function, PSj and PSi state different propensity score of household for the same standard separately; h is width parameter meaning the sample size.
Empirical Analysis and Robustness Test
To calculate propensity score, firstly, the probability of household financial assets allocation is regressed with logit model whose result is stated in Table 3. Secondly, after propensity score is obtained, a comparison of error elimination of independent variables before and after matching needs to be conducted further. If percentage of the standard bias error is no more than 20%, a good result will be obtained [9]. As is showed in Table 4, a good matching result is achieved that every variable has a percentage of the standard bias error with no more than 20% after matching. Difference of individual characteristic between treatment and control group is partly eliminated with a nearer sample average for the two groups.
| Dependent variables | Single allocation | Risky allocation for diverse household | Risky financial assets | |||
|---|---|---|---|---|---|---|
| Independent variables | coefficient | Z-statistic | coefficient | Z-statistic | coefficient | Z-statistic |
| east | -0.0030 | -0.08 | 0.3529*** | 4.02 | 0.2571*** | 4.53 |
| middle | -0.0490 | -1.34 | -0.0885 | -0.93 | -0.0113 | -0.18 |
| income | -2.6e-06*** | -15.41 | 1.7e-06*** | 4.62 | 1.93E-06 | 10.59 |
| home_own | 0.0025 | 0.06 | -0.0476 | -0.50 | -0.0168 | -0.29 |
| farmer | 0.2746*** | 9.41 | -1.4279*** | -18.93 | -1.0597*** | -20.54 |
| commercial | -0.2688*** | -6.34 | -0.4065*** | -4.56 | -0.0046 | -0.07 |
| popu | 0.0126 | 1.52 | -0.0482** | -2.20 | -0.0252** | -1.96 |
| edu | -0.00001*** | -7.09 | 0.00002*** | 4.80 | 0.00002*** | 8.30 |
| constant | 0.9546*** | 16.37 | 0.0425 | 0.30 | -1.3697*** | -15.81 |
| Pseudo R2 | 0.0468 | 0.0468 | 0.2584 | 0.2584 | 0.1779 | 0.1779 |
| LR chi2 | 545.37 | 545.37 | 740.59 | 740.59 | 1043.57 | 1043.57 |
| Log-Likelihood | -5553.09 | -5553.09 | -1063.00 | -1063.00 | -2410.83 | -2410.83 |
| Sample size | 12543 | 12543 | 2201 | 2201 | 12543 | 12543 |
| ***, **, * means variable is statistically significant at level of 1%, 5%, 10%. | ||||||
Table 3: Results of Logit regression.
| Variable | sample | Single household | Risky allocation for diverse allocation | Risky allocation | ||||||
|---|---|---|---|---|---|---|---|---|---|---|
| Average Standard | Average Standard | Average Standard | ||||||||
| Treatment group | Control group | Bias error (%) | Treatment group | Control group | bias error (%) | Treatment group | Control group | bias error (%) | ||
| east | Matching before | 0.4277 | 0.4607 | -6.6 | 0.6441 | 0.3592 | 59.4 | 0.6441 | 0.4194 | 46.2 |
| Matching after | 0.4277 | 0.4062 | 4.3 | 0.6189 | 0.6548 | -7.5 | 0.6441 | 0.6724 | -5.8 | |
| middle | Matching before | 0.2926 | 0.3108 | -4 | 0.2309 | 0.355 | -27.5 | 0.2309 | 0.3001 | -15.7 |
| Matching after | 0.2926 | 0.312 | -4.2 | 0.2409 | 0.2192 | 4.8 | 0.2309 | 0.2046 | 6 | |
| income | Matching before | 40950 | 72568 | -40.8 | 92855 | 61317 | 33.5 | 92855 | 43411 | 55.6 |
| Matching after | 40950 | 50210 | -11.9 | 76550 | 77773 | -1.3 | 92855 | 75210 | 19.9 | |
| home_own | Matching before | 0.8842 | 0.8782 | 1.8 | 0.852 | 0.8927 | -12.2 | 0.852 | 0.8852 | -9.8 |
| Matching after | 0.8842 | 0.8864 | -0.7 | 0.8582 | 0.8606 | -0.7 | 0.852 | 0.854 | -0.6 | |
| farmer | Matching before | 0.5912 | 0.4312 | 32.4 | 0.0969 | 0.6161 | -128.9 | 0.0969 | 0.5942 | -122.6 |
| Matching after | 0.5912 | 0.6186 | -5.6 | 0.1098 | 0.1174 | -1.9 | 0.0969 | 0.1041 | -1.8 | |
| commercial | Matching before | 0.0832 | 0.154 | -22 | 0.1301 | 0.1673 | -10.5 | 0.1301 | 0.0933 | 11.7 |
| Matching after | 0.0832 | 0.0721 | 3.5 | 0.1204 | 0.1268 | -1.8 | 0.1301 | 0.1369 | -2.2 | |
| popu | Matching before | 3.8989 | 3.8355 | 3.7 | 3.4235 | 4.0635 | -42.3 | 3.4235 | 3.9187 | -31.2 |
| Matching after | 3.8989 | 3.9307 | -1.9 | 3.3811 | 3.4727 | -6.1 | 3.4235 | 3.4728 | -3.1 | |
| edu | Matching before | 2639.6 | 4507.2 | -19.6 | 6227.9 | 3555.2 | 20.5 | 6227.9 | 2749.9 | 27.3 |
| Matching after | 2639.6 | 2820.5 | -1.9 | 4440 | 4519.8 | -0.6 | 6227.9 | 5192.2 | 8.1 | |
Table 4: Results of error elimination change for independent variables.
At present, there are several matching methods with their own focus including core matching, nearest neighbor matching and radius matching. The advantage of core matching is that all households in treatment group can be matched and the information from all households in control group can be fully used. Therefore, core matching is selected for estimation firstly in this paper as well as the estimated results from the other two methods stated together in view of robustness in the Table 5.
| Nearest Matching | Radius Matching | Core Matching | ||||
|---|---|---|---|---|---|---|
| ATT Estimation | t-statistic | ATT Estimation | t-statistic | ATT Estimation | t-statistic | |
| Single allocation | -0.0511*** | -5.74 | -0.0525*** | -5.29 | -0.0530*** | -7.14 |
| Risky allocation for diverse allocation | 0.0038 | 0.17 | 0.0017 | 0.09 | 0.0066 | 0.38 |
| Risky allocation | 0.0370** | 2.31 | 0.0261** | 2.16 | 0.0589*** | 4.99 |
Table 5: ATT estimation results of household art collection holding.
From Table 5, it is indicated that single household has a lower tendency to hold art collection compared to diverse household, with the significant difference of 5.11%, 5.25% and 5.30% under the three methods estimation. In the total sample, taking whether holding risky financial assets as division criteria, risky household has a higher tendency to hold art collection than risk-free household, with the significant difference of 3.70%, 2.61% and 5.89% under the three methods estimation.
For single household, the reason is that either transaction demand is not satisfied or risk-averse preference hampers holding risky assets, which hinders the higher development of financial demand and reduces the tendency to hold art collection [10]. For risky household, with the transaction demand satisfied, the increasing of demand of value preservation-addition promotes the tendency to hold art collection. And what’s more, for diverse household, the difference of tendency to hold art collection between household owning and not owning risky financial assets is not significantly enough, which reveals that whether holding risky financial assets doesn’t affect holding art collection significantly for diverse household.
Conclusion
From the perspective of hierarchy of household financial demand, by using micro-survey data of household in China, this paper analyzes the internal relationship and mechanism between financial assets allocation and art collection holding empirically. It is indicated that financial assets allocation affects art collection holding significantly. Specifically, diverse household has a higher tendency to hold art collection than single household; risky household has a higher tendency to hold art collection than household without risky financial assets. The reason is that holding art collection can satisfy the demand of value preservation-addition for household, whose higher hierarchy of demand needs fundamental financial demand to be satisfied ahead. Only transaction and risk preference demand satisfied can household be tend to expand scale of financial asset allocation and interest in art collection will be cultivated gradually.
References
- Liu XX, Zhou H. Household individual characteristic’s impact on borrowing behavior-survey from household in China. Journal of Financial Research. 2012;1:154-66.
- Meng YJ. Cognitive abilities and household portfolio choice. Economic Research Journal. 2014;132-42.
- Caballero RJ. On the macroeconomics of asset shortage. NBER Working paper series. 2006; 12753.
- Zhou H. Hierarchy of demand and participation of financial markets: Does life cycle effects exist in household financial behavior?—Empirical analysis based on China households. Finance and Trade Research. 2015;4:96-102.
- Market Branch of Ministry of Culture in PRC. Annual Report of Art Collection Market in China (2013). Beijing: People’s Fine Arts Publishing House, 2014.
- Hu HW, Zhang XY, Zhao YL. Medical insurance’s impacts on elder’s health service utilization: Based on the counterfactual estimation of the propensity score matching. Chinese Journal of Population Science. 2012;2:57-68.
- Rosenbaum PR, Rubin DB. The central role of the propensity score in observational studies for causal effects. Biometrika. 1983;70:41-55.
- Liu FQ, Ma H. Sensitivity analysis on the propensity score matching method. Statistics & Information Forum. 2009;24:7-13.
- Shao M, Bao Q. Impact of exporting enterprises transformation on employment and salary in China: An empirical study based on propensity score matching estimation. The Journal of World Economy. 2011;6:48-60.
- Zhou H. Risk attitude, consumer financial education and household participation in financial market. Economic Science. 2015;1:79-88.