Original Article
, Volume: 12( 12)Comparative Investigation on the Interaction of Cefonicid Sodium with Bovine Transferrin and Bovine Serum Albumin by Multi-Spectroscopy
- *Correspondence:
- Liu B , Key Laboratory of Analytical Science and Technology, College of Chemistry and Environmental Sciences, Hebei University, Baoding 071002, Hebei Province, PR China, Tel: +86-312-5079385; Fax: +86-312-5079525; E-mail: lbs@hbu.edu.cn
Received: July 08, 2016; Accepted: October 25, 2016; Published: November 04, 2016
Citation: Duan S, Liu B, Li T, et al. Comparative Investigation on the Interaction of Cefonicid Sodium with Bovine Transferrin and Bovine Serum Albumin by Multi-Spectroscopy. Biotechnol Ind J. 2016;12(12):115.
Abstract
The reaction mechanisms of cefonicid sodium to bovine serum albumin and bovine transferrin were studied by multi-spectroscopy methods. The results demonstrated that new complexes were formed between cefonicid sodium and the two proteins, which resulted in a static quenching of fluorescence of the two proteins. And the numbers of binding sites in the two systems were approximately equal to 1. In the reaction system, the drug binds with the two proteins mainly through electrostatic force. It also showed that in the two systems the hydrophobic environment around amino acid residues changed, and the primary binding sites for cefonicid sodium were both closer to tryptophan residues. Circular dichroism spectroscopy showed that the secondary structures of the two proteins were changed. The values of Hill's coefficients indicating that there were negative co-operativities in the interaction between subsequent ligands and the two proteins. In addition, the studies have showed that the binding between bovine serum albumin and cefonicid sodium was stronger. However, cefonicid sodium had larger influences on the microenvironment of bovine transferrin. The interaction between cefonicid sodium and different proteins will be helpful for extracting the common features, applying the unique characteristic of drug-proteins systems.
Keywords
Bovine transferrin; Bovine serum albumin; Cefonicid sodium; Multi-spectroscopic methods; Reaction mechanism
Introduction
Cefonicid Sodium (CFS), with molecular weight of 586.53, is the second generation of broad spectrum long-acting cephalosporin antibiotics, and performs its antibacterial activity by inhibiting the synthesis of bacterial cell walls. The following infections such as the lower respiratory tract infection, urinary tract infection, septicemia, skin and soft tissue infections, bone and joint infection, and surgery infection prevention can be treated by this drug [1]. The molecular formula of CFS is C18H16N6NA2O8S3, its structure was shown in Figure 1.

Figure 1: Cefonicid sodium.
Serum protein contains lots of albumin, transferrin, immunoglobulin, etc. Albumin and transferrin have important physiological functions in storing and transporting the endogenous metabolites and exogenous drug molecules [2]. In addition, serum protein is purified easily. Therefore, they are widely used in scientific research to conduct investigations of the interaction between protein and drug. The structures of Bovine transferrin (BTF) and Bovine serum albumin (BSA) are different. Transferrin (TF) is a single-chain protein, which containing 679 amino acid residues. The serum concentration of TF in vivo is 2.5 mg mL−1, and the molecular weight is 77 kDa. This protein is divided into two lobes (N and C), each of which contains two domains comprising a series of α -helices and β -sheets [3]. TF can bind iron ions between the two domains of each lobe [4]. BSA is a globulin in bovine serum, containing 583 amino acid residues, and has a molecular weight of 67 kDa [5]. The spatial structure of BSA containing three structural domains, each domain forms cylindrical structure in the form of the relative notch. And in the cylinder a hydrophobic cavity was formed [6]. BTF and BSA can both combine with a variety of endogenous and exogenous substances, which is helpful for implementing the transport of drugs in fixed point and orientation and making drugs targeting. This can play efficacy of drugs more effectively. Moreover, the interaction between small molecule drug and protein directly affect the absorption, metabolism, pharmacology, toxicology and the efficacy of the drug in the body, which forms the basis to re-design or modify the drug molecular. And this is an important way to understand the biological effects of proteins.
Currently, most study of the protein-drug interaction use one protein as a model protein. However, the reports about a comparative study on the interactions of drug with two proteins are very rarely. Investigation on the interactions of drugs with different proteins can study the efficacy of the drug more widely, understand the effects of drugs on the structure and function of proteins, understand the essence of the interaction between drug and protein. The interactions between drugs and different proteins will be helpful for extracting the common features, applying the unique characteristics. In this experiment, the comparative study about the interactions between CFS and BTF/BSA was carried on, and it has important implication for the clinical application of drugs.
Materials and Methods
Materials
Reagents: CFS (purity > 98.5%). BTF (purity > 98.5%) and BSA (purity > 99%) were purchased from Sigma-Aldrich. Stock solutions of BTF (1.0 × 10⁻⁵ M), BSA (1.0 × 10⁻⁵ M) and CFS (1.0 × 10⁻³ M) were stocked at 4°C. Tris (hydroxymethyl) aminomethane hydrochloride (Tris-HCl) buffer solution (PH = 7.4) containing NaCl (0.15 M) was prepared.
Methods
UV-Vis absorption measurements: The UV-Vis experiment was carried out on a UV-Vis recording spectrophotometer (UV-265, Shimadzu, Japan) with 1.0 cm quartz cells. 1.0 ml Tris-HCl (pH = 7.40), 2.0 ml BTF or BSA solution (1.0 × 10⁻⁵ M) and different concentrations of CFS were added into 10 mL colorimetric tube successively. The reference was different concentrations of CFS solution. The samples kept static for 30 min at 298 K. The absorption spectra of BTF or BSA in the presence of different concentrations of CFS were recorded in the wavelength range of 190 nm-350 nm.
Fluorescence measurements and Synchronous fluorescence measurements: All fluorescence experiments were carried out on a Shimadzu RF-5301PC Spectro fluoro-photometer equipped with a SYC-15B superheated water bath (Nanjing Sangli Electronic Equipment Factory, Nanjing, China). The experiments were carried out with a 1.0 cm path length cell. In a typical fluorescence measurement, 1.0 ml Tris-HCl (pH = 7.40), 1.0 ml BTF or BSA solution (2.0 × 10⁻⁶ M) and different concentrations of CFS were added into 10 ml colorimetric tube successively. The samples were diluted to scaled volume with double-distilled water, mixed thoroughly by shaking, and kept static for 30 min at different temperatures (298, 303 and 310 K). The excitation wavelength for BTF or BSA was 280 nm and 295 nm, respectively. The excitation and emission slits were set at 5 nm. The solution was subsequently scanned on the fluoro-photometer and recorded the fluorescent intensity of BTF or BSA.
In synchronous fluorescence measurement, solution preparation was as detailed above. We recorded the synchronous fluorescence spectra of the BTF/BSA-CFS system when the Δλ value between the excitation and emission wavelengths was stabilized at 15 nm and 60 nm, respectively.
Circular dichroism measurements: The CD measurements were performed on a MOS-450/SFM300 circular dichroism spectrometer (Bio-Logic, France) with a 1.0 mm path length quartz cuvette. 1.0 ml Tris-HCl (pH = 7.40), 1.0 ml BSA or BTF solution (1.0 × 10⁻⁵ M) and different concentrations of CFS were added into 10 ml colorimetric tube successively, made the concentration ratio of protein and drug were 1:0, 1:10, 1:20, respectively. The samples were diluted to scaled volume with water, mixed thoroughly by shaking, and kept static for 30 min at 298 K. Each spectrum was recorded at wavelengths between 200 nm and 300 nm and a scan speed of 1 nm sec-1.
Results and Discussion
UV-Vis absorption studies of BTF/BSA-CFS system
Absorption spectral measurement is a simple but effective method in confirming the complex formation and structural change [7]. This method can determine the interaction mechanism of protein and drugs. Dynamic quenching only affects the excited state of fluorescein, so the absorption spectrum doesn't change. On the contrary, static quenching can form a ground state complex, which leads to changes in the fluorophore absorption spectrum [8]. The UV-Vis absorption spectra of BTF/BSA -CFS system were shown in Figure 2. It can be seen that BTF or BSA had a strong absorption peak at 212 nm or 210 nm, and had a weak absorption peak at 281 nm or 280 nm. The intensity of the peak at 212 nm or 210 nm decreased and an obvious red shift in the position of the absorbance peak could be observed along with the increase of CFS. This could be attributed to the new complex formation between CFS and BTF/BSA, which was a static quenching process.

Figure 2: Absorption spectra of BTF/BSA-CFS system (T = 298 K) (a): BTF-CFS, (b): BSA-CFS, CBTF = CBSA = 2.0 × 10⁻⁶ M, CCFS = (0, 0.4, 1.0, 2.0, 3.0, 4.0, 5.0) × 10-5 M.
The mechanism of quenching of BTF/BSA fluorescence by CFS
Fluorescence quenching refers to the reaction between the fluorescent molecule and the solvent molecules, which reduce the fluorescence of fluorescent substances. Because of its outstanding sensitivity, selectivity, reproducibility, easy implication and vast theoretical foundation, fluorescence spectroscopy is an appropriate method to investigate interactions between drugs and proteins [9]. The excitation wavelength are fixed in λex = 280 nm and λex = 295 nm, respectively. When the excitation wavelength is fixed at 280 nm, the tryptophan and tyrosine residues in protein are excited, whereas at 295 nm wavelength, the peak is mainly attributed to emission of only tryptophan residues [10]. Fluorescence quenching experiments were performed according to the experimental step of “Fluorescence measurements”. The fluorescence spectra of BTF/BSA by CFS system (λex = 280 nm) were shown in Figure 3, which revealed that the fluorescence intensity of BTF/BSA decreased regularly with the addition of CFS. Results showed that the intrinsic fluorescence of BTF and BSA were quenched by CFS strongly and that there was an interaction between CFS and BTF or BSA. The different mechanisms of quenching are usually classified as either dynamic quenching or static quenching. Dynamic quenching is based on collisions between protein and drug. Static quenching is based on the interaction between protein and drug occurring during the formation of a ground-state complex [11]. The different quenching mechanisms can be differentiated by their different dependences on temperature. Quenching constant and binding constant values in case of static quenching decrease due to the reduction in stability of complex which is resulting from increase in temperature. In contrast, in dynamic quenching, higher temperature can cause increase in collision, so the quenching constant and binding constant values are expected to increase [12].

Figure 3: Fluorescence spectrum of BTF/BSA-CFS system (T = 310 K, λex = 280 nm) (a): BTF-CFS, (b): BSA-CFS, CBTF = CBSA = 2.0 × 10⁻⁷ M, CCFS = (0, 4.0, 8.0, 20, 30, 40, 50, 60, 70, 80) × 10-6 M.
In order to investigate the quenching type between CFS and the two proteins, the fluorescence quenching data were analyzed using the Stern-Volmer Eq. (2) [13]:
 (2)
(2)
According to Eq. (2), the Ksv and Kq values can be obtained. Table 1 summarizes the values of Ksv and Kq at different temperature, which shows that the values of Ksv decreased with increasing temperature in all systems, indicating that the probable quenching mechanism may not be initiated by dynamic collision but by complex formation. In addition, all the values of Kq were much greater than the maximum scatter collision quenching constant values of various quenchers (2.00 × 10¹⁰ M-1 s-1), further suggesting that the reaction was a static process [14]. This means the systems of BTF-CFS and BSACFS both generated a new non-fluorescent compound.
| λex(nm) | T (K) | Kq(M-1 s-1) | KSV(M-1) | R1 | SD | |
|---|---|---|---|---|---|---|
| BTF-CFS | 298 | 1.35 × 10¹² | 1.35 × 10⁴ | 0.9942 | 0.0484 | |
| 280 | 303 | 1.04 × 10¹² | 1.04 × 10⁴ | 0.9981 | 0.0254 | |
| 310 | 7.38 × 10¹¹ | 7.38 × 10³ | 0.9966 | 0.0055 | ||
| 298 | 5.47 × 10¹¹ | 5.47 × 10³ | 0.9951 | 0.0179 | ||
| 295 | 303 | 5.12 × 10¹¹ | 5.12 × 10³ | 0.9970 | 0.0188 | |
| 310 | 4.75 × 10¹¹ | 4.75 × 10³ | 0.9943 | 0.0144 | ||
| BSA-CFS | 298 | 4.55 × 10¹² | 4.55 × 10⁴ | 0.99869 | 0.0556 | |
| 280 | 303 | 4.01 × 10¹² | 4.01 × 10⁴ | 0.99856 | 0.0524 | |
| 310 | 3.80 × 10¹² | 3.80 × 10⁴ | 0.99763 | 0.0669 | ||
| 298 | 2.44 × 10¹² | 2.44 × 10⁴ | 0.99444 | 0.0696 | ||
| 295 | 303 | 2.00 × 10¹² | 2.00 × 10⁴ | 0.99845 | 0.0348 | |
| 310 | 1.93 × 10¹² | 1.93 × 10⁴ | 0.99421 | 0.0528 | ||
| R1 is the linear relative coefficient of F0/F~ [L]; SD is the standard deviation of KSV. | ||||||
Table 1: Quenching constant of CFS and BTF/BSA at different temperatures.
For static quenching, the binding constants (Ka) and the number of binding sites (n) is obtained by the following equation [15]:
 (3)
(3)
The results were shown in Table 2. The results showed that all the values of n were approximately equal to 1 at different temperatures, implying that there was just one binding site for CFS existed in BTF or BSA. Meanwhile, the decrease in the binding constants with increase in temperature, suggested that high temperature reduced the binding affinity of BTF/BSA and CFS, further suggesting that the quenching was a static process. This was in accordance with the above conclusion. In addition, as shown in Table 2, the binding constants when λex = 280 nm were greater than the binding constants when λex = 295 nm at the same temperature. This indicated that tyrosine residues and tryptophan residues were both involved in the interaction of BTF/BSA and CFS. Comparing the data in Table 2, we can see the binding constants of BSA-CFS system were larger than the BTF-CFS system significantly, which indicated that the binding between BSA and CFS was stronger. This may be due to the structure of BSA is different from BTF.
| λex(nm) | T (K) | Ka(M-1) | n | R2 | SD | |
|---|---|---|---|---|---|---|
| BTF-CFS | 298 | 1.16 × 10⁴ | 1.28 | 0.9967 | 0.0461 | |
| 280 | 303 | 1.03 × 10⁴ | 0.93 | 0.9978 | 0.0462 | |
| 310 | 9.45 × 10³ | 0.94 | 0.9913 | 0.0781 | ||
| 298 | 6.08 × 10³ | 1.19 | 0.9931 | 0.0544 | ||
| 295 | 303 | 5.35 × 10³ | 1.09 | 0.9978 | 0.0147 | |
| 310 | 4.07 × 10³ | 0.92 | 0.9961 | 0.0454 | ||
| BSA-CFS | 298 | 4.80 × 10⁴ | 0.90 | 0.9991 | 0.0345 | |
| 280 | 303 | 4.19 × 10⁴ | 0.91 | 0.9975 | 0.0491 | |
| 310 | 3.95 × 10⁴ | 0.85 | 0.9970 | 0.0469 | ||
| 298 | 2.73 × 10⁴ | 0.84 | 0.9989 | 0.0345 | ||
| 295 | 303 | 2.05 × 10⁴ | 0.81 | 0.9985 | 0.0237 | |
| 310 | 1.97 × 10⁴ | 0.94 | 0.9975 | 0.0382 | ||
| R2 is the linear relative co-efficient of log [(F0−F)/F] ~ log [L]. SD is the standard deviation of Ka. | ||||||
Table 2: Binding constant of CFS and BTF/BSA at different temperatures.
Participation of amino acid residue studies in the BTF/BSA-CFS system
Comparing the fluorescence quenching of BTF/BSA excited at 280 nm and 295 nm, the participation of tyrosine and tryptophan groups in BTF/BSA-CFS system can be assessed [16]. Figure 4 showed that in the presence of CFS, the quenching curve of BTF or BSA at 280 nm was much greater than that at 295 nm. This phenomenon showed that tryptophan and tyrosine residues were both essential in the interaction between CFS and BTF or BSA.

Figure 4: Quenching curves of BTF/BSA-CFS system (λex = 280/295 nm) (a): BTF-CFS, (b): BSA-CFS, CBTF = CBS = 2 × 10⁻⁷ M, CCFS = (0, 4.0, 8.0, 50, 60, 70, 80) × 10-6 M.
Synchronous fluorescence spectra studies of BTF/BSA-CFS system
Synchronous fluorescence spectroscopy can not only provide the microenvironment information near the fluorophore exactly [17], but also can determine the specific binding site of drugs and protein. Therefore, the method is often used to study the interaction between protein and small molecular ligands. The synchronous fluorescence spectroscopy of BTF or BSA could provide the characteristic information of tyrosine or tryptophan residues when the wavelength interval (Δλ) between excitation wavelength and emission wavelength is 15 nm or 60 nm [18]. We can explore the change of microenvironment of amino acid residues by measuring the emission wavelength shift. If there is a red shift at the maximum emission, then the hydrophobicity around the amino acid residues decreased and the polarity increased, otherwise, the polarity around the amino acid residues decreased and the hydrophobicity increased [19]. It can be seen from Figure 5, a gradual decrease of the synchronous fluorescence intensity of BTF/BSA-CFS system was observed upon addition of CFS, which indicated that CFS could quench the intrinsic fluorescence of BTF/BSA strongly. In addition, in the BTF-CFS system, when Δλ was 15 nm or 60 nm, an obvious red shift at the maximum emission wavelength was observed upon addition of CFS, which indicated that the polarity around the tryptophan and tyrosine residues increased. While, for BSA-CFS system, when Δλ was 15 nm, there was no significant shift was observed. However, when Δλ was 60 nm, a slight red shift at the maximum emission was observed upon addition of CFS. This indicated that the addition of CFS had no effect on the polarity of the tyrosine residues of BSA, while, making the hydrophobicity around the tryptophan residues decreased and the polarity increased. The results showed that the conformation of BTF and BSA were both changed with the addition of CFS, but the changes were different. The influence of CFS to BTF was larger than to BSA.

Figure 5: Synchronous fluorescence spectrum of BTF-CFS system (T = 310K) ((a): Δλ = 15 nm, (b): Δλ = 60 nm) and BSA-CFS system ((c): Δλ = 15 nm, (d): Δλ = 60 nm), CBTF = CBSA = 2.0 × 10⁻⁷ M, CCFS = (0, 4.0, 8.0, 20, 30, 40, 50, 60, 70, 80) × 10-6 M.
In order to further confirm the specific binding site of the CFS to BTF/BSA, the synchronous fluorescence quenching ratios (RSFQ) at Δλ = 15 nm and 60 nm were compared. RSFQ express the decreasing percentages of synchronous fluorescence intensity. We can obtain RSFQ by the equation: RSFQ = 1−F/F0 [20]. The corresponding ratios of RSFQ were illustrated in Figure 6.From Figure 6 it can be seen that the RSFQ for Δλ = 60 nm were bigger than corresponding ones for Δλ = 15 nm in the twosystems, which revealed that the binding site of CFS to the BTF/BSA was closer to tryptophan residues.

Figure 6: Ratios of synchronous fluorescence quenching (RSFQ) of BTF/BSA-CFS system (T = 310 K) (a): BTF-CFS, (b): BSA-CFS, CCFS = (4.0, 5.0, 6.0, 7.0, 8.0) × 10-5 M.
Type of interaction force in BTF/BSA-CFS system
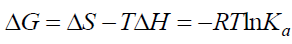
The interaction forces between a small molecule and macromolecule include four types of interactions, namely hydrogen bonding, electrostatic forces, van der Waals interactions and hydrophobic interactions [21]. Generally, the thermodynamic parameters (enthalpy change ΔH, entropy change ΔS and free energy change ΔG) are analyzed in order to further characterize the acting forces between drug and protein, as these are the main evidences to propose the binding mode [22]. In the studies the temperature effect was very small so the interaction enthalpy changes (ΔH) can be taken constant [23]. The thermodynamic parameters can be calculated based on the Eq. (4), (5), (6) [24].
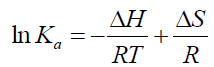 (4)
(4)
 (5)
(5)
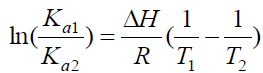 (6)
(6)
The thermodynamic parameters were listed in Table 3. As can be seen from Table 3, the negative value of ΔG confirmed a spontaneous reaction between BTF/BSA and CFS. The negative value of ΔH and positive value of ΔS indicated that CFS mainly bound to BTF/BSA by an electrostatic attraction [25]. Comparing the values of ΔG in the two systems, it can be known ΔG of BSA-CFS system was smaller than BTF-CFS system, indicating that the degree of spontaneous reaction of BSA-CFS system was larger than BTF-CFS system. So, the reaction of BSA-CFS system was more likely to occur. Therefore, the binding constants of BSA-CFS system were larger.
| T/(K) | Ka/(L·mol-1) | ΔH/(KJ·mol-1) | ΔS/(J·mol-1·K-1) | ΔG/(KJ·mol-1) | ||
|---|---|---|---|---|---|---|
| BTF-CFS | λex = 280 nm | 298 | 1.16 × 10⁴ | 17.92 | -23.19 | |
| 303 | 1.03 × 10⁴ | -17.85 | 17.92 | -23.28 | ||
| 310 | 9.45 × 10³ | 18.54 | -23.59 | |||
| λex = 295 nm | 298 | 6.08 × 10³ | 7.99 | -21.59 | ||
| 303 | 5.35 × 10³ | -19.20 | 7.99 | -21.63 | ||
| 310 | 4.07 × 10³ | 7.15 | -21.42 | |||
| BSA-CFS | λex = 280 nm | 298 | 4.80 × 10⁴ | 21.14 | -26.71 | |
| 303 | 4.19 × 10⁴ | -20.41 | 21.12 | -26.81 | ||
| 310 | 3.95 × 10⁴ | 22.16 | -27.28 | |||
| λex = 295 nm | 298 | 2.73 × 10⁴ | 14.86 | -25.31 | ||
| 303 | 2.05 × 10⁴ | -20.88 | 13.62 | -25.01 | ||
| 310 | 1.97 × 10⁴ | 14.86 | -25.49 |
Table 3: The thermodynamic parameters of BTF/BSA-CFS system at different temperatures.
CD spectra of BTF/BSA-CFS system
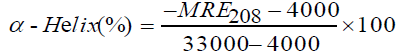
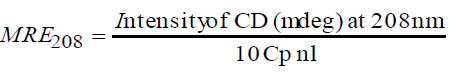
The CD spectra of BTF/BSA-CFS system at pH 7.4 were shown in Figure 7. As evident from Figure 7, pure BTF and BSA showed that the CD spectra of BSA exhibited two negative peaks in the UV region at 208 and 222 nm, which are characteristic features of α-helix structure of proteins [26]. A reasonable explanation is that the negative peaks at 208 nm and 222 nm are both contributed by n → π* transition for the peptide bond of α-helix [27]. The experiments were performed at the [BTF]/[CFS] molar ratios of 1:0, 1:10 and 1:20. And the molar ratios of [BSA]/[CFS] were also 1:0, 1:10 and 1:20. In the presence of CFS, an increase in the negative molar ellipticity of the signals at 208 and 222 nm was observed, which indicated an enhancement of α-helical content of the BTF/BSA upon binding with CFS [28]. In order to further demonstrate the change of α-helical content of the BTF/BSA, the percentage of helicity can be calculated using the following equation [29]:

Figure 7: The circular dichroism spectra of BTF/BSA-CFS system (T = 293 K) (a): BTF-CFS, (b): BSA-CFS, CBTF= CBSA = 1 × 10⁻⁶ M, CCFS = (1.0, 2.0, 4.0) × 10-5 M.
 (7)
(7)
 (8)
(8)
The calculated results showed that there was an increase in the α-helix content from 14.34% in pure BTF to 15.97% and 17.54% in the BTF-CFS complexes. And there was an increase in the α-helix content from 43.64% in pure BSA to 45.77% and 48.31% in the BSA-CFS complexes. This showed that the secondary structure of BTF/BSA had been changed. And the secondary structure of BSA was disturbed more than BTF. However, the similarity between the shapes of the CD spectra pertaining to BTF/BSA in the presence and the absence of the CFS in all interacting systems suggested that the structure of BTF/BSA was still predominantly α-helical [30].
Hill’s coefficient of the BTF/BSA-CFS system
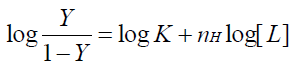
In biochemistry, the binding of a ligand molecule at one site with a macromolecule often influences the affinity for other ligand molecules with this macromolecule. This is known as cooperative binding. It is classified into positive co-operativity, negative co-operativity and non-cooperativity according to the promotion or inhibition of the affinity for other ligand molecules. Hill’s coefficient provides a way to quantify this effect and is calculated graphically on the basis of the following equation [31]:
 (9)
(9)
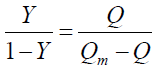
Where Y is the fractional binding saturation, nH is the Hill’s coefficient. Values of Hill’s coefficient > 1 indicate positive cooperativity, values < 1 indicate negative co-operativity and values = 1 indicate a non-cooperative reaction. For fluorescence measurement:
 (10)
(10)
 (11)
(11)
1/Qm is the intercept of a plot of 1/Q vs.1/[L]. As can be seen from Table 4, the values of nH were < 1, which indicated that there was negative cooperation in the interaction of CFS with BTF/BSA. This showed that the ability of subsequent ligands binding to BTF/BSA decreased with the previous CFS binding to BTF/BSA gradually. In addition, nH were inversely correlated with increasing temperature, which is also one reason for the reduction in Ka with increasing temperature [32].
| T/(K) | λex = 280 nm | λex = 295 nm | |||
|---|---|---|---|---|---|
| nH | R3 | nH | R3 | ||
| BTF-CFS | 298 303 310 |
0.99 0.88 0.68 |
0.9910 0.9932 0.9998 |
0.73 0.69 0.66 |
0.9959 0.9957 0.9998 |
| BSA-CFS | 298 | 0.99 | 0.9958 | 0.99 | 0.9977 |
| 303 | 0.88 | 0.9989 | 0.96 | 0.9980 | |
| 310 | 0.78 | 0.9940 | 0.94 | 0.9933 | |
| R3 is the linear relative coefficient of log[Y/(1−Y)]~log [L]. | |||||
Table 4: Hill’s coefficient of BTF/BSA-CFS systems at different temperatures.
Conclusion
In this paper, traditional fluorescence quenching method, synchronous fluorescence spectroscopy, UV-V is absorption spectroscopy and circular dichroism spectroscopy were used to study the quenching mechanism, thermodynamic parameters, the influence of drug on protein’s conformation and the cooperative binding in the two different systems. The results showed that the quenching mechanism of BTF/BSA-CFS system was static quenching. There was a closer binding between BSA and CFS, thereby the binding constants of BSA-CFS system were bigger. However, synchronous fluorescence spectroscopy proved that CFS had a greater impact on the microenvironment of BTF. These results are due to the different structures of BTF and BSA. The obtained results suggested that both proteins could act as drug carriers, but that BSA potentially had a higher capacity for delivering CFS. The valuable information obtained from these experiments will help researchers understand the pathways of drug delivery, and have practical implication for clinical application of cephalosporin drugs.
Acknowledgment
The authors gratefully acknowledge the financial support of National Science Foundation of China (No. 21375032).
References
- Li Q, Liang YH, Sun J, et al. Journal of Hebei Normal University. Natural Science Edition. 2010;34(2):187-91.
- Tan T, Huang R, Xia ZN. Studies on interaction between drugs with serum albumin by modified fluorescence spectroscopy. Chin J Anal Chem. 2007;35(10):1415-20.
- Chamani J, Vahedian-Movahed H, Saberi MR. Lomefloxacin promotes the interaction between human serum albumin and transferrin: A mechanistic insight into the emergence of antibiotic's side effects. J Pharm Biomed Anal. 2011;55(1):114-24.
- Zhang XF, Chen L, Yang QF. et al. Spectroscopic and molecular modeling study of cyanine dye interacting with human serum transferrin. Colloids and Surfaces A Physicochem Eng Aspects. 2015;469:187-93.
- Poór M, Li Y, Matisz G, et al. Quantitation of species differences in albumin–ligand interactions for bovine, human and rat serum albumins using fluorescence spectroscopy: A test case with some Sudlow's site I ligands. J Lumin. 2014;145:767-73.
- Guo M, Fan WX, Wu RH. Pharmaceutical Sciences: Review. Chin Pharm J. 2013;48(24):2089-97.
- Hooshyar Z, Bardajee GR, Kakavand N, et al. Investigations on the interactions of DiAmsar with serum albumins: Insights from spectroscopic and molecular docking techniques J Lumin. 2015;30(5):538-48.
- Patel R, Mir MU, Maurya JK, et al. Spectroscopic and molecular modelling analysis of the interaction between ethane-1,2-diyl bis(N,N-dimethyl-N-hexadecylammoniumacetoxy)dichloride and bovine serum albumin . J Lumin. 2015;30(8):1233-41.
- Rub MA, Khan JK, Asiri AM, et al. Study on the interaction between amphiphilic drug and bovine serum albumin: A thermodynamic and spectroscopic description. J Lumin. 2014;155:39-46.
- Ali MS, Al-Lohedan HA. Multi-technique approach on the interaction between sugar-based surfactant n-dodecyl β-d-maltoside and bovine serum albumin. J Lumin. 2016;169:35-42.
- Topraka M, Ar?k M. The investigation of the interaction between orientin and bovine serum albumin by spectroscopic analysis. J Lumin. 2013;29:805-9.
- Meti MD, Byadagi KS, Nandibewoor ST, et al. Multi-spectral characterization and effect of metal ions on the binding of bovine serum albumin upon interaction with a lincosamide antibiotic drug, clindamycin phosphate. J Photoch Photobio B. 2014;138:324-30.
- Sinisi V, Forzato C, Cefarin N.Interaction of chlorogenic acids and quinides from coffee with human serum albumin. Food Chem. 2015;168:332-40.
- Zhang XH, Lin YJ, Liu LN, et al. Study on the synthesis of sulfonamide derivatives and their interaction with bovine serum albumin. J Lumin. 2014;30(3):269-79.
- Sudha N, Sameena Y, Chandrasekaran S. Alteration of the binding strength of dronedarone with bovine serum albumin by β-Cyclodextrin: A spectroscopic study. Spectrosc Lett. 2014;48(2):112-9.
- Maciazek-Jurczyk M, Sulkowska A, Bojko B, et al. Fluorescence analysis of competition of phenylbutazone and methotrexate in binding to serum albumin in combination treatment in rheumatology. J Mol Struct. 2009;924-26:378-84.
- Li XR, Hao YB. Probing the binding of (+)-catechin to bovine serum albumin by isothermal titration calorimetry and spectroscopic techniques. J Mol Struct. 2015;1091:109-17.
- Moghaddam MM, Pirouzi M, Saberib MR, et al. Comparison of the binding behavior of FCCP with HSA and HTF as determined by spectroscopic and molecular modeling techniques. J Lumin. 2014;29(4):314-31.
- Yu XY, Yang Y, Liu RH, et al. The investigation of the interaction between edaravone and bovine serum albumin by spectroscopic approaches. J Lumin. 2011;131(7):1510-4.
- Chen DD, Wu Q, Wang J, Spectroscopic analyses and studies on respective interaction of cyanuric acid and uric acid with bovine serum albumin and melamine. Spectrochim Acta A Mol Biomol Spectrosc. 2015;135:511-20.
- Qin Y, Zhang YX, Yan SL, et al. A comparison study on the interaction of hyperoside and bovine serum albumin with Tachiya model and Stern–Volmer equation. Spectrochim Acta A Mol Biomol Spectrosc. 2010;75(5):1506-10.
- Naik KM, Nandibewoor ST. Spectral characterization of the binding and conformational changes of bovine serum albumin upon interaction with an anti-fungal drug, methylparaben. Spectrochim Acta A Mol Biomol Spectrosc. 2013;105:418-23.
- Wang Y, Zhu RR, Ni YN, et al. Competitive interactions of anti-carcinogens with serum albumin: A spectroscopic study of bendamustine and dexamethasone with the aid of chemometrics. Spectrochim Acta A Mol Biomol Spectrosc. 2014;123:241-48.
- Shi SY, Zhang YP, Xiong X. The influence of flavonoids on the binding of pantoprazole to bovine serum albumin by spectroscopic methods: With the viewpoint of food/drug interference. Food Chem. 2012;135:1083-90.
- Ma XL, Yan J, Wang Q, et al. Spectroscopy study and co-administration effect on the interaction of mycophenolic acid and human serum albumin. J Biol Macromol. 2015;77:280-6.
- Durgannavar AK, Patgar MB, Nandibewoor ST, et al. Fluorescent bovine serum albumin interacting with the antitussive quencher dextromethorphan: a spectroscopic insight. J Lumin. 2015;31(3):843-50.
- Shahabadi N, Hadidi S, Feizi F. Study on the interaction of antiviral drug ‘Tenofovir’ with human serum albumin by spectral and molecular modeling methods. Spectrochim Acta A. 2015;138:169-75.
- Keswani N, Kishore N. Calorimetric and spectroscopic studies on the interaction of anticancer drug mitoxantrone with human serum albumin. J Chem Thermodynamics. 2011;43(9):1406-13.
- Meti MD, Nandibewoor ST, Joshi SD, et al. Binding interaction and conformational changes of human serum albumin with ranitidine studied by spectroscopic and time-resolved fluorescence methods. J Iran Chem Soc. 2016;13(7):1325-38.
- Naseri A, Hosseini S, Rasoulzadeh F, et al. Interaction of norfloxacin with bovine serum albumin studied by different spectrometric methods; displacement studies, molecular modeling and chemometrics approaches. J Lumin. 2015;157:104-12.
- Bojko B, Su?kowska A, Maciazek-Jurczyk M, et al. The influence of dietary habits and pathological conditions on the binding of theophylline to serum albumin. J Pharm Biomed Anal. 2010;52(3):384-90.
- Han R, Liu BS, Li GX, et al. Investigation on the interaction of cefpirome sulfate with lysozyme by fluorescence quenching spectroscopy and synchronous fluorescence spectroscopy J Lumin. 2015;31(2):580-86.