Original Article
, Volume: 16( 14)UPLC-MS/MS Method for Kinetic Studies and Simultaneous Determination of Amlodipine and Atorvastatin in Bulk, and Their Combined Dosage Form
- *Correspondence:
- Ahmed M, Pharmaceutical Chemistry Department, Faculty of Pharmacy, Helwan University, Ein Helwan, 1179, Cairo, Egypt, Tel: +61469762571; Fax: +20225541601; E-mail: ahmead34@yahoo.com
Received: June 07, 2016; Accepted: June 25, 2016; Published: July 04, 2016
Citation: Ahmed M, Alshabrawy A, Nageh A. UPLC-MS/MS Method for Kinetic Studies and Simultaneous Determination of Amlodipine and Atorvastatin in Bulk, and Their Combined Dosage Form. Anal Chem Ind J. 2016;16(14):102.
Abstract
The aim of this work was to develop and validate a simple, sensitive and rapid method for the simultaneous quantitation of amlodipine and atorvastatin in bulk and their combined pharmaceutical formulation and application of method in forced degradation study. The chromatographic separation was achieved on a 50 mm × 2mm, 1.9 μm Hypersil gold column, with gradient elution. The analytes were detected using selective reaction monitoring (SRM) mode on a triple quadrupole mass spectrometer coupled with electrospray ionization (ESI) worked in positive mode and negative mode for Amlodipine (AMO) and Atorvastatin (ASN) respectively. The detection was done by monitoring of 409.47 → 238.22 (m/z), 557.65 → 397.27 (m/z), and 256.15 → 167.07 (m/z) for amlodipine, atorvastatin and diphenhydramine (IS) respectively. The method was validated over concentration range of (3-50) ng/mL and (0.8-50) ng/mL for Amlodipine (AMO) and Atorvastatin (ASN) respectively, for its linearity, robusticity, intra- and inters- day reproducibility. The lower limits of detection (LOD) were found to be 0.23 ng/mL and 0.56 ng/mL and lower limits of quantitation (LOQ) were found to be 0.69 ng/mL and 1.7 ng/mL for amlodipine and atorvastatin respectively. The method was applied successfully to quantitate atorvastatin and amlodipine in laboratory bulk mixture and their combined pharmaceutical dosage form. Also this method was used in stressed degradation study for identification of degradation products and calculation of kinetic parameters.
Keywords
UPLC-MS/MS; Amlodipine; Atorvastatin; Forced degradation; Kinetic degradation
Introduction
Hypertensive patients have high incidence of having atherosclerosis. Calcium Channel Blockers (CCBs) have been successfully used as antihypertensive over the last decades. On the other hand, Statins have demonstrated a potent effect in lowering blood level of lipids [1]. Combination of CCBs and Statins may have an additive or synergistic effect on prevention of coronary atherosclerosis [2]. Amlodipine (AMO) (IUPAC name: 3-Ethyl 5-methyl 2-[(2-aminoethoxy)methyl]-4-(2- chlorophenyl)-6-methyl-,4-dihydro-,5-pyridinedicarboxylate and CAS:88150-42-9) (Figure 1) is a calcium channel blocker used in treatment of chronic stable angina and in management of mild-to-moderate essential hypertension [3]. AMO inhibits the entry of calcium into vascular and cardiac muscles [4]. Atorvastatin (ASN) (IUPAC name: (3R,5R)-7-[2-(4-fluorophenyl)-3-phenyl-4-(phenylcarbamoyl)-5-propan-2-ylpyrrol-1-yl]-,5-dihydroxyheptanoic acid and CAS: 134523-00), (Figure 1) is a second generation of 3-hydroxy-3-methyl-glutaryl-coenzyme A (HMG-CoA) reductase inhibitor. It prevents the synthesis of cholesterol through the inhibition of HMG-CoA reductase, this will prevent cholesterol production. Marked reduction in total cholesterol, low-density lipoprotein cholesterol and plasma triglycerides have been seen for long term oral administration of ASN [5]. Several analytical techniques were described for the determination of AMO in bulk powder, pharmaceutical formulations and body fluids. These techniques include high-performance liquid chromatography (HPLC) with UV detection [6,7], HPLC with fluorescence detection [8], liquid chromatography coupled to single quadropole mass spectrometry (LC/MS) [9], liquid chromatography-tandem mass spectrometry (LC-MS/MS) [10,11] voltammetry [12-14] spectrofluorometry [15,16], capillary electrophoresis [16] and visible spectrophotometry [17-20]. On the other hand, analysis of atorvastatin in bulk, pharmaceutical formulations and body fluids were reported. These methods include HPLC-UV [21,22], LC/MS [23], high-performance thin-layer chromatography (HPTLC) with densitometric detection [24], potentiometry [25] and spectrophotometry [26]. Various methods have been reported for the simultaneous estimation of AMO and ASN in their combined dosage form and plasma. These methods involve HPLC [27-29], (LC-MS/MS) [30,31] spectrophotometry [32], voltammetry [33]. Amlodipine and atorvastatin were introduced in pharmaceutical dosage form to treat patients with combined hypertension and hyperlipidaemia. The combination increases the needs to develop a sensitive, accurate and simple method for simultaneous determination of each drug in pharmaceutical dosage form mixture. Another aim of the proposed work was to study the stability of AMO and ASN under stress forced degradation. To our knowledge there are no reported methods for either simultaneous determination of Amlodipine and Atorvastatin in their pharmaceutical combination, stress forced degradation nor by UPLC-MS/MS spectrometry.

Figure 1. Chemical structures of amlodipine (a), atorvastatin (b) and diphenhydramine (internal standard) (c).
Experimental
Chemicals and reagents
Amlodipine besylate and atorvastatin calcium were kindly granted from Egyptian International Pharmaceutical Industry Co. (EIPICO) (10th of Ramadan City, Sharqia, Egypt). The purities of the two drugs under study were determined using reference methods and were found to be 99.54% for amlodipine besylate [27] and 100.03% for atorvastatin calcium [21]. Diphenhydramine (IS), HPLC grade solvents (methanol and acetonitrile) and formic acid were purchased from Sigma-Aldrich, Steinheim, Germany. Pure deionized water was obtained from (ELGA, Purelab flex) water purification system. The combination of AMO and ASN formulation is Caduet 10/10 tablets were obtained from Pfizer, Egypt.
Instrumentation
An Accela U-HPLC system consisting of an Accela 1250 pump and Accela open autosampler (Thermo Scientific Corporation, USA) was used for sample and solvent delivery. A TSQ Quantum Access MAX triple stage quadrupole mass spectrometer (Thermo Scientific Corporation, USA), equipped with a heated electrospray ionization (H-ESI) source was used for the analysis of the targeted drugs. Control of the LC-MS/MS system, acquisition and analysis of data were performed using Xcalibur software version 2.2.
Chromatographic and mass spectrometric conditions
Chromatographic separation was carried out on Hypersil-Gold column (50 mm × 2.0 mm, 1.9 μm, Thermo Scientific, USA). Gradient elution was used with mobile phase consisting of 0.1% formic acid in water (solvent A) and 0.1% formic acetonitrile: water in the ratio of 95:5 (v/v) (solvent B). The elution gradient was 10% B to 90% B (0-0.7 min), keep B 90% (0.7-4 min), and gradually back to 10% B at 5 min. The total running time was 5 min with a total flow rate of 0.25 ml/ml.
The mass spectrometric conditions were optimized for each compound by continuous infusion of the standard solutions (1 μg/mL in mobile phase of each) at 10 μL/min using a Harvard infusion pump. The tandem mass spectrometer was operated in the selective reaction monitoring (SRM) mode. The vaporizer temperature was kept at 400°C and the ion-spray voltage was set at 3600 V for AMO and IS and -3000 V for ASN. The sheath gas pressure was 15 psi and the auxiliary gas was 5 psi. The Collision energies were, 31 and 14 for AMO, ASN and IS respectively.
Standard solutions
Stock standard solutions of 0.1 mg/ml for AMO, ASN and IS were prepared in methanol and stored at 4ºC. Further dilution of each stock standard solution was made using methanol to obtain the appropriate working standard solutions which were also stored at 4ºC.
Procedures
Construction of calibration curves
Standard calibration solutions were prepared from the working standard solutions of each drug. These calibration solutions contained the two drugs in the concentration ranges of (0.8-50) ng/ml for AMO and (3-50) ng/ml for AVN. Each of the calibration solutions had a concentration of 5ng/ml of IS. A volume of 10 μL of each solution was injected into the LC- MS/MS system. For each drug, a calibration curve was constructed by plotting the ratios of its peak areas to IS’s peak areas versus the corresponding concentrations.
Laboratory prepared mixtures
The working standard solutions of each of the two drugs were mixed in different ratios to obtain binary solutions of AMO and ASN in the concentration range of (0.8-50) ng/ml and (3-50) ng/ml respectively. These binary solutions were assayed following the procedure in construction of calibration curves.
Analysis of pharmaceutical dosage form
Ten tablets contain both analytes was crushed, powdered and homogenized. An accurate amount equivalent to 10 mg of both drugs was extracted with methanol filtered. Different aliquots were taken to obtain concentration range of (0.8-50) ng/ml and (3-50) ng/ml of AMO and ASN respectively. These dilutions were assayed following the procedure in construction of calibration curves.
Kinetic forced degradation
Determination of forced degradation (acidic, alkaline and oxidative) of AMO and ASN was done by using 0.1N HCl, 0.1N NaOH and 3% H2O2. For each drug 0.01 mg was dissolved in 10 ml methanol, transferred to 25 ml Volumetric flask and dilute with 0.1N HCl, 0.1N NaOH and 3% H2O2 in each case. These solutions were kept at 70°C for all except H2O2 was kept at room temperature for time intervals (0, 10, 20, 30, 40, 50, 60) min. After the specified time samples in acid and base were neutralized by adding an appropriate volume and normality of NaOH and HCl, while un reacted H2O2 was removed by sonication. The neutralized solutions were diluted with the mobile phase to obtain 25 ng/ml of each drug. The concentrations of remaining AMO and ASN at different time intervals were determined by the proposed method.
Results
Method development
The optimized SRM transitions (precursor ion m/z → product ion m/z) are: m/z 557.65 → 397.19 for ASN, 409.47 → 238.22 for AMO and 256.15 → 167.11 for IS. Under these LC-/MS/MS conditions, the retention times of AMO, ASN and IS were 2.1, 2.52 and 2.23 min, respectively. Representative LC-MS/MS chromatograms are shown in Figure 2. Optimizing the sprayer voltage is done to ensure ionization of analytes. High spray voltages may liable to discharges. Reducing spray voltages reduce interference from unwanted side reactions that may be decrease signal intensity. For obtaining good chromatographic separation and peak characteristics for the subsequent quantitative work, the selection of the mobile phase was an important factor. Chromatographic separation of the analytes was achieved with adequate retention times and peak shape using gradient elution with 0.1% formic acid in water and acetonitrile on a Hypersil gold (50 mm × 2 mm, 1.9 μm) column. Different flow rates were test and the optimum flow rate was 0.25 ml/min. with these chromatographic conditions, the peak shape was satisfactory for quantitative work even at very low concentrations (Figure 3).

Figure 2. Mass spectrum of degradation products of AMO under stressed conditions.

Figure 3. Mass spectrum of degradation products of ASN under stressed conditions.
Method validation
The validation of our method was done by following the guidelines of ICH Q2 (R1) recommendation [34].
Linearity and range
The linearity of the method was determined by analysing calibration standard samples at concentrations range of (0.8-50) ng/ml and (3-50) ng/ml for AMO and ASN respectively. The calibration curve was constructed by linear regression of the peak area ratios of each analyte to IS obtained against the corresponding concentrations using a weighting factor of 1/concentration2. Linear relationship between concentration and peak area ratio for both drugs was found. The linear regression equations are listed in (Table 1).
| Parameter | Atorvastatin | Amlodipine |
|---|---|---|
| Linearity range | (3.0-50.0) ng/ml | (0.8-50.0) ng/ml |
| Regression equation | 4.52 × 10⁻³ C + 7.00 × 10⁻³ | 0.03588*C + 0.27029 |
| Slope (b) | 4.52 × 10⁻³ | 0.036 |
| Intercept (a) | 7.00 × 10⁻³ | 0.270 |
| Correlation coefficient (r) | 0.9997 | 0.9999 |
| r2 | 0.9994 | 0.9998 |
| SE of slope | 5.508 × 10⁻⁵ | 5.719 × 10⁻⁴ |
| SE of intercept | 4.438 × 10⁻⁴ | 1.436 × 10⁻³ |
| Sy/x | 2.29 × 10⁻³ | 0.012 |
| LOD | 0.56 | 0.23 |
| LOQ | 1.7 | 0.69 |
Table 1. Linearity data for amlodipine and atorvastatin by the proposed LC-MS/MS method*.
Limit of quantitation (LOQ) and limit of detection (LOD)
The limit of detection (LOD) is the lowest concentration of analyte that can easily detected, while the limit of quantitation (LOQ) is the lowest concentration of analyte that can be quantified by the method. Calculations of LOD or LOQ were done base on standard deviation (SD) of the response and slope of calibration curve.
LOD=3.3 σ/s (s=Slope of calibration curve)
LOQ=10 σ/s (σ=SD of response)
σ could be obtained from SD of blank response, standard deviation of y-residual of the regression line (Sy/x) and SD of y-intercept of the regression line [35]. Our calculation based on SD of the intercept. The results were listed in Table 1.
Accuracy
Evaluation of the accuracy of the proposed method was made by the analysis of five concentrations of the standard solution of each drug each three times. The results of the proposed method were compared with those obtained from reference methods [27] for AMO and for ASN [21].
Statistical comparison of the performance of the proposed method with that of the reported method showed that there was no significant difference in their accuracy and precision as shown by the results of student’s t‐test and variance ratio F-test respectively (Table 2).
| Item | Amlodipine | Atorvastatin | ||
|---|---|---|---|---|
| Proposed | Reported | Proposed | Reported | |
| Mean* ± SD | 100.09 ± 0.82 | 99.54 ± 0.75 | 9.87 ± 0.96 | 100.03 ± 0.8 |
| % RSD | 0.82 | 0.75 | 0.96 | 0.8 |
| % REr | 0.37 | 0.33 | 0.43 | 0.36 |
| N | 5 | 5 | 5 | 5 |
| Variance | 0.67 | 0.56 | 0.92 | 0.64 |
| t- test (2.31) | 1.1 | 0.29 | ||
| F- test (5.409) | 1.21 | 1.47 | ||
| Intraday precision* | 99.83 ± 0.75 | 100.15 ± 0.92 | ||
| Inter-day precision* | 99.60 ± 0.93 | 100.51 ± 1.21 | ||
SD: Standard Deviation; %RSD: Per cent of Relative Standard Deviation; %REr: Per cent of Relative Standard Error; Values in parenthesis represent.
Table 2. Data of accuracy and precision obtained by the proposed method and the reported ones for the analysis of amlodipine and atorvastatin in pure form.
Precision
Evaluation of the intraday precision was made by replicate assay of the standard solutions of the studied drugs on the same day, while the inter-day precision was evaluated through replicate the assay of standard solutions of the studied drugs on three successive days (Table 2).
System suitability
System suitability used to confirm the suitability of chromatographic system for analysis with high agrees of accuracy and precision. Following the USP guidelines [36] and with concordance with the parameters value [37]. The suitability of method was achieved by adopting the quantitation of analytes with external method, linearity between the concentrations of analytes in the range of (3-50) ng/mL and (0.8-50) ng/mL for AMO and ASN respectively. The peak area of analyte was obtained. The concentration of AMO and ASN were obtained from the following equation:
AMO Y=0.0358*C+0.2702 r2=0.999
ASN Y=4.52 × 10⁻³ C+7.00 × 10⁻³ r2=0.999
Where C is the concentration of each drug in ng/ml and Y is the area ratio between drug and IS. Testing of system suitability of the proposed method indicates passing the test as showed in Table 3.
| Compound | RT(min) | Capacityfactor(K) | Selectivity (a) | Resolution (Rs) | Tailing factor | Theoretical plates | HETP |
|---|---|---|---|---|---|---|---|
| AMO | 2.13 | 4.81 | - | - | 1.04 | 3060 | 0.008 |
| ASN | 2.46 | 5.71 | 1.18 | 1.27 | 1.05 | 2170 | 0.023 |
Table 3. Results of system suitability of the proposed method.
Robustness of the method
The robustness of an analytical method measures the capacity of it to restrain minute but deliberate changes in method parameters [38]. Evaluation of the robustness of the proposed method was done for the chromatographic as well as, the mass parameters, e.g., flow rate of mobile phase (± 10 μL/min), vaporizer temperature or transfer capillary temperature (± 5°C), collision energy (± 2 V) and sheath gas pressure (± 5 psi) did not show significant changes in the values of peak areas.
Application of the proposed method
The proposed method was applied to analysis laboratory mixture of AMO and ASN in different proportions. Satisfactory results were obtained and listed in Table 3. Caduet 10/10 Tablets were analysed using our proposed LC-MS/MS method to demonstrate its efficiency in the analysis of AMO and ASN in pharmaceutical dosage form for quality control testing. The concentration of each drug was calculated using the corresponding regression equation that was obtained from the proposed method. SRM mode for the detection produce high degree of selectivity as it measured only specified the product ion from specified parent ion. To validate the application on pharmaceutical dosage form standard addition technique was applied [39]. The results were listed in Tables 4 and 5.
| Concentration(ng/mL) | %Recovery* | ||
|---|---|---|---|
| Amlodipine | Atorvastatin | Amlodipine | Atorvastatin |
| 5 | 10 | 100.74 | 99.56 |
| 10 | 20 | 99.14 | 100.67 |
| 25 | 15 | 100.64 | 98.82 |
| 30 | 30 | 100.40 | 101.03 |
| 50 | 25 | 99.37 | 99.12 |
| 20 | 50 | 99.46 | 98.23 |
| Mean ± SD | 99.96±0.71 | 99.57±1.09 | |
| %RSD | 0.71 | 1.09 | |
| %RSE | 0.29 | 0.44 | |
| Variance | 0.50 | 1.19 | |
*Average of three different determinations.
Table 4. Determination of amlodipine and atorvastatin in laboratory prepared mixtures by the proposed method.
| Item | Taken Concentration (ng/mL) | Added Concentration (ng/mL) | %Recovery* | |||
|---|---|---|---|---|---|---|
| Amlodipine | Atorvastatin | Amlodipine | Atorvastatin | Amlodipine | Atorvastatin | |
| 15 | 15 | 10 | 10 | 98.86 | 99.56 | |
| 15 | 15 | 99.17 | 98.82 | |||
| 20 | 20 | 99.46 | 98.45 | |||
| 25 | 25 | 100.41 | 99.12 | |||
| 30 | 30 | 97.89 | 98.08 | |||
| 32 | 32 | 99.44 | 100.94 | |||
| Mean ± SD | 97.24±0.39 | 97.84±0.85 | 99.21±0.83 | 99.16±1.01 | ||
| %RSD | 0.40 | 0.87 | 0.84 | 1.02 | ||
| %Rer | 0.24 | 0.50 | 0.34 | 0.41 | ||
| Variance | 0.15 | 0.72 | 0.69 | 1.02 | ||
SD=Standard Deviation; %RSD = Per cent of Relative Standard Deviation; %REr = Per cent of Relative Standard Error; Values in parenthesis are the theoretical values of t and F at P=0.05 [31]. *Average of three different determinations.
Table 5. Assay of amlodipine and atorvastatin in their combined tablets using standard addition technique.
Kinetic forced degradation
The degradation of pharmaceutical products during storage occurred by different rates. These reactions were affected by different conditions such as temperature, pH of solution, light, oxidation. The orders of these degradations depend on relations between changes in concentration by time. The degradation of most pharmaceuticals follow zero order, first order or pseudo first-order [40]. Because of AMO and ASN were place with a large volume of regents, the degradation of both drugs were showed pseudo-first-order kinetics [41]. Pseudo-first-order is obtained in case of presence of two reactants in different ratio so that any change in concentration of major reactant (acid or base, peroxide) will be negligible in comparison to change in concentration of minor reactant (drug). Plotting of log % remaining concentration against time, to evaluate the kinetic degradation parameters of each drug in acidic, alkaline and oxidative conditions were done. Rate constant (K), time left for 50% potency (t1/2) and time left for 90% potency (t90) for each forced condition were obtained from the following equations [42].
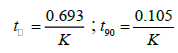
The results of degradation kinetic parameters were shown in Table 6.
| AMO | ASN | |||||
|---|---|---|---|---|---|---|
| Items | Acid | Alkaline | Peroxide | Acid | Alkaline | Peroxide |
| r2 | 0.9503 | 0.9023 | 0.984 | 0.897 | 0.9188 | 0.9186 |
| K(ng/ml)min-1 | -0.015 | -0.0065 | -0.014 | -0.008 | -0.026 | -0.006 |
| t1/2(min) | 47.14 | 106.14 | 49.96 | 86.52 | 26.22 | 123.00 |
| t0.9(min) | 7.14 | 16.08 | 7.57 | 13.11 | 3.97 | 18.64 |
Table 6. Summary of degradation Kinetic parameters for Pseudo-first order reaction.
Identification of degradation products
The degradation products of AMO and ASN in acid, base and peroxides are identified by LC-MS. For AMO the Q1 scan of these products identified as major products and have m/z as 407.32, 208.13 and 163.19.
Discussion
Optimization of mass and chromatographic parameters depend on the structure of compounds. The presence of acidic moiety in ASN and basic moiety in AMO and IS enhance the ionization of ASN in negative mode in the form of [M-H]- and positive mode in the form of [M+H]+ in case of AMO and IS. The protonated and deprotonated form were dominated in the Q1 scan, and were used as precursor ions to obtain Q3 product ion spectra (Figure 4). The ion suppression effect produced by the matrix was minimized by optimization of spray voltage to be 3600 V for AMO and IS and 3000 V for ASN. Forced degradations were carried under mild conditions of acid, alkali and peroxide. Degradation product m/z=407.32 was formed in presence of oxidizing agent e.g., peroxide due to aromatization of the, 4-dihydro pyridine to pyridine [43]. The other 2 degradation products are formed in acidic and alkaline medium. The structures were predicted by mechanisms of their formation and confirmed by the reported data [44,45]. Identification of ASN degradation products by LC-MS was revealed that m/z=521.17 was formed in acidic and alkaline medium due to lactone formation, followed by elimination of one molecule of water to form anhydro ASN lactone. While hydrolysis of amide with elimination of aniline in acidic and alkaline medium produce m/z=464.62. In case of oxidative degradation of ASN the side chain was removed from ASN to produce m/z=397.87. The structures were predicted by mechanisms of their formation and confirmed by the reported data [46].

Figure 4. Representative extracted ion chromatogram (XIC) calibration standards of the analytes at Upper limit of quantification (ULOQ).
Conclusion
In summary we developed and validated a new UPLC-MS/MS method for simultaneous determination of amlodipine and atorvastatin in bulk and pharmaceutical dosage form. The method is simple, rapid, selective and sensitive. The validity of method supports its suitability for the routine analysis and quality control testing of amlodipine and atorvastatin in pharmaceutical dosage forms. The stability of both drugs in acidic, alkaline and oxidative medium revealed that both AMO and ASN are rapidly degraded in the tested mediums. The degradations of both follow pseudo – first order kinetics. The t1/2 values of AMO and ASN in the tested medium are decreases in the following order acidic, oxidative and alkaline and alkaline, acid and oxidative mediums for AMO and ASN respectively. Identification of some of the degradation products of AMO and ASN was done by LC-MS.
Authors’ Contributions
The first and second authors contributed equally for this work
References
- Koh KK, Quon MJ, Han SH, et al. Additive beneficial effects of atorvastatin combined with amlodipine in patients with mild-to-moderate hypertension. Int J Cardiol. 2011;146(3):319-25.
- Jukema JW, van der Hoorn JW. Amlodipine and atorvastatin in atherosclerosis: a review of the potential of combination therapy. Expert Opin Pharmacother. 2004;5(2):459-68.
- Wilson JH, Gisvold's. Organic Medicinal and Pharmaceutical Chemistry. 12th ed. Beale JM, Block JH, editors.New York: Lippincott Williams and Wilkins; 2010.
- Khan MG. Cardiac Drug Therapy. New York: Humana Press Inc.; 2007.
- Lea AP, McTavish D. Atorvastatin. A review of its pharmacology and therapeutic potential in the management of hyperlipidaemias. Drugs. 1997;53(5):828-47.
- Zarghi A, Foroutan SM, Shafaati A, et al. Validated HPLC method for determination of amlodipine in human plasma and its application to pharmacokinetic studies. Farmaco. 2005;60(9):789-92.
- Bagyalakshmi J, Philip SM,Ravi T. Development and optimization of RP-HPLC method for the estimation of s (-) amlodipine in Tablet dosage form. Der Pharma Chemica. 2011;3(4):140-5.
- Bahrami G, Mirzaeei SH. Simple and rapid HPLC method for determination of amlodipine in human serum with fluorescence detection and its use in pharmacokinetic studies. J Pharm Biomed Anal. 2004;36(1):163-8.
- Zou Q, Zhan Y, Ge Z, et al. Liquid chromatography-mass spectrometry method for the determination of amlodipine in human plasma and its application in a bioequivalence study. Arzneimittelforschung. 2009;59(8):383-91.
- Bathula SNP, Devani KP. Quantitative Determination of Amlodipine in Human Plasma By Ultra Performance Liquid Chromatography- Electro Spray Ionization Mass Spectrometry: Application To A Clinical Pharmacokinetic Study. Asian JPharmaClinRes. 2012;5(Suppl 1):89-93.
- Shentu J, Fu L, Zhou H, et al. Determination of amlodipine in human plasma using automated online solid-phase extraction HPLC-tandem mass spectrometry: application to a bioequivalence study of Chinese volunteers. J Pharm Biomed Anal. 2012;70:614-8.
- Kazemipour M, Ansari M, Mohammadi A, et al. Use of adsorptive square-wave anodic stripping voltammetry at carbon paste electrode for the determination of amlodipine besylate in pharmaceutical preparations. J Analyt Chem. 2009;64(1):65-70.
- Goyal RN, Bishnoi S. Voltammetric determination of amlodipine besylate in human urine and pharmaceuticals. Bioelectrochemistry. 2010;79(2):234-40.
- Stoiljkovi Z, Avramov Ivi M, Petrovi S, et al. Voltammetric and Square-Wave Anodic StrippingDetermination ofAmlodipine Besylate on Gold Electrode. IntJElectrochemSci. 2012;7:2288-303.
- Abdel-Wadood HM, Mohamed NA, Mahmoud AM. Validated spectrofluorometric methods for determination of amlodipine besylate in Tablets. Spectrochim Acta A Mol Biomol Spectrosc. 2008;70(3):564-70.
- Mikus P, Maráková K, Valásková I, et al. Determination of amlodipine enantiomers in pharmaceuticals using capillary electrophoresis separation and diode array detection. Pharmazie. 2009;64(2):76-9.
- Gohil K, Trivedi P, Molvi K. Spectrophotometric Analysis of Amlodioine Besylate in Bulk and in Tablet Dosage Forms. Ind J Pharma Sci. 2005;6:376-8.
- Shama SA, Amin AS, Mabrouk ESM, et al. Utility of Oxidation-Reduction Reaction for the Spectrophotometric Determination of Amlodipine Besylate. ArabJChem. 2009;2(1):95-102.
- Almani F, Rind FMA, Memon AH, Mughal UR, Laghari MGH, Memon N, et al. Spectrophotometric Determination of Amlodipine Besylate Using 2-Hydroxynaphthaldehyde as a Derivatizing Reagent. Asian JChem. 2010;22(2):1205-13.
- Aswini GL, Dhachinamoorthi D, Rao JVLNS, et al. Visible Spectrophotometric Determination of Amlodipine Besylate in Bulk Drug and Tablet Dosage Form. Res J Pharm Tech. 2011;9(4):1432-5.
- Mustafa G, Azeem A, Ahmad FJ, et al. Stability-indicating RP-HPLC method for analysis of atorvastatin in bulk drug, marketed tablet and nanoemulsion formulation. JChilean ChemSoc. 2010;55(2):184-8.
- Ma XT, He H, Liu TB. Chinese Journal of New Drugs. 2011;024.
- Ma L, Dong J, Chen X, et al. Development and Validation of Atorvastatin by LC–ESI–MS and Application in Bioequivalence Research in Healthy Chinese Volunteers. Chromatographia. 2007;65(11):737-41.
- Shirkhedkar AA, Surana SJ. Development and validation of a reversed-phase high-performance thin-layer chromatography-densitometric method for determination of atorvastatin calcium in bulk drug and tablets. J AOAC Int. 2010;93(3):798-803.
- Saber AL. A PVC Membrane Sensor for Potentiometric Determination of Atorvastatin in Biological Samples and Pharmaceutical Preparations. Electroanalysis. 2013;25(12):2707-14.
- Wani TA, Khalil NY, Abdel-Rahman HM, et al. Novel microwell-based spectrophotometric assay for determination of atorvastatin calcium in its pharmaceutical formulations. Chem Cent J. 2011;5(1):57.
- Mohammadi A, Rezanour N, Ansari Dogaheh M, et al. A stability-indicating high performance liquid chromatographic (HPLC) assay for the simultaneous determination of atorvastatin and amlodipine in commercial tablets. J Chromatogr B Analyt Technol Biomed Life Sci. 2007;846(1-2):215-21.
- Hefnawy MM, Sultan M, Al-Johar H. Development of Capillary Electrophoresis Technique for Simultaneous Measurement of Amlodipine and Atorvastatin from Their Combination Drug Formulations. J Liq Chromatogr Relat Technol. 2009;32(20):2923-2942.
- Hafez HM, Abdullah AE, Abdelaziz LM, et al. Quantitative Determination of Amlodipine Besylate, Losartan Potassium, Valsartan and Atorvastatin Calcium by HPLC in their Pharmaceutical Formulations.J Chromatograph Separat Techniq. 2014;5(3):226.
- Yu Q, Hu ZY, Zhu FY, et al. HPLC–MS–MS for the Simultaneous Determination of Atorvastatin and Amlodipine in Plasma of Hypertensive Patients. Chromatographia. 2011;73(3):257-62.
- Pilli NR, Inamadugu JK, Mullangi R, et al. Simultaneous determination of atorvastatin, amlodipine, ramipril and benazepril in human plasma by LC-MS/MS and its application to a human pharmacokinetic study. Biomed Chromatogr. 2011;25(4):439-49.
- Darwish HW, Hassan SA, Salem MY, et al. Three different spectrophotometric methods manipulating ratio spectra for determination of binary mixture of Amlodipine and Atorvastatin. Spectrochim Acta A Mol Biomol Spectrosc. 2011;83(1):140-8.
- Topal BD, Bozal B, Demircigil BT, et al. Electroanalytical Studies and Simultaneous Determination of Amlodipine Besylate and Atorvastatine Calcium in Binary Mixtures Using First Derivative of the Ratio-Voltammetric Methods. Electroanalysis. 2009;21(22):2427-39.
- Suhara Y, Kamao M, Tsugawa N, et al. Method for the determination of vitamin K homologues in human plasma using high-performance liquid chromatography-tandem mass spectrometry. Anal Chem. 2005;77(3):757-63.
- Shrivastava A, Gupta V. Methods for the determination of limit of detection and limit of quantitation of the analytical methods. Chronicles of Young Scientists. 2011;2(1):21-5.
- USPharmacopeia. USP 35-NF 30. Rockville: The United States Pharmacopeial Convention;2012.
- Adamovics JA. Chromatographic analysis of pharmaceuticals. New York: Marcel Dekker Inc.;1997.
- Validation of Analytical Procedures: Text and Methodology. International Conference on Harmonisation (ICH) of Technical Requirements for Registration of Pharmaceuticals for Human Use.
- Harris DC. Quantitative Chemical Analysis. New York: WH Freeman;2003.
- Görög S. Drug safety, drug quality, drug analysis. J Pharm Biomed Anal. 2008;48(2):247-53.
- FlorenceAT, AttwoodD. Physicochemical Principles of Pharmacy. 3rd ed. London: Macmillan Press;1998.
- Connors KA, Amidon GL, Stella VL. Chemical Stability of Pharmaceuticals: A Handbook for Pharmacists. 2nd ed. New York: Wiley-Blackwell;1986.
- Hashemi MM, Ahmadibeni Y, Ghafuri H. Aromatization of Hantzsch 1,4-Dihydropyridines by Hydrogen Peroxide in the Presence of Cobalt(II) Acetate. Monatshefte für Chemie. 2003;134(1):107-10.
- Murakami T, Fukutsu N, Kondo J, et al. Application of liquid chromatography-two-dimensional nuclear magnetic resonance spectroscopy using pre-concentration column trapping and liquid chromatography-mass spectrometry for the identification of degradation products in stressed commercial amlodipine maleate tablets. J Chromatogr A. 2008;1181(1-2):67-76.
- Tiwari RN, Shah N, Bhalani V, et al. LC, MSn and LC-MS/MS studies for the characterization of degradation products of amlodipine. JPharmaAnal. 2015;5(1):33-42.
- Shah RP, Kumar V, Singh S. Liquid chromatography/mass spectrometric studies on atorvastatin and its stress degradation products. Rapid Commun Mass Spectrom. 2008;22(5):613-22.