Original Article
, Volume: 13( 1)Biosynthesis of Silver Nanoparticles Using Peel Extract of Raphanus sativus L.
- *Correspondence:
- Al-Mashhedy LAM , Department of Chemistry, College of Science, Babylon University, Babylon, Iraq, Tel: 030-249551; E-mail: dr.lamia71@yahoo.com
Received: November 11, 2016; Accepted: December 26, 2016; Published: January 02, 2017
Citation: Fadel QJ, Al-Mashhedy LAM. Biosynthesis of Silver Nanoparticles Using Peel Extract of Raphanus sativus L. Biotechnol Ind J.2017;13(1):120.
Abstract
In present study, Silver nanoparticles (AgNPs) were synthesized using peel Raphanus sativus L extract that acts as a reducing and stabilizing agent. The AgNPs formation was observed as a color change of the mixture from red to dark-brownish we have developed a green synthetic method for silver nanoparticles using peel of R. sativus extract. Silver Nanoparticle prepared were characterized by using UV–visible spectroscopy, Scanning electron microscopy(SEM), X-ray diffraction (XRD) and Dynamic light scattering (DLS). The best Condition of experiments includes temperature 50°C, pH 9, time 0.5 h, sliver nitrate concentration 1 mM and mixing ratio of the reactant on sliver nanoparticles synthesis 5:95. The AgNPs showed surface plasmon resonance at 430 nm, size ranges from 34 nm to 50 nm determined by using a laser particle size analyzer (DLS).
Keywords
Peel of Raphanus sativus L; Silver nanoparticles AgNPs; X-ray diffraction (XRD); Scanning electron microscopy (SEM); Dynamic light scattering (DLS)
Introduction
Nanoparticles can be prepared by different approaches like chemical and photochemical reactions, thermal decomposition, electrochemical [1] and also by biological methods. The chemical methods expended for the synthesis of nanoparticles are too expensive and involve the use of toxic, dangerous chemicals that are responsible for various biological risks [2]. As easily as the synthesis of nanoparticles utilizing plants or veggies and their selections can be advantageous to another synthesis. The vegetable itself acts as a reducing and capping agent within the synthesis method [3,4].
In the present investigation the peel of Raphanus sativus. L (Radish) was used to synthesize the silver nanoparticle. The radish is an eaten root vegetable of the cruciferae family. It is originally from Europe and Asia [5]. It contains many important vegetables of economic importance. The aqueous extract of the roots showed antimutagenic activity against Salmonella typhimurium TA98 and TA100 [6]. In the past few years, there has been an increasing interest in silver nanoparticles on account of the antimicrobial properties that they display [7]. They are even being projected as future generation antimicrobial agents [8]. Use of plants to synthesize the silver nanoparticle will provide an enhanced platform and it is free from toxic chemicals and provides natural capping agents [9]. Moreover, use of plant extracts also reduces the cost of microorganism’s isolation and culture media enhancing the cost competitive feasibility over nanoparticles synthesis by microorganisms [10]. The synthesis of sliver nanoparticals was characterized silver nano particles (AgNps) have received enormous attention of the researchers due to their extraordinary defense against a wide range of microorganisms and also due to the appearance of drug resistance against commonly used antibiotics [11]. Its application in various fields like biomedical [12], drug delivery [13], water treatment [14], agriculture etc. [15]. The synthesis of silver nanoparticles were characterized using UV-Visible spectrophotometer, XRD, SEM, and DLS [16].
Experiment
Collection of the plant
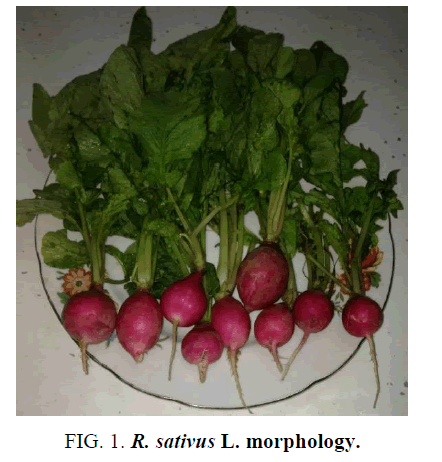
Peel of R. sativus were collected from local markets, Babylon city – Iraq roots of Raphanus sativus. L washed in taped water and then removed the nutshell from roots, dried in shade at room temperature for 7 days, grinding in blender then become powder. Figure. 1 shows the plant of R. sativus L.
Preparation of R. sativus extract
One gram of peel R. sativus. L dissolved in 100 ml deionized water at room temperature and shaking by a magnetic stirrer for one hour. The aqueous cold extract was filtered using filter paper. The filtered extract was stored in the refrigerator to use.
Synthesis of silver nanoparticles
Silver nitrate aqueous solution (1 mM) was prepared and used for synthesis of silver nanoparticles. 5 ml of aqueous extract of Raphanus sativus. L was added to 95 ml of aqueous solution of 1 mM AgNO3 and heated with stirrer at 50°C for 30 min.
Optimization of the synthesis of Ag nanoparticles
The synthesis was carried out at different temperatures (30°C, 40°C, 50°C and 60°C). To examine the optimal time for the synthesis of silver nanoparticles, the reaction mixture was monitored from 0 to 35 min. In addition, the effect of volume was monitored by varying the volume ratio of AgNO3 to R. sativus root extract. The concentrations of reacting AgNO3 to peel extract aqueous of R. sativus ranged from 0.25 Mm to 3 mM, pH (4, 6, 8, 9, 11) and the ratio of mixing (10:90, 5:95, 2.5:97.5, 1:99 and 0.5:99.5). The electronic absorption spectra of the silver nanoparticles under each reaction condition were recorded by UV-Visible spectrophotometry. The pH was adjusted by using 0.1 N HNO3 and 0.1 N NaOH.
Characterization of silver nanoparticles
The bioreduction of the Ag+ to AgO was monitored using (PD-303 UV) at different wavelength (200 nm to 800 nm). The crystallinity of the silver nanoparticles was examined using an X-ray Diffraction meter with Shimadzu XRD-6000 AS (3K. NOPC) after cooling centrifuge 6000 rpm for 15 min.
Moreover characterization was done by Scanning Electron Microscope (SEM). It is a type of electron microscope that images a sample by scanning it with a beam of electrons in a raster scan pattern. The electrons interact with the molecules that form up the sample producing signals that carry information about the samples surface topography and composition. SEM measurement was performed on INSPECT S50 FEI company and Dynamic light scattering (DLS) is an important technique used to investigate the size distribution pattern and average particle size of the biosynthesis AgNPs present in suspension or solution [17]. The prepared sample was dispersed in deionized water followed by ultrasonication. Dynamic light scattering (DLS) measurements were carried out on ABT-9000 Nano particle size analyzer.
Results and Discussion
Characterization of silver nanoparticles
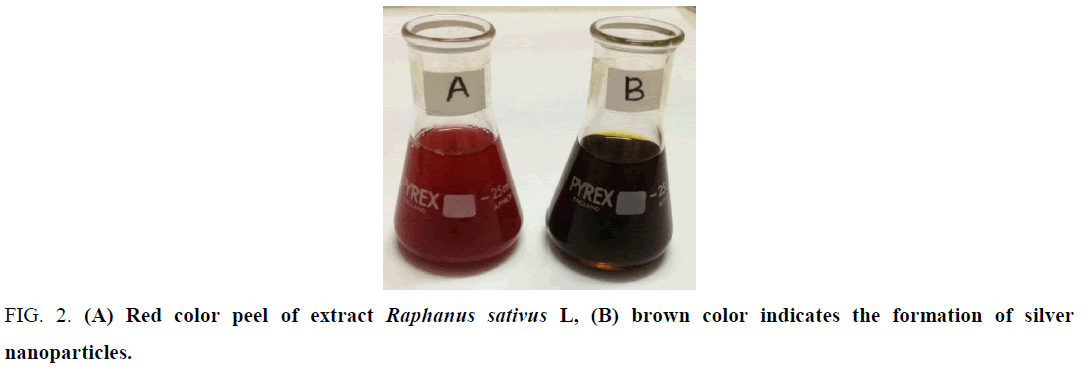
Color change: AgNPs were successfully synthesis from the aqueous silver nitrate solution using R. sativus color reaction indicates to formation of AgNPs. The color was changed from crimson to dark brown (Figure. 2)after 30 min. This color change indicates the formation of AgNPs [18].
Figure 2: (A) Red color peel of extract Raphanus sativus L, (B) brown color indicates the formation of silver nanoparticles.
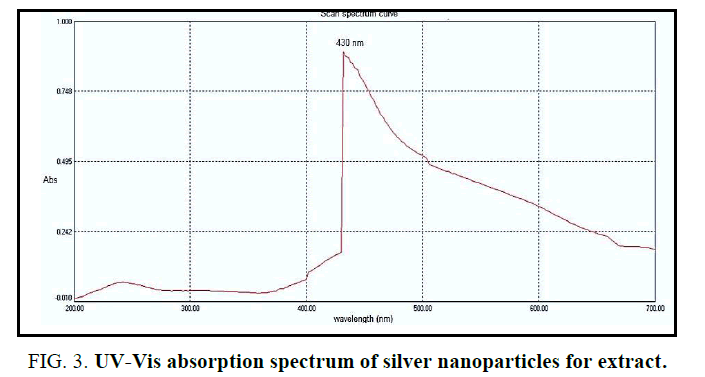
UV-Visible spectral analysis: UV-VIS spectroscopy almost used to detect the presence of AgNPs through green syntheses [19,20]. In particular, absorbance in the range of 420 nm to 450 nm has been used as an indicator to confirm the reduction of Ag+ to metallic AgO [19,21]. Figure 3 shows the UV absorption spectra of the synthesized AgNPs using an extract of R. sativus roots. The redaction of AgNO3 into NPs was showing an absorbance sharp peak at around 430 nm with high absorbance which is very specific of silver nanoparticles.
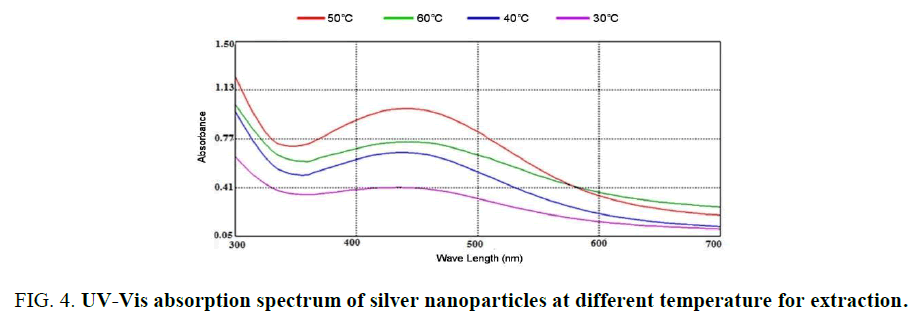
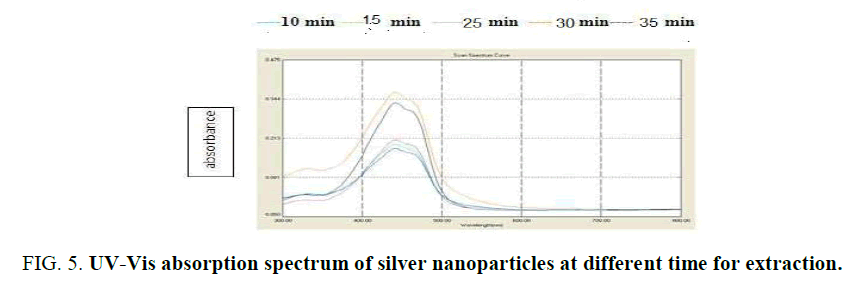
Influence of temperature and time: The graphs (Figure 4) showed the UV–Vis absorption of silver nanoparticles obtained from peel R. sativus extract. The spectra were recorded at 30°C, 50°C and 60°C with varying reaction time. In this temperature used colored of nanoparticles change from crimson to dark brown with 15-30 min (Figure. 5). The reaction was monitored for 0.5 h using UV–Visible spectrophotometer. It was discovered that the absorption intensity increased with an increase in the response time. These properties of nanoparticles due to agitation of surface plasmon vibration in silver nanoparticles synthesis [22]. Temperature from 30°C, 50°C and 60°C as used nanoparticles decreased [23], formation of silver nanoparticles at 30°C has confirmed the ability of R. sativus aqueous extract to reduce silver ion and stability it. The initial of silver nanoparticles formation was faster at 30°C, the synthesis at higher temperature 50°C and observed in 30°C.
Figure 4: UV-Vis absorption spectrum of silver nanoparticles at different temperature for extraction.
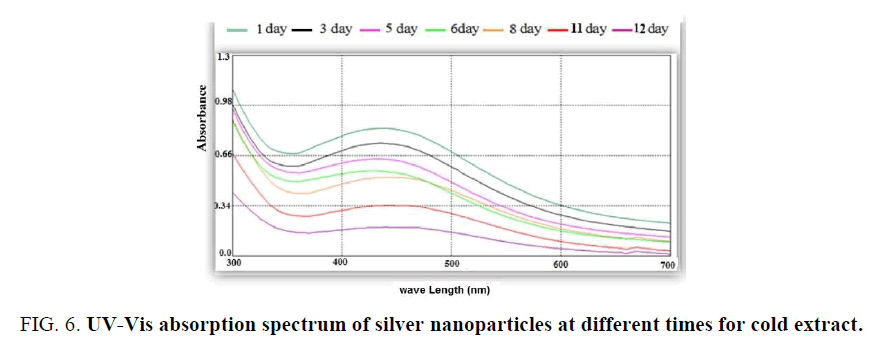
The absorbance decrease when increase the time of storage and the intensity of color increase after 1-2 days of storage [24]. The effect of time of storage is shown in Figure. 6.
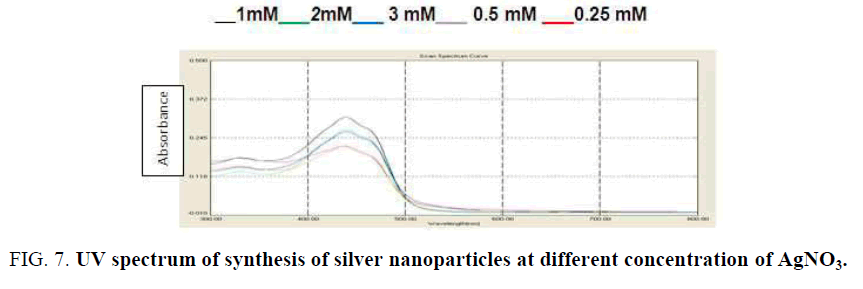
Influence of silver ion concentration variation: Figure 7 shows the effect of silver nitrate concentration in the silver nanoparticles synthesis by using peel of R. sativus extract. In this study, it was found the intensity increases as the concentration of silver ion increases with the peak in all the different concentrations (0.25 Mm to 1 mM) at 430 nm. The increase in particle size at higher concentrations gave rise to increase in the intensity of the spectrum [25].
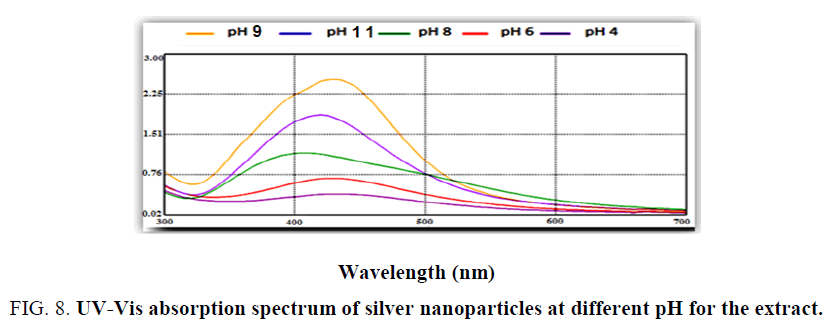
Effect of pH: Research study includes the issue of pH on nanoparticles biosynthesis at five different pHs (4, 6, 8, 9, 11). Effect of pH described by using UV-Visible spectrophotometer spectra, as shown in Figure. 8 pH 4 and 6 exhibited flat absorption spectra or there is no spectral photometry peak was formed at acidic condition it refer that no biosynthesis of silver nanoparticles [26] and from the Figure. 8 observed when pH of the mixture increase or covert to alkaline it become more suitable to biosynthesis of sliver nanoparticles. Higher peak shown at pH 9 [27]. The explanation for the alkaline case to be suitable it would be because alkaline hydroxide gets deposited on sliver nanoparticles and this agreed with Oza et al. [28].
PH capping agents, reducing particles and this also agree with sathishkunub et al. [29] observed small and stable nanoparticles at alkaline pH.
Wavelength (nm)
Effect of volume ratio silver nitrate and R. sativus extract: The benefit of change in volume of silver nitrate to R. sativus aqueous roots extract was exhibited (Figure. 9). The reaction has been done at the optimum temperature and time. Different volume ratios varied from 10:90, 5:95, 2.5:97.5, 1:99 and 0.5:99.5 of 1 mM silver nitrate to R. sativus aqueous root extract, respectively, were used. From the UV–Vis spectrum (Figure 3b), it was observed that at 0.5 parts of 1 mM silver nitrate solution to 95.5 part of R. sativus aqueous roots extract (0.5:95.5) [30], the roots extract reduced and stabilized the nanoparticles with the plasmon resonance at 430 nm. Other volume ratios used did not give more variable characteristics SPR for silver nanoparticles at the visible region of the UV–Vis spectrum Figure 9.
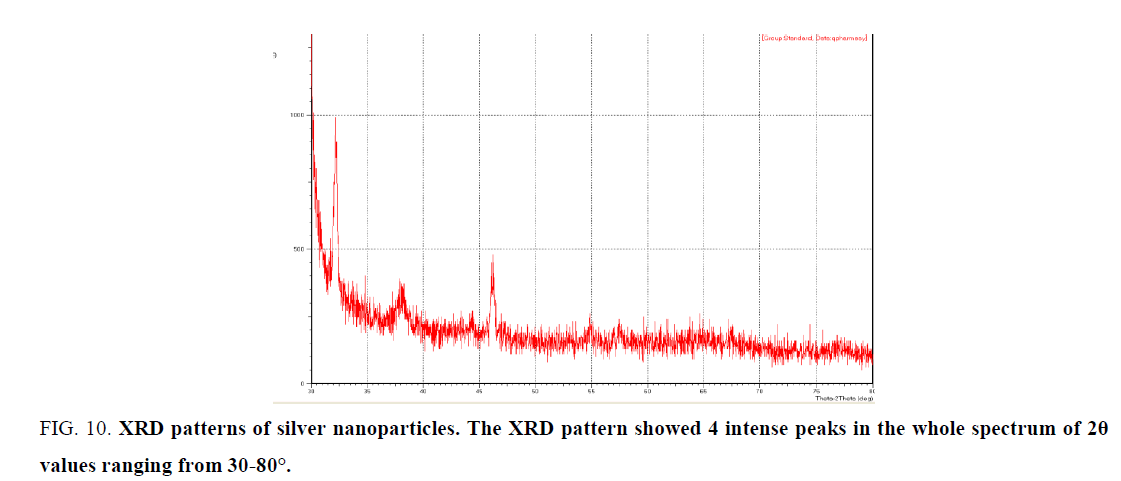
X- Ray diffraction (XRD) analysis: XRD pattern was obtained for silver nanoparticles (Figure. 10) shows a characteristic peak (at 2θ = 37.27°, 46.31°, 55.44° and 76.23°).
Figure 10: XRD patterns of silver nanoparticles. The XRD pattern showed 4 intense peaks in the whole spectrum of 2θ values ranging from 30-80°.
Analysis through Energy dispersive X-ray (EDX) spectrometer confirmed the presence of the elemental signal of the silver and homogenous distribution of silver nanoparticles (Figure. 10). The vertical axis displays the number of X-ray counts while the horizontal axis displays energy in Kev. Identification lines for the major emission energies for Ag were displayed and these correspond to peaks in the spectrum, thus giving confirmation that silver has been correctly identified and present in the solution [31]. The extra diffraction sharp first peak in the XRD pattern is due to the crystallization of bioorganic phase in the plant extract [32,33].
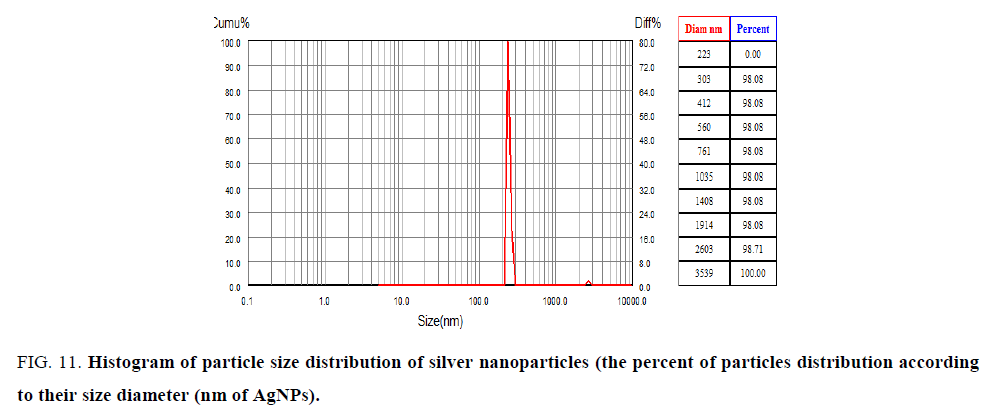
Dynamic light scattering (DLS) analysis: Particle size can be determined by measuring the random changes in the intensity of light scattered from solution, DLS is most commonly used to analyze nanoparticles.
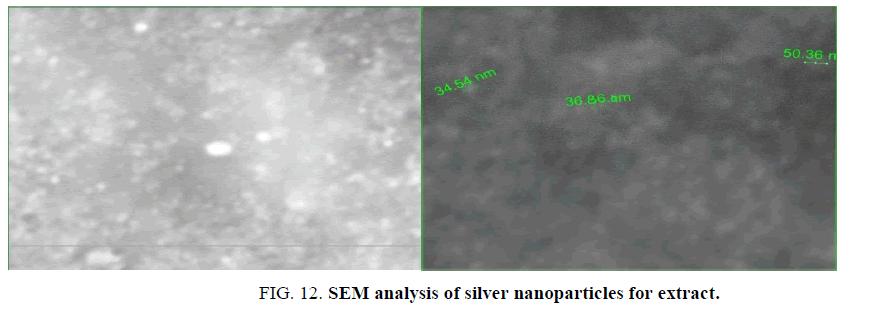
Scanning electron microscope analysis (SEM): The morphology of synthesized nanoparticles was tested by using (SEM) Scanning Electron Microscopic analysis measure size shape and distribution of green synthesized silver nanoparticles. Figure. 11 showed type of the size of particles is spherical in shape, ranged 34 nm to 50 nm. The big size in nanoparticles was explained the accumulation of these particles is a result of presence cell components of surface of nanoparticles act as covering its [34,35]. SEM image explains interaction between bioorganic covering molecule bond to AgNPs [36], stabilization of nanoparticles due to covering agent [32] (Figure. 12).
Figure 11: Histogram of particle size distribution of silver nanoparticles (the percent of particles distribution according to their size diameter (nm of AgNPs).
Conclusion
Green chemistry approach towards the synthesis of nanoparticles has many advantages such as, ease with which the process can be scaled up and economic viability. We have developed a fast, ecofriendly and convenient method for the synthesis of silver nanoparticles from peel R. sativus extract with a diameter range of 34 nm to 50 nm. These particles are mono dispersed and spherical. A color change occurs due to surface plasmon resonance during the reaction with the ingredients present in the plant root extract resulted in the formation of silver nanoparticles, which is confirmed by UV–VIS, XRD, SEM and DLS, having an average mean size of 34 nm to 50 nm had FCC structure. Green synthesis provides an economic, eco- friendly, and clean synthesis root to AgNPs.
References
- Maribel GG, Jean D, Stephan G. Synthesis of silver nanoparticles by chemical reduction method and their antibacterial activity. International Journal of Chemical and Biological Engineering. 2009;2(3):104-111.
- HuyTran Q, Nguyen V, Le A. Silver nanoparticles: synthesis, properties, toxicology, applications, and perspectives. Nat SciNanosciNanotechnol. 2013;4(3):20.
- Geoprincy G, VidhyaSrri B, Poonguzhali U, et al. A review on green synthesis of silver nanoparticles.Asian J Pharm Clin Res. 2013;6(1):8-12.
- koyyati R, Bunagati V, Dermerugu R, et al. Biological synthesis of silver nanoparticles using Raphanussativus var. longipinnatus leaf extract and evaluation of their antioxidant and antibacterial activity. International Journal of Medicine and Pharmaceutical Sciences. 2013;3(4):89-100.
- Jain D, Kumar DH, Kachhwaha S, et al. Synthesis of plant-mediated silver nanoparticles using papaya fruit extract and evaluation of their anti-microbial activities. Dig J Nanomat Bios. 2009;4:557-63.
- Gutiérrez RMP, Perez RL. Raphanussativus (Radish): Their chemistry and biology. The Scientific World Journal. 2004;4:811-37.
- Choi O, Deng KK, Kim NJ, et al. The inhibitory effects of silver nanoparticles, silver ions, and silver chloride colloids on microbial growth. Water Resour. 2008;42(12):3066-74.
- Rai M, Yadav A, Gade A. Silver nanoparticles as a new generation of antimicrobials. Biotechnol Adv. 2009;27:76-83.
- Haytham MM. Ibrahim M. Green synthesis and characterization of silver nanoparticles using banana peel extract and their antimicrobial activity against representative microorganisms. J Radiat Res Appl Sci. 2015;8(3):265-75
- Garima S, Rijn B, Kunal K, et al. Biosynthesis of silver nanoparticles using Ocimum sanctum (Tulsi) leaf extract and screening its antimicrobial activity. J Nanopart Res. 2011;13(7):2981-8.
- Sharma VK, Yngard RA, Lin Y. Silver nanoparticles: Green synthesis and their antimicrobial activities. Adv Colloid Interface Sci. 2009;145:83.
- Chaloupka K, Malam Y, Seifalian AM. Nanosilver as a new generation of nanoproduct in biomedical applications. Trends in Bioethanology. 2010;28:580-8.
- Prow TW, Grice JE, Lin LL, et al. Nanoparticles and microparticles for skin drug delivery. Adv Drug Delivery Rev. 2011;63:470-91.
- Dankovich, TA, Gray DG. Bactericidal paper impregnated with silver nanoparticles for point-of-use water treatment. Environ Sci Technol. 2011;45:1992-98.
- Nair R, Varghese SH, Nair BG, et al. Nanoparticulatematerial delivery to plants. Plant Science. 2010;179:154-63.
- Boca SC, Potara M, Gabudean AM, et al. Chitosan-coated triangular silver nanoparticles as a novel class of biocompatible highly effective photochemical transducers for in vitro cancer cell therapy. Cancer. 2011;311(2):131-40.
- Samir AA, Kalpesh BI. Plant mediated synthesis of silver nanoparticles by using dried stem powder of Tinosporacordifolia, Itsantibacterial activity and comparison with antibiotics. International Journal of Pharma and Bio Sciences. 2013;4:849-63.
- Karuppiah M, Rajmohan R. Green synthesis of silver nanoparticles using Ixoracoccinea leaves extract. Mater Lett. 2013;97:141-3.
- Philip D. Green synthesis of gold and silver nanoparticles using Hibiscus rosasinensis. Physica E: Low-Dimensional Systems and Nanostructures. 2010;42(5):1417-24.
- Chunfa D, Kui Z, Xianglin Z, et al.Semen cassiae extractmediated novel route for the preparation of silver nanoparticles. Mater Lett. 2014;120:118-21.
- Srivastava AA, Kulkarni AP, Harpale PM, et al. Plant mediated synthesis of silver nanoparticles using a bryophyte: Fissidens minutes and its anti-microbial activity. International Journal of Engineering Science and Technology. 2011;3(12):8342-8347.
- Bindhu MR, Umadevi M. Synthesis of monodispersed silver nanoparticles using Hibiscus cannabinus leaf extract and its antimicrobial activity. SpectrochimActa Part A Mole BiomolSpectrosc. 2013;101:184-90.
- Thamer NA, Almashhedy LA. Green synthesis optimization and characterization of silver nanoparticlesusing aqueous extract of Crocus sativus L. Int J Pharm Bio Sci. 2014;5(4):759-70.
- Saraschandra N, Sivakumar A. Eco-friendly synthesis of silver and gold nanoparticles with enhanced bactericidal activity and study of silver catalyzed reduction of 4-nitrophenol. SpectrochimActa Part A MolBiomolSpectrosc. 2014;128:357-62.
- Lu R, Yang D, Cui D, et al. Egg white-mediated green synthesis of silver nanoparticles with excellent biocompatibility and enhanced radiation effects on cancer cells. Int J Nanomed. 2012;7:2101-2107.
- Babu SM, Aishwarya D, Vidya SK, et al. Synthesis of silver nanoparticles using medicinal Zizyphusxylopyrus bark extract. ApplNanosci. 2015;5:755-62.
- Daniel SCGK, Mahalakshmi N, Sandhiya J, et al. Oxidative N-dealkylation reactions by oxoiron (IV) complexes of nonheme and heme ligands. Advanced Materials Research. 2013;678:349-60.
- Ashmi M, Golap K, Madhuri S, et al. Extracellular biosynthesis of gold nanoparticles using Escherichia coli and deciphering the role of lactate-dehydrogenase using ldh knock out E. coli.AdvApplSci Res. 2012;3:1405-12.
- Sathishkumar M, Sneha K, Won SW, et al. Cinnamon zeylanicum bark extract and powder mediated green synthesis of nano-crystalline silver particles and its bactericidal activity. Colloids Surf B Biointerfaces. 2009;73(2):332-38.
- Safaepour M, Shahverdi AR, Shahverdi HR, et al. Green synthesis of small silver nanoparticles using geraniol and its cytotoxicity against Fibrosarcoma-wehi164. Avicenna J Med Biotechnol. 2009;1(2):111-5.
- Helen MS, Rani EH. Characterization and antimicrobial study of nickel nanoparticles synthesized from Dioscorea(Elephant Yam) by green route. International Journal of Science and Research. 2015;4(11):216-19.
- Al-Kawaz HS, AL-Mashhedy LA. Green synthesis of silver nanoparticles usingActinidiadeliciosaextracts. Research Journal of Pharmaceutical, Biological and Chemical Sciences. 2016;0975-8585.
- Devaraj P, KumariP, Aarti C, et al. Synthesis and characterization of silver nanoparticles using cannon-ball leaves and their cytotoxic activity against MCF-7 cell line. Journal of Nanotechnology. 2013.
- Priya AM, Selvan RK, Senthilkumar B, et al. Synthesis and characterization of CdWO4 nanocrystals. Ceram Int. 2011;37(7):2485-8.
- Banerjee P, Satapathy M, Mukhopahayay A, et al. Leaf extract mediated green synthesis of silver nanoparticles from widely available India plants sythesis characterization, antimicrobial property and toxicity analysis. Bioresources& Bioprocessing. 2014;1(3):1-10.
- Patil SV, Borase HP, Patil CD, et al. Biosynthesis of silver nanoparticles using latex from few Euphorbian plants and their antimicrobial potential. ApplBiochemBiotechnol. 2012;167:776-90.
