Research
, Volume: 19( 1) DOI: 10.37532/0974-7419.2019.19(1).146The Thermal Analysis of Felodipine and Ramipril: Application to Quality Control
- *Correspondence:
- Ali KA National Organization for Drug Control and Research (NODCAR), Giza, Egypt, E-Mail: alikamal1978@hotmail.com
Received: January 07, 2018; Accepted: January 16, 2018; Published: January 22, 2018
Citation: Ali KA, Elham AT, Zainab MY et al. The Thermal Analysis of Felodipine and Ramipril: Application to Quality Control. Anal Chem Ind J. 2019;19(1):146.
Abstract
Thermal behaviour of Felodipine (FEL) and Ramipril (RAM) drugs was studied in drug substance, binary mixture and co-formulated tablets. Some thermal analysis methods such as thermogravimetric analysis (TGA), derivative thermogravimetry (DrTGA), differential thermal analysis (DTA) and differential scanning calorimetry (DSC) were used to investigate the thermal behaviour of both drugs. The thermogravimetric data allowed the determination of different thermodynamic and kinetic parameters such as: Ea, ΔH, ΔS and ΔG. The drugs purity was found to be 99.88% and 99.92% for FEL and RAM, respectively. The simplicity, speed and low cost of the thermal analysis justify its application in the quality control of pharmaceutical drugs.
Keywords
Felodipine; Ramipril; Thermal analysis; Purity; Co-formulated; Thermodynamic parameters
Introduction
FEL (FIG. 1 ); ethylmethyl(4RS)-4-(2,3-dichlorophenyl)-2,6-dimethyl-1,4dihydropyridine-3,dicarboxylate [1]. RMP (FIG. 1 ), (2S,3aS,6aS)-1-[(2S)-2[[(1S)-1-(Ethoxycarbonyl)-3 phenylpropyl] amino] propanoyl] octahydrocyclopenta[b] pyrrole-2-carboxylic acid [1]. Both drugs were used to treat high blood pressure.

FIG 1: The chemical structure of FEL and RAM.
FEL and RAM are co-formulated as oral tablet which is used in several antihypertension preparations. The antihypertensive efficacy of the combination was additive and the coadministration of ramipril did not decrease the incidence of headache attributable to felodipine [2].
Several methods were reported for the determination of FEL individually using UV spectrophotometry [3], HPLC [4-6], spectrofluorimetric [7], gas chromatography [8], and electrochemical methods [9,10]. On the other hand, RMP was determined individually by spectrophotometric methods [11-13], HPLC [12,14,15], HPTLC [16,17] and electrochemical methods [18-21]. Meanwhile, some spectrophotometric [22,23], HPLC [22-25] and HPTLC [26] methods were reported for the simultaneous determination of both drugs.
Thermal analysis is the measurement of physical-chemical properties of materials using function of temperature. The most widely used thermal analysis techniques are, thermogravimetric analysis (TGA), derivative thermogravimetric analysis (DrTGA), differential thermal analysis (DTA) and differential scanning calorimetry (DSC) find wide spread use for both quality control and research applications on industrial products, such as polymers and pharmaceuticals [27-29].
Thermal analysis has great importance in identification, stability, preformation, drug-excipient interaction and quality control of drugs [30]. DSC is used in the pharmaceutical industries, to determine the melting point, glass transition temperature, purity and thermal decomposition of drug substances, yielding results rapidly and efficiently.
Up to our knowledge, the present work is the first attempt to study the thermal behaviour of FEL and RAM in binary mixture and co-formulated tablet using green method to determine their purities.
Materials and Methods
Materials
Ramipril (RAM) was obtained from Kahira Pharmaceuticals and Chemical Industries Co. Felodipine (FEL) was kindly supplied from Egyptian Group for Pharmaceutical Industries. (EGPi Co., Egypt). The purity values of RAM (99.76%) and FEL (98.9%) were obtained using the official method [1]. Triacor® tablets, (Aventis Pharma Deutschland GmbH-Germany) was labeled to contain 5 mg RMP and 5 mg FEL purchased from local market.
Instruments and methods
Thermogravimetric analysis (TGA, DrTGA and DTA): Shimadzu thermogravimetric analyzer DTG-60 H with TA 60 software (Tokyo-Japan) was used; aluminium oxide is used as a reference. The experiments were achieved in platinum crucible up to 850°C at a heating rate of 5°C/min in dry nitrogen atmosphere (flow rate of 30 mL/min). About 5 mg of drug was used.
Differential scanning calorimetry (DSC): Shimadzu-DSC 50 (Tokyo-Japan). The temperature ranged from 25°C to 400°C at a heating rate of 5°C/min in dry nitrogen atmosphere (flow rate of 30 mL/min). Round 5.0 mg of drug was packed in an aluminium pan. An empty aluminium pan was used as a reference.
Results and Discussion
Thermal analysis of FEL and RAM drug substances
FIG. 2A shows the TGA, DrTGA and DTA curves of FEL. The TGA and DrTGA curves show that FEL is thermally stable up to 190.62°C and decomposes at higher temperatures in one step. DTA curve was showed an exothermic peak at 56.09°C which may be due to glass transition, which means an increase in heat capacity due to transition of material from amorphous form into crystalline form. Endothermic peak at 143.61°C which may be due to melting and exothermic peaks appear during decomposition of the drug as follow: a highly weak and broad exothermic peak at 223.53°C, a strong exothermic peak at 310.69°C, a very weak and broad exothermic peak at 372.17°C, followed by a strong and broad exothermic peak at 473.06°C. The thermal decomposition mechanism of FEL was suggested as shown in FIG. 2B.

FIG 2: TGA, DrTGA and DTA curves of FEL (A) and suggested decomposition mechanism of FEL, (B) at heating rate of 5°C/min.
FIG. 3A shows the TGA, DrTGA and DTA curves of RAM. The TGA and DrTGA curves show that RAM is thermally stable up to 103.99°C and decomposes at higher temperatures in three steps. The first decomposition step happens in the temperature range of 103.99oC-137.59°C, RAM loses water molecule (Mass loss: Found 4.169%, Calc. 4.142%). The second decomposition step takes place in the temperature range of 137.59°C-350.37°C, RAM loses C21H27N2O4 (Mass loss: Found 85.338%, Calc. 85.386%). The third decomposition step occurs in the temperature range of 350.37°C-559.23°C, RAM loses C2H5O (Mass loss: Found 10.503%, Calc. 10.357%). The DTA curve shows an exothermic peak at 54.86°C which may be due to glass transition, an endothermic peak at 112.18°C which may be due to melting and the first decomposition step, an extremely weak and broad exothermic peaks at 215.98°C and 336.28°C which may be related to the second decomposition step. Medium and broad exothermic peak at 532.81°C due to the third decomposition step. The suggested thermal decomposition mechanism of RAM is shown in FIG. 3B.

FIG 3: TGA, DrTGA and DTA curves of RAM (A) and suggested decomposition mechanism of RAM, (B) at heating rate of 5°C/min.
Thermal analysis of FEL-RAM binary mixture
FIG. 4A displays the TGA and DrTGA of FEL-RAM mixture (1:1 w/w) which is the same proportion in Triacor® tablet. The mixture is thermally stable up to 96.72°C, and then the mixture starts to decompose in three decomposition steps. FIG. 4B exhibits the DTA curves of FEL-RAM mixture. The DTA curve of the mixture shows a broad exothermic peak at 65.64°C which may be attributed to glass transition of the drugs in the mixture. An endothermic peak at 104.62°C which may be related to the melting of RAM, a very weak exothermic peak at 316.45°C which may include the exothermic peaks at 310.69°C and 336.28°C in the DTA curves of FEL and RAM respectively. A very weak exothermic peak at 351.97°C which appears at 372.17oC and in the DTA curve of RAM, and a very weak and broad exothermic peak at 516.58°C which includes the two exothermic peaks appear at 473.06°C and 532.81°C in the DTA curves of FEL and RAM, respectively. The DTA curve of FEL-RAM mixture shows the disappearance of the endothermic peak at 143.61°C and an exothermic peak at 223.53°C in the DTA curve of FEL and the exothermic peak at 215.98°C in the DTA curve of RAM. The results show that there is no interaction between FEL and RAM.

FIG 4: TGA and DrTGA curves of FL-RAM mixture (A) and DTA curves of FEL, RAM and FEL-RAM mixture, (B) at heating rate of 5°C/min.
Application of thermal analysis to Triacor® tablet
FIG. 5 displays the TGA and DTA of Triacor tablets (powder), the tablet powder starts to decompose at 45°C indicating that the tablet powder is less thermally stable than the pure drugs mixture which starts to decompose at to 97°C, this behavior may be attributed to excipients in tablets.

FIG 5: Thermal analysis (TGA, DrTGA and DTA curves) of Triacor® tablet.
The DTA curve shows a broad exothermic peak at 45.97°C which may be due to glass transition of the drugs in tablet powder, an endothermic peak at 66.88°C which may be due to the melting of RAM, and a very weak and broad exothermic peak at 462.40°C which appears as weak and broad exothermic peak at 516.58°C in the DTA curve of FEL-RAM mixture. The DTA curve also show a very weak endothermic peak at 220.21°C, strong exothermic peak at 338.69°C, and medium exothermic peak at 422.9°C which may be due to interaction of the tablet excipients with FEL and RAM, but not necessarily corresponding to incompatibility. A similar effect was observed for other drug: excipient mixtures, and was attributed to drug dissolution in the melted excipients [31].
Non-isothermal kinetic study
The kinetic studies of the main thermal decomposition steps of RAM and FEL were investigated using the mathematical models (1 and 2) of Horowitz-Metzger and Coats-Redfern, respectively [32,33], as shown in FIG. 6-8 . The thermodynamic and kinetic parameters such as activation energy (E), entropy (ΔS), enthalpy (ΔH) and Gibbs free energy (ΔG), as presented in TABLE 1.

FIG 6: Coats-Redfern (A) and Horowitz and Metzger (B) plots of the decomposition of FEL drug.

FIG 7: Coats-Redfern plots of first (A), second (B) and third (C) decomposition steps of RAM drug.

FIG 8: Horowitz and Metzger plots of first (A), second (B) and third (C) decomposition steps of RAM drug.
Horowitz-Metzger method
Horowitz-Metzger equation can be represented as follow:
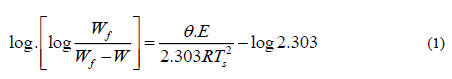
Where Wf is the mass loss at the end of the decomposition process, W is the mass loss up to temperature T, R was the gas
constant, Ts is the DrTGA peak temperature and  =T-Ts. A plot of log [log Wf/(Wf -W)] against was gave a straight line
and E could be calculated from the slope.
=T-Ts. A plot of log [log Wf/(Wf -W)] against was gave a straight line
and E could be calculated from the slope.
Coats-Redfern method
Coats-Redfern equation can be represented as follow:
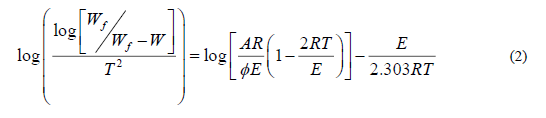
Where  is the heating rate. While 1-2RT /
 the plot of the left-hand side of equation (2) against 1/T would give a
straight line. E was calculated from the slope and the Arrhenius constant (A) was obtained from the intercept. The enthalpy
ΔH, entropy ΔS and free energy ΔG of activation were calculated using the following equations:
the plot of the left-hand side of equation (2) against 1/T would give a
straight line. E was calculated from the slope and the Arrhenius constant (A) was obtained from the intercept. The enthalpy
ΔH, entropy ΔS and free energy ΔG of activation were calculated using the following equations:
•S=2.303 [log (Ah/kT)] R (3)
•H=E*-RT (4)
•G=H*-Ts •S* (5)
Where k and h are the Boltzman and Planck constants, respectively.
TABLE 1 shows thermodynamic parameters of thermal decomposition of FEL and RAM.
| Temperature range (°C) | E (KJ/mol) HM (CR) |
A (S-1) HM (CR) |
DS (J/mol K) HM (CR) |
DH (KJ/mol) HM (CR) |
DG (KJ/mol) HM (CR) |
|---|---|---|---|---|---|
| FEL | |||||
| 190.62-560 | 210.674 (195.416) |
3.53 × 10¹⁸ (1.37 × 10¹⁷) |
104.642 (77.647) |
205.852 (190.590) |
145.151 (145.550) |
| RAM | |||||
| 103.99-137.59 | 38.931 (32.550) |
2.19 × 10⁴ (3.16 × 10²) |
-164.164 (-199.40) |
35.656 (29.272) |
100.332 (107.830) |
| 137.59-350.37 | 128.454 (116.444) |
4.61 × 10¹⁰ (4.42 × 10⁹) |
-46.48 (-65.984) |
123.526 (111.514) |
151.073 (150.620) |
| 350.37-590.23 | 230.919 (225.976) |
1.25 × 10¹⁴ (2.71 × 10¹⁴) |
16.573 (23.025) |
224.133 (219.185) |
210.604 (200.390) |
TABLE 1. Thermodynamic parameters of thermal decomposition of FEL and RAM.
FIG. 6-8 show the Coats-Redfern and Horowitz and Metzger plots of the decomposition of FEL and RAM drugs.
The DSC investigation of FEL and RAM
FIG. 9 shows the DSC curves of FEL, RAM and FEL-RAM mixture, FIG. 9A (DSC curve of FEL) exhibits an endothermic peak at 141.55°C (melting of FEL) and exothermic peak at 308.47°C which appear at 143.61°C and at 310.69°C in the DTA curve of FEL. FIG. 9B (DSC curve of RAM) displays an endothermic peak at 108.08°C (melting of RAM), extremely weak exothermic peaks at 210.11°C and 333.17°C which appear at 112.18°C, 215.98°C and at 336.28°C the DTA curve of RAM.

FIG 9: DSC curves of FEL (A), RAM (B) and FEL-RAM mixture (C) at heating rate of 5°C/min.
FIG. 9C (DSC curve of FEL-RAM mixture) shows an endothermic peak at 99.30°C which may be attributed to melting of RAM, and two consecutive weak exothermic peaks at 311.52°C and 348.75°C which appear at 104.62°C, 316.45°C and at 351.97°C the DTA curve of FEL-RAM mixture.
Van’t Hoff equation: Tf =T0-[(R T02 X/ΔHf). 1/F] [34] is used to calculate the purity value of drugs, where Tf is the melting temperature of the sample, T0 is the melting point of pure substance in Kelvin (K), R is the gas constant, ΔHf is the heat of fusion, F is fraction of sample melted at Tf, and x is mole fraction of impurities in the sample.
Application of thermal analysis to quality control of FEL and RAM
In this work, thermal analysis of FEL and RAM (TGA, DrTGA, DTA and DSC) was used as an alternative technique for laboratory-screen tests (long-term tests) for the determination of different quality parameters such as, melting point, purity, ash content and water content. TABLE 2 shows the melting point values of FEL and RAM in the DTA and DSC curves, using melting point apparatus and official method [35]. The purity values of FEL and RAM were founded to be 99.88% and 99.92%, respectively. TABLE 3 shows the purity values of FEL and RAM using DSC method and official methods [1]. No significant difference was observed between the obtained results when compared with those of the official methods [1,35]. From the results, we conclude that thermal analysis can be used as quality control tool to determine melting point, purity, water content and ash content of both drugs. There is no interaction between FEL and RAM based on DTA and DSC results. Furthermore, thermal fingerprint of FEL and RAM provided information on identification, crystal perfection, dehydration and thermal degradation.
| Drug | Melting point (°C) | |||
|---|---|---|---|---|
| DTA method | Melting point* apparatus | DSC Method | Official method [35] | |
| FEL | 143.61 | 144.2 | 141.55 | 145 |
| RAM | 112.18 | 110.7 | 108.08 | 109 |
*Instruments: Melting point (Optimelt, USA)
TABLE 2. Melting points of FEL and RAM.
| Parameters | Thermal analysis | Official method [1] | ||
|---|---|---|---|---|
| FEL | RAM | FEL | RAM | |
| Loss on drying* | 0.22% | 0.026% | 0.25% (N.M.T 0.5%) |
0.015% (N.M.T 0.2%) |
| Ash content* | Zero% | Zero% | 0.03% (N.M.T 0.1%) |
0.02% (N.M.T 0.1%) |
| Purity | DSC | Official method [1] | ||
| FEL | RAM | FEL | RAM | |
| 99.88% | 99.92% | 98.90% | 99.76% | |
*Instruments: Oven (Memmert) for loss on drying and muffle Furnace (Vulcan A-550), for ash content.
TABLE 3. Quality control parameters obtained from the thermal analysis of FEL and RAM compared with the official method.
Conclusion
In this work green method was studied for thermal analysis of FEL and RAM using different thermal techniques. This method was applied in binary mixture and co-formulated tablet. The melting point values obtained by DTA and DSC confirm the precision of these techniques when compared with the official methods. Therefore these techniques can be used for identification of both drugs based on their melting points. The purity values, water content and ash content of RAM and FEL are in agreement with that obtained by the official methods. Thus, the method was applied for the quality control of both drugs.
Acknowledgment
The authors would like to express their gratitude to the National Organization for Drug Control and Research (NODCAR, Egypt) for providing instruments and the means necessary to complete this work.
Conflict of Interest
The authors declare no conflict of interests.
References
- British Pharmacopoeia. 9th ed: the Council of Europe. 2018.
- Bainbridge D, Macfadyen RJ, Stark S, et al. The antihypertensive efficacy and tolerability of a low dose combination of ramipril and felodipine ER in mild to moderate essential hypertension. Br J Clin Pharmac. 1993;36:323-30.
- Nimje H, Oswal R, Kshirsagar SS, et al. Spectrophotometric analysis for estimation of felodipine in tablet dosage form by calibration curve method. Res J Pharm Technol. 2011;4:1805-6.
- Karlsson A, Pettersson K, Hernqvist K. Resolution and determination of enantiomeric purity of the enantiomers of felodipine using chiral-AGP® as stationary phase. Chirality. 1995;7:147-53.
- Cardoza RM, Amin PD. A stability indicating LC method for felodipine. J Pharm Biomed Anal. 2002;27:711-8.
- Salem H, Abdallah OM. Determination of metoprolol and felodipine in binary mixture using chemometric-assisted spectrophotometric and high-performance liquid chromatographic-UV methods. Am J Appl Sci. 2007;4:709-17.
- Walash MI, Belal FF, El-Enany NM, et al. Synchronous fluorescence spectrofluorimetric method for the simultaneous determination of metoprolol and felodipine in combined pharmaceutical preparation. Chem Cent J. 2011;5:70.
- Dru JDY, Hsieh JYK, Matuszewski BK, et al. Determination of felodipine, its enantiomers, and a pyridine metabolite in human plasma by capillary gas chromatography with mass spectrometric detection. J Chromatogr B. 1995;666:259-67.
- Jammal AE, Vire JC, Patriarche GJ, et al. Cyclic voltammetric study of some calcium antagonist dihydropyridines in aqueous medium. Electroanalysis. 1992;4:57-64.
- Sikkander ARM, Vedhi C, Manisankar P. Electrochemical determination of calcium channel blocker drugs using multiwall carbon nanotube-modified glassy carbon electrode. Int J Ind Chem. 2012;3:29-37.
- Salama FM, El-Sattar OIA, El-Aba SNM, et al. Spectrophotometric determination of some ACE inhibitors through charge transfer complexes. Az J Pharm Sci. 2001;27:121-32.
- Üstün FG, Üstün O, Atay O. Quantitative determination of felodipine in pharmaceuticals by high pressure liquid chromatography and UV spectroscopy. Turk J Pharm Sci. 2004;2:65-76.
- Rahman N, Ahmad Y, Azmi SNH. Kinetic spectrophotometric method for the determination of ramipril in pharmaceutical formulations. AAPS Pharm Sci Tech. 2005;6:543-51.
- Patil KR, Rane VP, Sangshetti JN, et al. A stability-indicating LC method for the simultaneous determination of telmisartan and ramipril in dosage form. Chromatographia. 2008;67:575-82.
- Szpot P, Buszewicz G. Determination of ramipril in human plasma and its fragmentation by UPLC-Q-TOF-MS with positive electrospray ionization. Acta Pharmaceutica. 2015;65:159-69.
- Patel AV, Patel GP, Chaudhary GB, et al. Development and validation of HPTLC method for the simultaneous estimation of telmisartan and ramipril in combined dosage form. IJBPR. 2010;1:18-24.
- Parmar DA, Thakkar VD, Patel RB, et al. HPTLC method for simultaneous estimations of ramipril and losartan potassium in pharmaceutical dosage form: development and validation considerations. TJPS. 2015;39:83-88.
- Belal F, Al-Zaagi IA, Abounassif MA. Voltammetric determination of benazepril and ramipril in dosage forms and biological fluids through nitrosation. J AOAC Int. 2001;84:1-8.
- Prieto JA, Jiménez RM, Alonso RM. Square wave voltammetric determination of the angiotensin-converting enzyme inhibitors cilazapril, quinapril and ramipril in pharmaceutical formulations. Farmaco. 2003;58:343-50.
- Mattos GJ, Scremin J, Salamanca-Neto CAR, et al. The performance of boron-doped diamond electrode for the determination of ramipril and its association with hydrochlorothiazide. Electroanalysis. 2017;29:1180-87.
- Silva TA, Fatibello-Filho O. Square-wave adsorptive anodic stripping voltammetric determination of ramipril using an electrochemical sensor based on nanostructured carbon black. Analytical Methods. 2017;9:4680-87.
- Rontogianni MA, Markopoulou CK, Koundourellis JE. HPLC and chemometrically assisted spectrophotometric estimation of two binary mixtures for combined hypertension therapy. J Liq Chromatogr Relat Technol. 2006;29:2701-19.
- El-Yazbi FA, Mahrous ME, Hammud HH, et al. Comparative spectrophotometric, spectrofluorometric, and high performance liquid chromatographic study for the quantitative determination of the binary mixture felodipine and ramipril in pharmaceutical formulations. Anal Lett. 2008;41:853-70.
- Raja B, Rao AL. Development and validation of RP-HPLC method for simultaneous estimation of ramipril and felodipine in pharmaceutical dosage forms. J Asian Nat Prod Res. 2013;6:1018-22.
- Gawai AA, Shaikh T, Kolhe S, et al. RP-HPLC method development and validation for determination of an antihypertensive agent. Int Journal ChemTech Research. 2018;11:228-39.
- Mohamed AI, Omar MA, Hammad MA, et al. Development and validation of TLC-densitometric method for simultaneous determination of two binary antihypertensive mixtures containing felodipine in fixed dose combinations. Biomedical Chromatography. 2016;30:200-7.
- Haines PJ. Principles of thermal analysis and calorimetry. London, UK: American Chemical Society. 2002.
- Brown ME, Gallagher PK. Handbook of thermal analysis and calorimetry. Netherland: Elsevier. 2008.
- Menczel JD, Prime RB. Thermal analysis of polymers: Fundamentals and applications. Hoboken, NJ, USA. John Wiley and Sons. 2009.
- Vyazovkin S, Burnham AK, Criado JM, et al. ICTAC kinetics committee recommendations for performing kinetic computations on thermal analysis data. Thermochim Acta. 2011;520:1-19.
- Taha EA. On the thermal behavior of delorazepam: Application to quality control analysis. Bulletin of Faculty of Pharmacy, Cairo University. 2009;47:1-14.
- Horowitz HH, Metzger G. A new analysis of thermogravimetric traces. Analytical Chemistry. 1963;35:1464-68.
- Coats AW, Redfern JP. Kinetic parameters from thermogravimetric data. Nature 1964;201:68-9.
- Attia AK, Souaya ER, Soliman EA. Thermal analysis investigation of dapoxetine and vardenafil hydrochlorides using molecular orbital calculations. Adv Pharm Bull. 2015;5:523-29.
- Yoshimotoa S, Mukaib H. Copper(II)-selective membrane electrode based on hydrotris(3-isopropylpyrazolyl)methane in a poly(vinyl chloride) matrix. Chim Acta. 2003;494:207.