Research
, Volume: 15( 3) DOI: 10.37532/0974-7435.2019.15(3).192The Influence of Light Intensity and Photoperiod on the Growth of two Fresh Water Green Algae Tetranephris brasiliensis and Scenedesmus sp Isolated from Estuary
- *Correspondence:
- Nadia Yasmine Asfouri
Aquaculture and Bioremediation Laboratory (Aquabior), Department of Biotechnology, University of Oran 1, Ahmed Ben Bella, Oran, Algeria, E-mail: asfouri.n@gmail.com
Received: May 01, 2019; Accepted: May 23, 2019; Published: May 30, 2019
Citation: Asfouri NY, Baba Hamed MB, Abi-Ayad SMEA, et al. The Influence of Light Intensity and Photoperiod on the Growth of two Fresh Water Green Algae Tetranephris brasiliensis and Scenedesmus sp. Isolated from Estuary. Biotechnol Ind J. 2019;15(3):192.
Abstract
The culture of microalgae requires rigorous control of all growth factors: nutrients, pH, temperature, and light. Among these factors, the light that directly influences photosynthesis mechanism is an important factor in defining optimal conditions for the culture. In this study, the effects of various intensities and its photoperiods on the growth and biochemical composition (carbohydrates, proteins) of two freshwater green algae (Tetranephris brasiliensis and Scenedesmus sp) were studied. Three different light intensities (50, 100 μmol m-2 s-1 and daylight) and three photoperiod cycles (24:0, 18:06 light: dark and natural photoperiod) is launched at a constant temperature of 23°C. Microalgal growth was measured using cell count, specific growth rate and OD in three. The results showed that under the light intensity of 100 μmol m-2 s-1 and photoperiod of 18 hour light: 6 hour dark cycle, Tetranephris brasiliensis, Scenedesmus sp. was found to grow favorably with a maximum cell concentration of 2.88 × 10⁷ cells/mL, which corresponds to the growth rate of 0.253 d-1 for Tetranephris brasiliensis and 2.56 × 10⁷ cells/mL which corresponds to the growth rate of 0.190 d-1 for Scenedesmus sp. These results confirm the real effect of photoperiod on the microalgae growth rate and show a good correlation between the absorbance measurements and cell concentrations.
Keywords
Microalga; Tetranephris brasiliensi; Scenedesmus sp; Light intensity; Photoperiod; Growth rate biochemical composition
Introduction
Microalgae are an autotrophic organism that consumes light energy and inorganic nutrients and produces biomass rich in value-added products [1]. The biotechnological potential of microalgae is related to the fact that their biomass contains valuable components, including lipids, starch, and alkanes [2].
There are between 200,000 and several million microalgal species [3]. Due to the increasing demand for microalgal biomass, a process-oriented strain selection supports the use of either indigenous strains from the respective production site or strains adapted to stress [4].
Environmental factors that exert an impact on microalgal growth include temperature, pH, salinity, inorganic carbon availability, light, silicate (for diatoms) and nutrient composition in the culture system [5]. Among these factors, the light that directly influences photosynthesis mechanism is an important factor in defining optimal conditions for the culture [6], culture conditions have a substantial effect on the algal proliferation rate and biomass production.
In this regard, the present study focuses on determining the effect of light intensity and photoperiod on growth and biochemical composition (carbohydrates, proteins) of two green algae species Tetranephris brasiliensis. and Scenedesmus sp. in laboratory scale.
Materials and Methods
Microalgae cultures and medium
Two different Chlorophyceaen species were isolated from estuary (longest natural watercourse in Algeria) and were identified as Tetranephris brasiliensis. and Scenedesmus sp. These species were chosen for our work because they were well adapted to laboratory conditions. Cultures were unialgal. They were grown in the f/2 medium prepared in sterilized natural freshwater and 2 L Erlenmeyer flask with 1 L of working volume and air bubbling, under three different light intensities (50, 100 μmol m-2 s-1 and daylight) and three different photoperiod cycles (24/0, 18/06 light: dark and natural photoperiod) at constant temperature of 24 ± 1°C and pH 8.
Each experiment was performed in three replicates for the three different photoperiod cycles.
Measurement of microalgae growth
Algal growth was measured by daily changes in optical density (OD) at 680 nm (UV 500 UV-Visible Spectro, Spectronic Unicam) and cell number was monitored using malassez counting chamber.
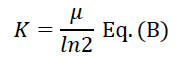
The specific growth rate (μ) and generation time were calculated from equations A and B as described [7]:
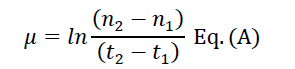
Where n2 and n1 are the cell number concentration at the times t2 and t1 respectively. The time required to duplicate the cell number division rate (K) was calculated according to the equation:
Determination of carbohydrate concentration
Cellular carbohydrates were estimated using the Dubois method [8] after hot alkaline extraction [9]. The amount of carbohydrate was estimated using a standard curve created using d-glucose.
Determination of proteins concentration
The extraction of proteins was performed using alkali [9]. The alkali extraction was repeated 3 times, the final repeat was heated at 100°C for 10 min to complete extraction of residual proteins.
The protein content in the extract was estimated using a rapid and sensitive Bradford method at 595 nm [10]. Bovine serum albumin (BSA) was used as the standard for calibration.
Statistical analysis
To test possible statistical differences between the proteins concentration, carbohydrates, and growth rate, the data were subjected to one- factor analysis of variance (ANOVA), When the variances are homogeneous, the analysis is a parametric ANOVA test 1 (p ≤ 0.05). Otherwise, the analysis is a nonparametric Kruskal-Wallis test. To determine whether the differences between the averages are significant, we used Tukey's test in the case of ANOVA 1 and the Mann-Whitney test in the case of Kruskal-Wallis.
Results and Discussion
Microalgae are photosynthetic organisms. They assimilate inorganic carbon for conversion into organic matter. Light is the source of energy which drives this process, the light may be natural or supplied by fluorescent bulbs [11]. In this regard, the current study focused on the effect of light intensity and photoperiod on growth an biochemical composition [12].
FIG. 1 and 2 illustrate the cell growth rate of Tetranephris brasiliensis. and Scenedesmus sp. respectively at three light intensities (50, 100 μmol m-2 s-1 and daylight) and three different photoperiod cycles (24/0, 18/06 light: dark and natural photoperiod) for 12 days. The cultures were sampled at a 24-hour interval. The results revealed that the cell growth curves for the three light intensities are not similar. The effect of photoperiods on the growth of Tetranephris brasiliensis. and Scenedesmus sp. in the batch culture at 100 μmol m-2 s-1 were significant (p ≤ 0.05). The cell concentration reached the maximum value (2.88 × 10⁷ cells/mL which corresponds to the growth rate of 0.253 d-1 for Tetranephris brasiliensis (TABLE 1) and 2.56 × 10⁷ cells/mL which corresponds to the growth rate of 0.190 d-1 for Scenedesmus sp. (TABLE 2) under a photoperiod of 18:06 light/dark cycles, microalgae needs a light/dark regime for productive photosynthesis, it needs light period for a photochemical phase to produce Adenosine Triphosphate (ATP), Nicotinamide Adenine Dinucleotide Phosphate Oxidase (NADPH) and also needs dark for biochemical phase synthesize essential molecules for growth [13]. The cell concentration was significantly (p ≤ 0.05) lower in 24:0 light/dark regimes compared to 18:06 light/ dark regimes under the same light intensity, too high light intensity may result in photo-inhibition and photooxidation and can be stressful, leading to reduced growth or death while low light levels (insufficient light) will become growth-limiting microalgae is under photo limitation condition. The growth of microalgae becomes inhibited when the light intensity is increased beyond the saturation light intensity [14].

FIG 1: Cell count of Tetranephris brasiliensis. cultured under Three different light intensities and photoperiod (n=3).

FIG 2: Cell count of Scenedesmus sp. cultured under three different light intensities and photoperiod (n=3).
| Treatment | Initial microalgae density ( × 105 cells mL-1) | Maximum microalgae density (× 105 cells mL-1) | Growth rate (divisions day-1) | Generation time (days) |
|---|---|---|---|---|
| 24/0 L/D (100 µmol m-2 s-1) | 40 | 187 | 0.14 a | 7.14 |
| 24/0 L/D (50 µmol m-2 s-1) | 40 | 272 | 0.207 b | 4.83 |
| 18/6 L/D (100 µmol m-2 s-1) | 40 | 288 | 0.253 c | 3.952 |
| 18/6 L/D (50 µmol m-2 s-1) | 40 | 278 | 0.221 b | 4.524 |
| Daylight | 40 | 270 | 0.195 b | 5.128 |
TABLE 1. Specific growth rates, initial microalgae density, maximum microalgae density, generation time at different light intensities and photoperiods of Tetranephris brasiliensis (n=3).
| Treatment | Initial microalgae density (× 105 cells mL-1) |
Maximum microalgae density (× 105 cells mL-1) |
Growth rate (divisions day-1) |
Generation time (days) |
|---|---|---|---|---|
| 24 /0 L/D (100 µmol m-2 s-1) | 40 | 212 | 0.138 a | 7.246 |
| 24/0 L/D (50 µmol m-2 s-1) | 40 | 250 | 0.183 b | 5.464 |
| 18/6 L/D (100 µmol m-2 s-1) | 40 | 256 | 0.190 b | 5.263 |
| 18/6 L/D (50 µmol m-2 s-1) | 40 | 234 | 0.174 c | 5.747 |
| Daylight | 40 | 246 | 0.188 b | 5.319 |
TABLE 2. Specific growth rates, initial microalgae density, maximum microalgae density, generation time at different light intensities and photoperiods of Scenedesmus sp (n=3).
In the natural environment, light intensity undergoes continuous changes, and the light regime is not constant [15].
The Results confirm the real effect of photoperiod on the microalgae growth rate and show a good correlation between the absorbance measurements and cell concentrations (FIG. 3 and 4).

FIG 3: The optical density of Tetranephris brasiliensis cultured under three different light intensities and photoperiod (n=3).

FIG 4: The optical density of Scenedesmus sp. cultured under Three different light intensities and photoperiod (n=3).
Biochemical compositional analysis of microbial biomass is a useful tool that can provide insight into the behavior of an organism and changes in its adaptational response [9]. Biochemical composition of cells that includes carbohydrates and proteins can provide a valuable indication of the physiology and metabolic status of an organism.
Under light limited conditions, the protein percentage increased with increasing irradiance (FIG. 5). Protein percentage increased (p ≤ 0.05) from 21.35% to 42.54% of the organic content for Tetranephris brasiliensis and from 26.91% to 45.58% for Scenedesmus sp., As a whole, the carbohydrates were a most abundant component of Tetranephris brasiliensis and Scenedesmus sp. Carbohydrate percentage decreased with increasing irradiance from 8.28% to 16.57% and 10.19% to 21.1% for Tetranephris brasiliensis and Scenedesmus sp respectively. The response of an organism to its living conditions, such as light, temperature, and pH can be gleaned by monitoring changes in these gross indicators with respect to growth and survival.

FIG 5: Carbohydrates and proteins content of Tetranephris brasiliensis (1) and Scenedesmus sp. (2) under different light intensity (50 μmol m-2 s-1 and 100 μmol m-2 s-1) and different photoperiods lengths (daylight, 18/06 hour and 24/0 hour light: dark cycles).
Carbohydrates were often the major energy stores, changes in which can be indicative of how the organism perceives its environment and plans to adapt, changes in total protein can reflect the rate of metabolic activity. Cellular content of protein and carbohydrates in microalgae can be varied through variation of photoperiod [16].
Conclusion
Tetranephris brasiliensis and Scenedesmus sp. grows best at a light intensity of 100 μmol m-2 s-1 and the combination of 18/06 light: dark cycle with maximum cell density and specific growth rate. In contrast, Tetranephris brasiliensis and Scenedesmus sp. showed a gradual decrease in cell density and specific growth rate when the photoperiod cycle was extended to 24/0 hour light exposure at the same light intensity. The biochemical composition of cells was significantly changed depending on light intensities and photoperiod as well as cultivation time. Protein percentage increased with increasing irradiance and carbohydrate percentage decreased with increasing irradiance.
References
- Dittamart D, Pumas C, Pekkoh J, et al. Effects of organic carbon source and light-dark period on growth and lipid accumulation of Scenedesmus sp. AARL G022. Maejo Int J of Sci Technol. 2014;8(2):198-206.
- Markou G, Nerantzis E. Microalgae for high-value compounds and biofuels production: A review with a focus on cultivation under stress conditions. Biotechnol Adv. 2013;31(8):1532-42.
- De Clerck O, Guiry MD, Leliaert F, et al. Algal taxonomy: A road to nowhere? J Phycol. 2013;49(2):215-25.
- Ras M, Steyer JP, Bernard O. Temperature effect on microalgae: a crucial factor for outdoor production. Rev Environ Sci Biotechnol. 2013;12(2):153-64.
- Kitaya Y, Xiao L, Masuda A, et al. Effects of temperature, photosynthetic photon flux density, photoperiod and O2 and CO2 concentrations on growth rates of the symbiotic dinoflagellate Amphidinium sp. J Appl Phycol. 2008;20:737-42.
- Falkowski PG, Dubinsky Z, Wyman K. Growth‐irradiance relationships in phytoplankton. Limnol Oceanogr. 1985;30(2):311-21.
- Wahidin S, Idris A, Shaleh SR. The influence of light intensity and photoperiod on the growth and lipid content of microalgae Nannochloropsis sp. Biores Technol. 2013;129:7-11.
- Dubois M, Gilles KA, Hamilton JK, et al. Colorimetric method for determination of sugars and related substances. Anal Chem. 1956;28(3):350-56.
- Chen Y, Vaidyanathan S. Simultaneous assay of pigments, carbohydrates, proteins and lipids in microalgae. Anal Chim Acta. 2013;776:31-40.
- Bradford MM. A rapid and sensitive method for the quantitation of microgram quantities of protein utilizing the principle of protein-dye binding. Anal Biochem. 1976;72(1-2):248-54.
- Babu PN, Binnal P. Lipid productivity of microalgae Chlorella vulgaris and Nannochloropsis oculata in externally illuminated lab scale photobioreactor. Int J ChemTech Res. 2015;7(5):2217-21.
- Harun I, Yahya L, Chik MN, et al. Effects of natural light dilution on microalgae growth. Int J Chem Eng Appl. 2014;5(2):112.
- Cepák V, Přibyl P, Vítová M. The effect of light color on the nucleocytoplasmic and chloroplast cycle of the green chlorococcal alga Scenedesmus obliquus. Folia Microbiol. 2006;51(4):342-48.
- Chen X, Goh QY, Tan W, et al. Lumostatic strategy for microalgae cultivation utilizing image analysis and chlorophyll a content as design parameters. Biores Technol. 2011;102(10):6005-12.
- Khoeyi ZA, Seyfabadi J, Ramezanpour Z. Effect of light intensity and photoperiod on biomass and fatty acid composition of the microalgae, Chlorella vulgaris. Aquac Int. 2012;20(1):41-49.
- Al-Qasmi M, Raut N, Talebi S, et al. A review of effect of light on microalgae growth. In proceedings of the world congress on engineering. 2012;1:4-6.