Original Article
, Volume: 12( 12)Region Growing Image Segmentation for Newborn Brain MRI
- *Correspondence:
- Udayakumar E, Department of ECE, KIT-Kalaignar-Karunanidhi Institute of Technology, Coimbatore, Tamilnadu, India, Tel: +91 422 2367890; E-mail: udayakumar.sujith@gmail.com
Received: November 19, 2016; Accepted: December 08, 2016; Published: December 10, 2016
Citation: Udayakumar E, Santhi S, Gowrishankar R, et al. Region Growing Image Segmentation for Newborn Brain MRI. Biotechnol Ind J. 2016;12(12):118.
Abstract
Magnetic Resonance Imaging (MRI) is increasingly being used to assess brain growth and development in infants. Such studies are based on quantitative analysis of anatomical segmentation of brain MRI images. However, the large changes in the brain shape and appearance associated with development, the lower signal-to-noise ratio and partial volume effects in the newborn brain are the present challenges for accurate segmentation of newborn MRI data. This system provides a framework for accurate intensity based segmentation of newborn brain using region growing algorithm.
Keywords
MRI; Region growing; K-means clustering; Neonatal brain; Image segmentation
Introduction
To access brain growth and development in the neonatal brain segmentation of Magnetic Resonance (MR) brain images [1] is used. Manual segmenting is one of the methods for segmenting is one of the methods for segmenting an image. This method produces inaccurate result. An accurate technique is needed to parcel late the brain into multiple regions. In medical imaging, an image is captured. This method is not only tedious time consuming and expensive process but also produces inaccurate results. Furthermore, manual labelling is subject to inter and intra-observer variability. These limitations of manual approaches present and vary enormously in terms of brain shape [2] and appearance as a result of rapid brain development during this period. In addition, the partial volume effect present due to the inverted signal intensity in White Matter (WM) presents an obstacle for tissue classification.
The Contrast-to-Noise Ratio (CNR) of MR images is lower also it has low signal to noise ration because of small size of neonatal brain. Main obstacle for tissue classification is partial volume effect due to inverted signal of white matter. According to tissue type including white matter, grey matter. Cerebro-Spinal Fluids (CSF) are the segmentation problem within MRI. This paper deals with automatic brain tumor segmentation for the extraction of tumor tissues from MR images. As compared to adult brain segmentation, the segmentation of new born brain MR imaging data is challenging method. It has lower CNR and SNR due to small size of neonatal brain. The Partial Volume (PV) of Grey Matter (GM) and CSF leads to intensities similar to WM which is new born brain. This PV effect leads to voxels mislabeled as WM at the CGM-CSF interface.
About 75% of the information received by human is in pictorial form. An image is digitized to convert it to a form which can be stored in a computer's memory or on some form of storage media such as a hard disk or CD-ROM. This digitization procedure can be done by a scanner, 9 or by a video camera connected to a frame grabber board in a computer. Once the image has been digitized, it can be operated upon by various image processing operations. Image processing operations can be roughly divided into three major categories, Image Compression, Image Enhancement and Restoration, and Measurement Extraction. It involves reducing the amount of memory needed to store a digital image.
Image Segmentation and Methodology
Image segmentation is to classify correctly the image pixels in decision oriented application. It is a process of partitioning an image into different regions. These regions are homogeneous in nature. The level of subdivision depends on problem being solved and segmentation stops once object of interest in the application has been isolated. Image segmentation algorithms are generally based on two basic properties of intensity values discontinuity and similarity. Discontinuity is an approach to perform segmentation [3] based on the changes in intensity. Similarity is an image partitioning in to regions that are similar to the set of predefined criteria. This technique has the variety of applications including computer vision, remote sensing, image analysis, geographical information system and in the field of medical image process. Medical image segmentation is a task for identification and location of tumors, diagnosis and computer guided surgery.
A brain image consists of four regions Gray Matter (GM), White Matter (WM), Cerebro-Spinal Fluid (CSF) and background. In order to avoid the chances of misclassification, the outer elliptical shaped object should be removed. By removing this object we will get rid of non-brain [4] tissues and will be left with only soft tissues. As brain structure are defined by boundaries of the tissue classes, thus accurate segmentation of the brain tissues is an important step in quantitative study. A review of two different segmentation techniques such as K-Means Clustering algorithm and Region growing algorithm.
K-Means clustering algorithm
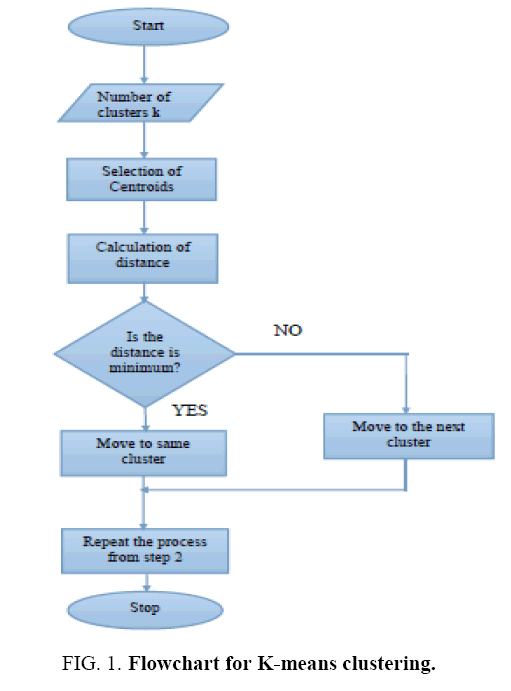
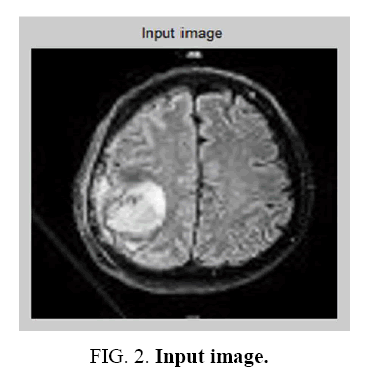
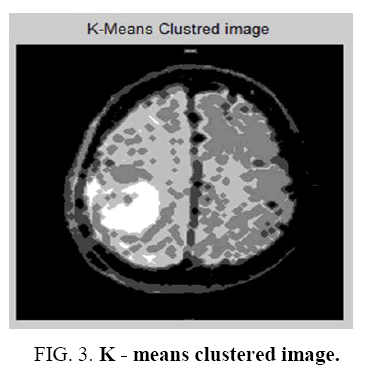
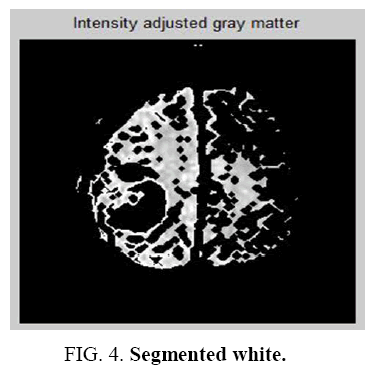
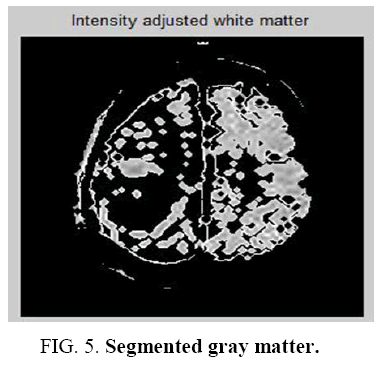
It is a learning algorithm that can solve clustering problem. The set of data through a certain number of clusters is very simple. The Flowchart for K-means clustering image is shown in Figure 1 . K-means `k’ center, it can be defined, one for each cluster. These clusters must be placed. After having `K’ new centroids a new binding has to be done between the same data set points and the nearest new center. A loop has been generated as a result of this loop, the `K’ centers change their location step by step until centers, do not move and anymore. The input image and K-means Clustering image is shown in Figure 2 and Figure 3 . The Segmented White Matter and Segmented Gray Matter is shown in Figure 4 and Figure 5 . Finally, this algorithm aims at minimizing an objective function known as squared error function.
Algorithm steps for K-means clustering: Let x={x1, x2, x3….xn} be the set of data points and v= {v1, v2, v3….vn} be the set of centers.
Step 1: Randomly select `C’ Cluster centers.
Step 2: Calculate the distance between each data point and cluster centers.
Step 3: Assign the data point to the cluster center whose distance from the cluster centers minimum of all the cluster centers.
Step 4: Recalculate the new cluster center.
Step 5: Recalculate the distance between each data point and newly obtained cluster centers.
Step 6: If no data point was resigned then stop, otherwise repeat from step 3.
Region growing algorithm
This algorithm is a classical method used for medical image segmentation. This idea is to start with set of seed points of voxels inside the region to be segmented that are the region to be segmented [5] that are manually selected that are manually selected. The pixels which are close together have similar gray values and this approach is mainly used to exploit this important factor. This neighbor pixels of seeds are added to region based homogeneity criteria thereby resulting in a connected region during the region growing phase.
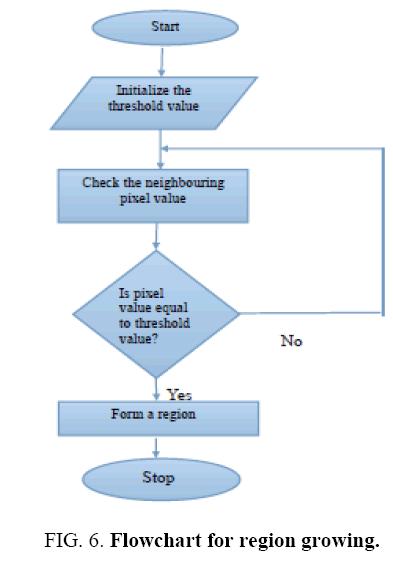
This technique is to locate the input image data in the regions which are the set of connected pixels based on the criteria which tests the properties of the local group of pixels. The pixel can be selected neither by its properties of statistics of its neighborhood nor by its distance from the seed points. After this the next 4 or 8 neighbors of the pixels are visited to check whether it belongs to the same region. The Flowchart for Region Growing algorithm is shown in Figure 6 . This continuous consequently by visiting 4 or 8 neighbor pixels. It continues until gets terminated by a criteria of termination or all the pixels in the image are tested. This result in a connected set of pixel in the region of interest to relocated.
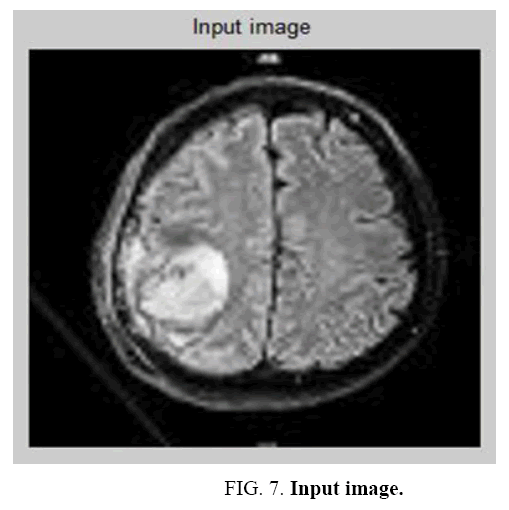
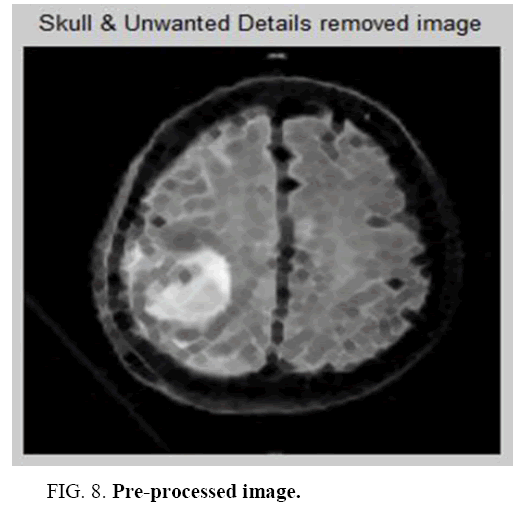
It is an iterative method. For a given k of the objective energy function an optimization process occurs for finding a local minimum for each iteration. For Such an optimization process, consider a hierarchical clustering process. The true no of classes gets reduced and over segmentation configuration with many classes deliberates when the process begins. The input image and Pre-processed image is shown in Figure 7 and Figure 8 The energy of configuration which is obtained by merging 2 classes is compared with the region merging and computed during examination of each pair of classes. It is justified when the merging is decreased.
The gray level uniformity, moments together with correlation function features and textural features are the three types of uniformity rules are used in region growing algorithm. The difference between the average gray level of an initial region and gray level of reference pixels is the emphasis for the gray level uniformity instead of the gray level of the reference pixel the average gray level of the small neighborhood is used in the region growing procedure to overcome the influence of noise. The emphasis is on the local statistical feature for the moment and correlation function. The gray level uniformity method has the same growing procedure.
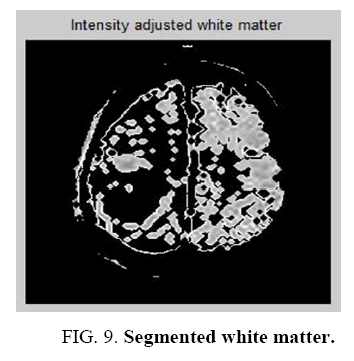
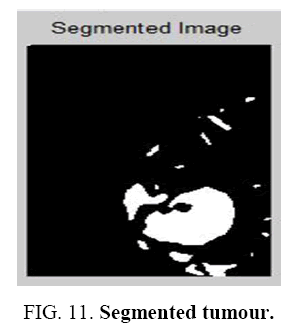
The statistical features of the reference pixel are determined from the window centered on it. The window used for the average gray level calculation is smaller than this window. There is no iterative method to update for region growing for moments and correlation ratio. The new moment and correlation ratio are computed until the grown region is large enough to ensure accuracy. The Segmented White Matter and Segmented Gray Matter. is shown in Figure 9 and Figure 10 . The homogeneous region having identical statics may differ since this uniformity is not depends on the average gray level. Identical procedure for statistical feature is needed for texture feature uniformity. The more sophisticated texture technique is segmentation method. The edge information becomes important in this ambiguous area. The Segmented tumour is shown in Figure 11 . To improve accuracy edge detection is used as it is associated to boundary for the human visual system and it is achieved by region growing.
An iterative process is the concept of region growing algorithm, simplest in region-base image segmentation methods, [6] which check the neigh touring pixels of the initial seed points then determine that those neigh touring pixels are added to seed point or not.
Algorithmic step for region growing
Step 1: let {C1, C2,…Cn} be the n cluster which is no of clustered seed points {P1, P2,….Pn}be the position of initial seed points.
Step 2: The difference of pixel value of the initial seed point Pi and its neighboring point is classified in Ci, i=1,2,…n
Step 3: Re-compute the boundary of Ci and set those boundary points as new seed points Pi(s). In addition compute the respective mean pixel value of Ci.
Step 4: Step 2 and Step 3 is repeated until all the pixels in the image have be allocated to a suiTable cluster.
After preforming different threshold operation tumors are segmented out from image semi-automatically [7,8].
An average of each case for each method reveals that the seeded region growing is preforming better between all the segmentation [5] methods. Based on the seed value, the infected region all segmented out because of its nature of grouping the pixels into regions.
Experimental Results
In assisting the treatment planning calculation of tumor area plays a vital role. Although the computer aided techniques are complex and require huge effort to be implemented but not as tedious, laborious, and time consuming as manual methods [9,10].
The below Table 1 discuss the statistical parameters calculated from the segmented image using k-means clustering.
| Data | SD | CO_V | Mean | Variance | Kurtosis |
|---|---|---|---|---|---|
| SET1 | 0.5689 | 0.1138 | 1.8701 | 1.4665 | 2.5539 |
| SET2 | 0.5137 | 0.1376 | 2.1413 | 1.7197 | 1.8908 |
| SET3 | 0.5424 | 0.1248 | 2.0750 | 1.7013 | 2.0903 |
| SET4 | 0.5529 | 0.1148 | 2.0788 | 1.7345 | 2.0751 |
| SET5 | 0.5473 | 0.1045 | 2.0955 | 1.7264 | 2.0483 |
| SET6 | 0.5366 | 0.1267 | 2.9492 | 2.1776 | 1.7239 |
| SET7 | 0.5465 | 0.1300 | 1.8646 | 1.4830 | 2.3762 |
| SET8 | 0.5593 | 0.0906 | 1.7022 | 1.2537 | 3.0434 |
| SET9 | 0.3896 | 0.0870 | 2.4873 | 1.4807 | 1.6381 |
| SET10 | 0.2582 | 0.0632 | 2.1489 | 1.1142 | 2.2598 |
Table 1: Performance measure for segmented Image using k-means clustering algorithm.
The performance measure for segmented image is listed in Table 2 using Region growing algorithm. By analyzing TableS 1 and 2 the result which is obtained by k-means algorithm and the result area obtained by region growing algorithm is only the tumor affected area [11-14].
| Data | SD | CO_V | Mean | Variance | Kurtosis | Area |
|---|---|---|---|---|---|---|
| SET1 | 35.63 | 58.51 | 12.6 | 2.57e+003 | 15.43 | 1146 |
| SET2 | 44.32 | 107.09 | 19.70 | 3.90e+003 | 9.24 | 2407 |
| SET3 | 44.67 | 115.39 | 19.54 | 3.89e+003 | 9.37 | 2840 |
| SET4 | 39.29 | 53.25 | 14.09 | 2.91e+003 | 13.91 | 1660 |
| SET5 | 41.42 | 71.89 | 16.30 | 3.36e+003 | 11.85 | 2269 |
| SET6 | 30.00 | 25.48 | 8.63 | 1.76e+003 | 22.90 | 876 |
| SET7 | 26.52 | 17.08 | 5.88 | 1.23e+003 | 34.65 | 333 |
| SET8 | 24.13 | 10.54 | 3.87 | 8.41e+002 | 55.55 | 222 |
| SET9 | 14.5 | 12.36 | 5.51 | 1.16e+003 | 37.41 | 615 |
| SET10 | 7.39 | 0.4033 | 0.27 | 6.21e+001 | 814.42 | 32 |
Table 2: Performance measure for segmented image using Region growing algorithm.
Conclusion
The latest research area in the field of the image processing for the last decade is image segmentation. Although the methods for brain MRI segmentation is a tough task where there is need to improve the precision and accuracy of segmentation. For making improvement in brain segmentation methods there should be introducing new methods and combining different methods for the future. The brain segmentation is important in using first stage in tools for detection and analyzing anatomical deviation because today`s research in the biological world increasing new knowledge about the relationship between different disorders. Today`s active research area with great interested is in brain tumor segmentation methods. This paper deals the biomedical image segmentation using two different methods. A comparative study of different approaches used for medical image segmentation with better accuracy and precision result is discussed and proved the proposed Region growing technique gives better accuracy than K-Means clustering technique.
References
- Udayakumar E,RoopaSree A, Srihari K, et al. Certaininvestigation on pathologies in brain images using MRI Slicing. Middle-East Journal of Scientific Research. 2015;6:1076-84.
- Makropoulos A, Gousias IS, Ledig C, et al. Automatic whole brain MRI segmentation of the developing neonatal brain. IEEE Transactions on Medical Imaging. 2014;33(9):1818-31.
- Cardoso MJ, Melbourne A, Kendall GS, et al. Adaptive neonate brain segmentation. In Proc MICCAI. 2011;14:378-86.
- Prastawa M, Gilmore JH, Lin W, et al. Automatic segmentation of MR images of the developing newborn brain. Med Image Anal. 2005;99(5):457-66.
- Song Z, Awate SP, Licht DJ, et al. Clinical neonatal brain MRI segmentation using adaptive non parametric data models and intensity-based Markov priors. Proc MICCAI. 2007;10:883-90.
- Xue H, Srinivasan L, Jiang S, et al. Automatic segmentation and reconstruction of the cortex from neonatal MRI. NeuroImage. 2007;38:461-77.
- Cardoso MJ, Melbourne A, Kendall GS, et al. AdaPT: An adaptive preterm segmentation algorithm for neonatal brain MRI. NeuroImage. 2012;65:97-108.
- Gousias IS, Rueckert D, Heckemann RA, et al. Automatic segmentation of brain MRIs of 2-year old into 83 regions of interest. Neuro Image. 2008;40(2):672-84.
- Gui L, Lisowski R, Faundez T, et al. Morphology-driven automatic segmentation of MR images of the neonatal brain. Med Image Anal. 2012;16(8):1565-79.
- Weisenfeld NI, War?eld SK. Automatic segmentation of new born brain MRI. NeuroImage. 2009;47:564-72.
- Gousias IS, Edwards AD, Rutherford MA, et al. Magnetic resonance imaging of the new born brain: Manual segmentation of labelled atlases in term born and preterm infants. NeuroImage. 2012;62:1499-1509.
- Gousias IS, Hammers A, Counsell SJ, et al. Magnetic resonance imaging of the newborn brain: Automatic segmentation of brain images into 50 anatomical regions. PLoS ONE. 2013;8: e59990.
- Taheri S, Ong SH, Chong S, et al. Level-set segmentation of braintumors using a threshold- based speed function. Elsevier Journal of Image and vision computing. 2010;28:26-7.
- Xiea K, Yanga J, Zhanga ZG, et al. Semi-automated brain tumor and edema segmentation using MRI. European Journal of Radiology. 2005;56:12-19.
