Original Article
, Volume: 16( 15)New Validated Spectrophotometric Methods for the Estimation of Clobazam in Pure and Formulations
- *Correspondence:
- Rambabu C, Department of Chemistry, University College of Sciences, Acharya Nagarjuna University, Nagarjunanagar, Guntur, AP, India, Tel: 966333585; E-mail: rbchintala@gmail.com
Received: October 16, 2016; Accepted: November 05, 2016; Published: November 12, 2016
Citation: Uma Maheswar K, Rami Reddy YV, Rambabu C. New Validated Spectrophotometric Methods for The Estimation of Clobazam In Pure and Formulations. Anal Chem Ind J. 2016;16(15):110.
Abstract
Three simple, sensitive and economical spectrophotometric methods were developed and validated for the determination of clobazam in pharmaceutical formulation. The methods were based on the formation of colored complex between clobazam and chromogenic reagents such as Alizarin Red S, Chloranilic Acid and Woolfast blue black. The absorbance of the colored complex was measured at its maximum wavelength using reagent blank. These methods showed linearity at different concentration ranges (6.0 μg/mL to 21.0 μg/mL, 24.0 μg/mL to 84.0 μg/mL and 8.0 μg/mL to 28.0 μg/mL) with correlation coefficients 0.9990, 0.9996 and 0.9992 respectively in acceptable range as per ICH guidelines. Statistical analysis proved that the proposed methods were reproducible and selective for the estimation of Clobazam in bulk drug and in its pharmaceutical formulation.
Keywords
Clobazam; Spectrophotometry; Alizarin Red S; Chloranilic Acid and Woolfast blue black; Validation
Introduction
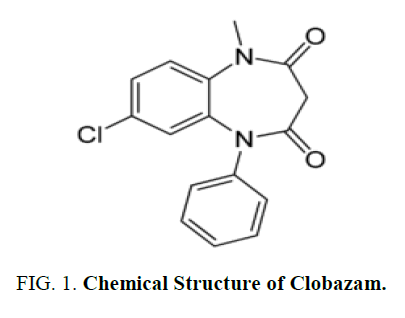
Clobazam (CBZ) is a 1,5-benzodiazepine, which is marketed as anxiolytic and anticonvulsant and used for the treatment of various seizure types and epilepsy [1]. CBZ is chemically known as 7-chloro-1-methyl-5-phenyl-1,5-benzodiazepine-2,4 (3H-dione) and its molecular structure is represented by Figure 1. CBZ is available in oral form under the brand names Frisium, Urbanol and Onfi.
On literature survey, it is found that very few methods like HPLC [2-4], UV and visible spectrophotometry [5,6] are so far reported for the determination of clobazam in different biological fluids [7,8] and pharmaceutical formulations [9] along with some simultaneous determination methods [10,11]. We now report three new, simple and economical spectrophotometric methods for the determination of the drug.
Experimental
Instrumentation
A SICAN 2301 double beam spectrophotometer (Hitachi) is used to carry out spectral analysis and the data is recorded by Hitachi software.
Chemicals and Reagents: Formulation tablets are purchased from a local pharmacy and the reference standard of Clobazam was provided by Reyan Pvt. Ltd. All the reagents used like chloranilic acid, ARS and WFBBL are analytical grade and were purchased from Merck specialities Pvt. Ltd., Mumbai.
Preparation of working standard drug solution
The standard CBZ (100 mg) is weighed accurately and transferred to volumetric flask (100 mL). It is dissolved properly and diluted up to the mark with methanol to obtain final concentration of 1000 μg/mL (stock solution I). 10 mL of stock solution I is diluted to 100 mL with Methanol (Stock solution II, 200 μg/mL) and the resulting solution is used as working standard solution.
Preparation of sample solution
An amount of finely ground tablet powder equivalent to 100 mg of CBZ (Frisium-20 mg) is accurately weighed into a 100 mL calibrated flask, 60.0 mL of methanol is added and shaken for 20 min. Then, the volume is made up to the mark with water, mixed well, and filtered using a Whatmann No 42-filter paper. First 10.0 mL portion of the filtrate is discarded and a suitable aliquot of the subsequent portion (1000 μg mL-1 CBZ) is diluted appropriately to get suitable concentrations for analysis by proposed methods
Method development
Optimized conditions for method development are identified by making different trails by varying one of the parameters such as concentration of standard, volume of the reagents, temperature and time for color development and keeping other as constant, and the optimized procedures are presented.
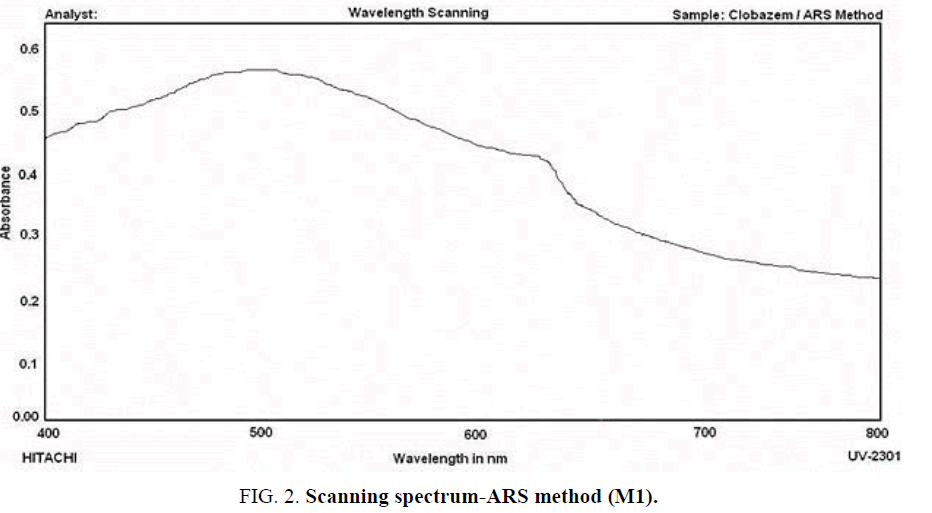
ARS Method (M1): In a 125 mL separating funnel aliquot of the drug solution, 6.0 mL of 1N HCl solution and 2.0 mL of 0.2% ARS solution are taken successively and the volume of the aqueous phase is made to 15.0 mL with double distilled water and then 10.0 mL of chloroform is added and the contents are shaken thoroughly for 2 min. The two phases are allowed to separate and the chloroform layer is collected and its absorption against a reagent blank is scanned from 400 nm to 800 nm and maximum absorbance is found at 502 nm. The scanning spectrum of the chromophore solution developed is presented as ( Figure 2).
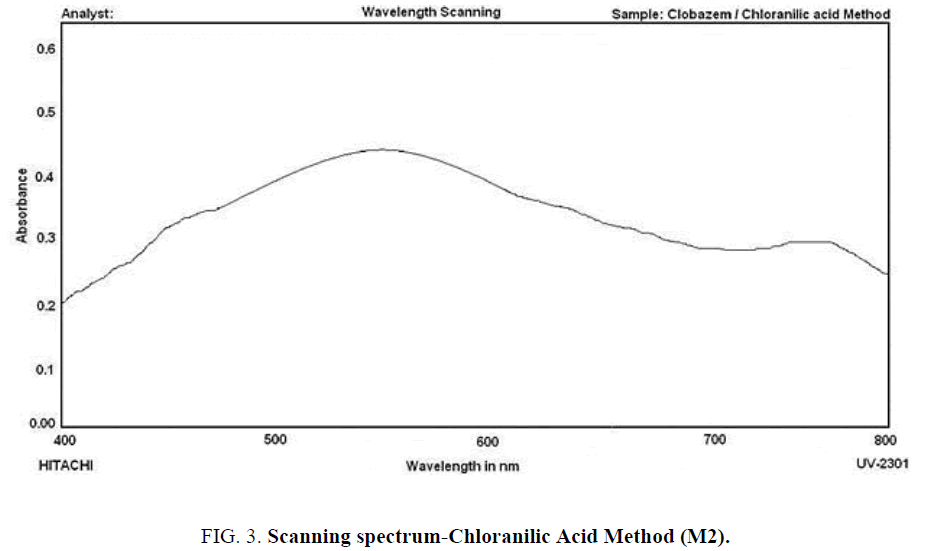
Chloranilic acid method (M2): To the aliquot of the standard drug solution in a 10.0 mL graduated tube, 2.0 mL of 0.1% methonolic solution of Chloranilic Acid is added and kept undisturbed for 5 min and then the contents are made up with methanol. The absorbance of the resulting solution against a reagent blank is scanned between 400 nm to 800 nm and maximum absorbance is found at 550 nm. The scanning spectrum is shown below as ( Figure 3).
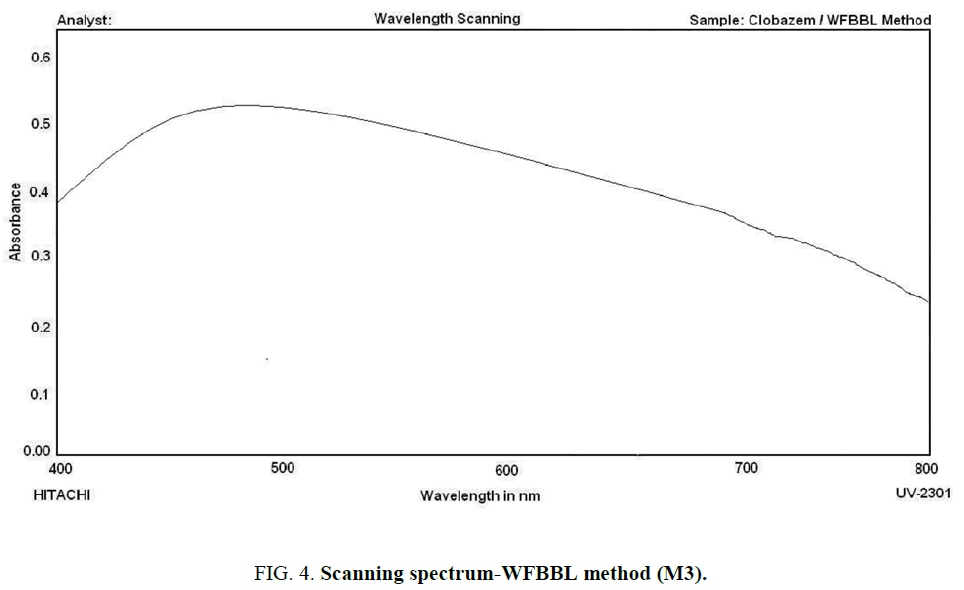
WFBBL method (M3): The aliquot of the drug solution taken in a 125 mL separating funnel is acidified with 6.0 mL of 1N HCl and to it added 2.0 mL of the dye solution and the volume is made to 15.0 mL with distilled water and to it 10.0 mL of chloroform is added and the contents are shaken well for 2 min. The two phases are then allowed to settle and the absorbance of the organic layer is scanned against a similar reagent blank from 400 nm to 800 nm and the maximum absorbance is found at 487 nm. The recorded scanning spectrum is presented below as (Figure 4).
Method validation
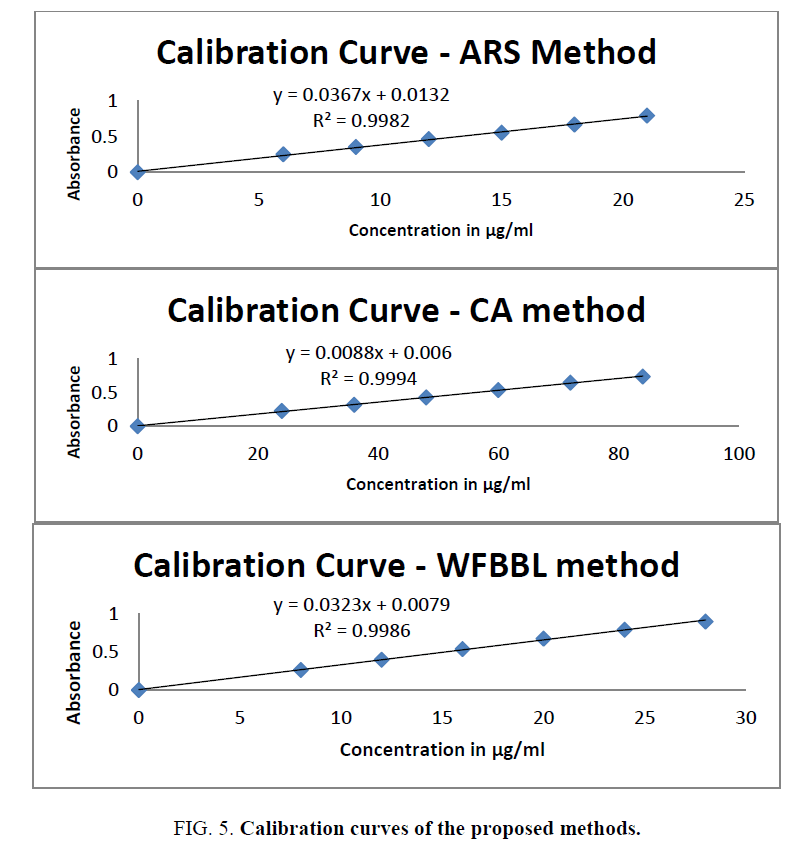
The three proposed spectrophotometric methods are validated by determining their range of linearity, precision, accuracy, ruggedness and the sensitivity as per ICH guidelines. The optical parameters of the proposed methods are given in Table1 and the observed absorbance of the developed colour in the linearity range is given in Table 2. The calibration curves are shown in (Figure 5).
| S.No. | Optical Parameter | ARS Method (M1) | CA Method (M2) | WFBBL Method (M3) |
|---|---|---|---|---|
| 1. | Wavelength Maxima | 502 nm | 550 nm | 487 nm |
| 2. | Molar Absorptivity(mol-1 cm-1) | 1.1 × 10⁴ | 2.6 × 10³ | 1.0 × 10⁴ |
| 3. | Sandell’s Sensitivity(μg cm-1) | 2.732 × 10⁻² | 1.121 × 10⁻³ | 2.979 × 10⁻² |
| 4. | Linearity Range(μg/mL) | 6.0-21.0 | 24.0-84.0 | 8.0-28.0 |
Table 1: Determination of BKB in pharmaceutical formulation (n=5, t0.05,4=2.78).
| S.No. | ARS Method (M1) | CA Method (M2) | WFBBL Method (M3) | |||
|---|---|---|---|---|---|---|
| Concentration (μg/mL) |
Absorbance | Concentration (μg/mL) |
Absorbance | Concentration (μg/mL) |
Absorbance | |
| 1. | 6.0 | 0.248 | 24 | 0.226 | 8.0 | 0.264 |
| 2. | 9.0 | 0.352 | 36 | 0.318 | 12.0 | 0.397 |
| 3. | 12.0 | 0.462 | 48 | 0.426 | 16.0 | 0.534 |
| 4. | 15.0 | 0.551 | 60 | 0.534 | 20.0 | 0.672 |
| 5. | 18.0 | 0.667 | 72 | 0.643 | 24.0 | 0.786 |
| 6. | 21.0 | 0.789 | 84 | 0.735 | 28.0 | 0.894 |
| Slope:0.03 | 0.008 | 0.032 | ||||
| Intercept:0.013 | 0.005 | 0.0079 | ||||
| CC:0.999 | 0.9996 | 0.9992 | ||||
Table 2: Linearity results of the methods.
Pure drug solutions of a concentration in the linearity range are analyzed and being repeated for six times on the same and different days and the precision of the proposed methods are evaluated. The relative standard deviation of both intra and inter day analysis revealed that all the three proposed methods are of high precision. The details are given in Table 3.
| S. No. | Intraday Precision | Inter day Precision | ||||
|---|---|---|---|---|---|---|
| Method | ARS | CA | WFBBL | ARS | CA | WFBBL |
| Concentration | 15.0μg/mL | 48.0μg/mL | 16.0μg/mL | 15.0μg/mL | 48.0μg/mL | 16.0μg/mL |
| 1 | 0.549 | 0.428 | 0.537 | 0.558 | 0.432 | 0.528 |
| 2 | 0.548 | 0.425 | 0.536 | 0.555 | 0.431 | 0.521 |
| 3 | 0.552 | 0.427 | 0.533 | 0.557 | 0.429 | 0.524 |
| 4 | 0.550 | 0.423 | 0.535 | 0.554 | 0.43 | 0.526 |
| 5 | 0.546 | 0.422 | 0.532 | 0.556 | 0.433 | 0.525 |
| 6 | 0.547 | 0.424 | 0.531 | 0.553 | 0.436 | 0.527 |
| %RSD | 0.39 | 0.54 | 0.44 | 0.33 | 0.57 | 0.47 |
Table 3: Precision study results of the proposed methods.
By carrying out recovery tests by adding known quantities of the drug to the pre-analyzed samples, the accuracy of the proposed methods are checked and the average recovery percent within acceptable range (98.0-102.0) ensured that the proposed methods are accurate. The percentage average recovery of ARS method is 100.96, and that of CA and WFBBL methods are 100.70 and 100.63 respectively indicating that these methods are accurate enough to adopt for the routine analysis of clobazam. Closeness of the results to 100% showed the fairly good accuracy of the methods. The results are presented in Table 4,
| Method | Concentration in μg/mL |
Amount found in μg/mL | % of recovery | Average Recovery |
|---|---|---|---|---|
| ARS Method |
9.0 | 9.11 | 101.13 | 100.96 |
| 12.0 | 12.11 | 100.93 | ||
| 15.0 | 15.12 | 100.84 | ||
| CA Method |
36.0 | 36.37 | 101.04 | 100.70 |
| 48.0 | 48.22 | 100.46 | ||
| 60.0 | 60.35 | 100.60 | ||
| WFBBL Method |
12.0 | 12.11 | 100.92 | 100.63 |
| 16.0 | 16.12 | 100.77 | ||
| 20.0 | 20.05 | 100.23 |
*average of five determinations
Table 4 : Recovery results of the proposed method.
By comparing the results of the recovery studies of these methods, it is found that the F-values (2.51, 1.83, 1.62 for ARS, CA and WFBBL methods respectively) are lower than the theoretical value (2.59) indicating that there is no significant difference in precision between the proposed methods and reference method [5]. The calculated t-values 1.18, 1.24, 1.16 for the above three methods are lower than the literature value (1.63 at 95% confidence) indicating that there was no significant difference found between the proposed methods and reference method at 95% confidence level. This indicated the similarities between the proposed and the reference method for the determination of the drug. Hence, the proposed methods are precise and accurate.The limit of detection and limit of quantification values for the proposed methods confer that ARS method is more sensitive than WFBBL and CA methods which are relatively sensitive than the methods reported earlier. The proposed ARS method is suitable to quantify clobazam accurately up to 1.5 μg/mL, WFBBL method up to 2.0 μg/mL and CA method quantifies an amount of 6.0 μg/mL of clobazam. These results demonstrated that the analyses were being performed in a region above the quantification limit value. The sensitivity results of the methods are presented below in Table 5.
| Method | ARS | CA | WFBBL |
|---|---|---|---|
| LOD (μg/mL) | 0.45 | 1.8 | 0.6 |
| LOQ (μg/mL) | 1.5 | 6.0 | 2.0 |
Table 5: Sensitivity of the proposed methods.
Application to analysis of commercial sample
To verify the validity of the proposed methods, marketed formulation (Frisium) of clobazam was selected and the amount of CBZ was determined and the results are given in Table 6. From the sample solution (formulation), three differently concentrated solutions are prepared based on different linearity concentration ranges. For ARS method 15 μg/mL solution, for CA method 48 μg/mL and for WFBBL 16 μg/mL solutions are prepared. In all the three reported methods, the assay was found to be more than 99.0%. From the results, it is clear that there is a good agreement between the results obtained by the proposed methods and the labeled amounts in the commercial samples.
| S.No. | Method | Formulation | Amount prepared μg/mL |
Amount found μg/mL |
% Assay |
|---|---|---|---|---|---|
| 1 | ARS | Frisium | 15 | 14.96 | 99.7 |
| 2 | CA | Frisium | 48 | 47.95 | 99.8 |
| 3 | WFBBL | Frisium | 16 | 15.84 | 99.0 |
Table 6: %Assay in commercial sample.
Conclusion
The proposed methods for the assay of clobazam are found to be simple, sensitive, precise, accurate, robust, rugged and linear over a suitable range. The proposed Spectrophotometric methods are of wide applicability due to the longer stability of the formed colored complexes. The tablet dosage forms were analyzed successfully and the assay was simple, rapid and found to be within the preferred limits. Hence, the reported methods can be applied for the quality analysis of clobazam formulations.
References
- Remy C. Clobazam in the treatment of epilepsy: A review of the literature. Epilepsia. 1994;35:88-91.
- Souri E, Farahani AD, khaniha RA, et al. A stability indicating HPLC method for the determination of clobazam and its basic degradation product characterization. Daru J Phar Sci. 2014;22(49):1-7.
- Gowri Bala Kumari K, Vanilatha S, Mary Theresa M, et al. RP-HPLCmethod development and validation for the analysis of clobazam in pharmaceutical dosage forms.J A Mol.2011;1(1):55-63.
- Sailaja O, Aruna R, Durga J. RP-HPLC method development and validation for the estimation of clobazam in the tablet dosage form.A J Sci Tech.2014;1(2):153-60.
- Dhana Sree M. Analytical method development and validation of clobazam by using UV spectrophotometric method. The Exp.2012;1(1):22-8.
- Umamaheswar K, Ramu G, Rambabu C. Development of liquid chromatographic and visible spectrophotometric methods for the estimation of clobazam in tablet dosage forms. Int J Phar.2015;5(1):137-45.
- Knapp J, Boknik P, Gumbinger H, et al. Quantitation of clobazam in human plasma using high-performance liquid chromatography. J Chrom Sci.1999;37:145-9.
- Bolner A, Tagliaro F, Lomeo A. Human plasma with extraction and high-performance liquid chromatography analysis. J Chr B.2001;750(1):177-80.
- Dhana Sree M, ReenaS, Aravind G. Int JResRevPharAppSci.2012;2(4):751-59.
- Gazik WR, Podlesany J, Filipek M. HPLC method for simultaneous determination of clobazam and N-desmethylclobazam in human serum, rat serum and rat brain homogenates. Biomed Chrom.1989;3(2):79-81.
- Zilli MA, Nisi G. Simple and sensitive method for the determination of clobazam, clonazepam and nitrazepam in human serum by high-performance liquid chromatography. J Chrom B Biomed Sci Appl.1986;378:492-7.
