Original Article
, Volume: 13( 1)Investor Sentiment and Stock Return: Evidence from Chinese Stock Market
- *Correspondence:
- Feng Junwen, School of Economics and Management, Nanjing University of Science and Technology, Nanjing Jiangsu 210094, China
Tel: 08602584315093; E-mail: 313472714@qq.com
Received: January 16, 2017; Accepted: January 27, 2017; Published: February 04, 2017
Citation: Feng Junwen?Li Xinxin. Investor sentiment and stock return: evidence from Chinese stock market. Biotechnol Ind J. 2017;13(1):123.
Abstract
This paper selects the trading volume data from January 2010 to December 2014 to study investor sentiment and regard the market daily earnings ratio of Shanghai Stock Exchange A-shares index as stock return. Using ARMA model to research its own characteristics of investor sentiment, then use VAR model and Granger causality test, impulse response function and variance decomposition to research the relationship between investor sentiment and the market returns, thereafter empirical results show that two series have Granger causal relationship exist between each other. Then the heteroscedastic EGARCH model tests the impact of the returns on investor sentiment, and the “bad news” in the market can cause greater volatility than “good news”; Finally, the EGARCH-M heteroscedastic model shows that the impact of investor sentiment to returns exist “risk premium” phenomenon.
Keywords
Investor sentiment; Stock return; Granger causality test; Heteroscedastic model
Introduction
The central premise of traditional financial theory is that investors are completely rational. In 1950s, the research field of psychology began to expand to cognitive psychology and social psychology. In this context, behavioral finance theory and experimental economics began to rise. They were based on the real psychological activities and decision-making process of the investors, and they found that the decision-making process is actually the process of risk versus return on the psychological. China's stock market development time is short, institution building is not sound. As an important part of behavioral finance theory, research on interactive relationship between investor sentiment and stock return helps improve our existing behavioral finance theory system, and further revealing the inherent relationship between the stock market investor behavior and decisions related to stock market data and stock market gains. It can provide a more abundant foundation for the research on asset price formation, and provide a useful theoretical support to control our financial markets.
The research ideas of this paper are as follows: firstly, the paper reviews the existing research on investor sentiment and stock market returns of domestic and foreign, and then introduces the data and model tools used in this paper. Then, introduce the research methods, including the ARMA model, VAR model and EGARCH model. Finally, empirical analysis is carried out to study the dynamic relationship between investor sentiment and stock market returns and the mutual influence of the two in our country.
The innovation of this paper is that the study of the impact of investor sentiment and stock return in China and abroad are mostly selected only one aspect, this paper will be more than one model for the integration of research, the content is rich and the sample data are up to date.
Literature Review
Summary of foreign research literature
The empirical research on the investor sentiment and return of foreign research literature mainly adopt the extended ARCH model and the extended GARCH model to study the volatility of return rate. Nelson [1] overcomes the drawback of GARCH model, and proposes a more simple and flexible asymmetric ARCH dynamic model. Lee et al. [2] used the GARCH model to analyze the impact of investor sentiment on market volatility, and found that the decline of investor sentiment could lead to a more intense volatility in the market. Baker and Wurgler [3] define investor sentiment as a pessimistic or optimistic view of the future price of the stock, or a speculative tendency, which is driven by the investment demand and decision-making will have an impact on the stock price, and also confirmed that the trading volume can be used as an effective indicator of investor sentiment. Gerhard Kling and Lei Gao [4] select China's Shanghai stock exchange daily data to study the Chinese institutional investors, found that in the short term, institutional investor sentiment has a positive feedback effect, but there is no association in the long term. At the same time, their research reveals the volatility of investor sentiment in the system response by using the EGARCH model, the decline in investor sentiment will strengthen the market volatility and instability, but did not find its influence on predicting the market expected earnings.
Review of domestic literature
Rao Yulei et al. [5] choose CCTV BSI index to do the empirical research and they found there is no significant relationship between CCTV BSI index and the expected stock return. But Wang Meijin et al. [6] also use the BSI index to indicate the investor sentiment, the empirical results show that investor sentiment can not only significantly affect the stock market return, but also can make a significant negative correction to the volatility of earnings. Cheng Kun et al. [7] select the "good light index" to construct the investor sentiment index which released by ?Dynamic analysis of stock market?. The empirical results show that the intermediate sentiment index is the Granger cause of the stock market returns, and the two does not exist mutual feedback effect. At the same time, the results of impulse response and variance decomposition show that the impact of the medium-term investor sentiment on the stock market volatility is stronger than the short-term investor sentiment. Liu Xiao et al. [8] select the GARCH model to conduct research, and EGARCH (3,1) model was used to study the volatility of stock index in Shenzhen stock market at last, and the relevant policy recommendations were put forward. Huang Guanyao [9] selected Shanghai securities composite index to fit and forecast accuracy of four GARCH models on the volatility of the stock market to make a comparative study. Li Xindan et al. [10] used the same index and found that ARCH effect existed in investor sentiment, at the same time investor sentiment has a certain degree of “spillover effect" on the stock market returns. Yang Shu’e and Zhang Qiang [11] selected the discount of closed-end fund investors, growth rate and turnover rate to construct comprehensive sentiment index of investor sentiment, based on the noise trading theory model (DSSW model) proposed by Delong in 1990, using GARCH-M (1,1) to study whether Chinese investor sentiment has influence on the stock market return and the empirical results showed that institutional investor sentiment is the main factor affecting the stock price, while individual investors are not significant, and knocked down the influence of individual investor sentiment on small cap stocks. Yang Yang and Wan DiFang et al. [12] select BSI index and turnover rate to reflect investor sentiment, analyzed investor sentiment and stock market return and its volatility in different market state, empirical findings showed that stock return has significant impact on investor sentiment, not vice versa; and investor sentiment has asymmetric impact on stock return during the bear market, but the bull market does not exist. Chi Lixu et al. [13] select the fund's capital flows to construct the investor sentiment index, using the panel data model to study the relationship between investor sentiment and stock returns. The empirical results showed that extreme emotions in China's stock market has a unique ability to predict, the impact of investor sentiment is asymmetric, and reasonable sentiment index is conducive to our securities investors and regulators to make better decisions. Xia Fang [14] combined investor sentiment with the behavior of managers to study the problem of the stock mispricing. Wang Liping [15] choose the macro point of view, using principal component analysis method to construct a comprehensive investor sentiment, introducing the expected theory, using linear regression model to study the impact of interest rate surprises, investor sentiment on the stock index returns, and found that investor sentiment can enhance the impact of policy variables on the stock index returns.
Recently, Zhang Wei et al. [16] examined the relations between the daily happiness sentiment extracted from Twitter and the stock market performance in 11 international stock markets. By partitioning this happiness sentiment into quintiles from the least to the happiest days, they first shown that the contemporary correlation coefficients between happiness sentiment and index return in the 4 and most-happiness subgroups were higher than that in least, 2 and 3-happiness subgroups. Secondly, the happiness sentiment can provide additional explanatory power for index return in the most-happiness subgroup. Thirdly, the daily happiness can granger-cause the changes in index return for the majority of stock markets. Fourthly, they found that the index return and the range-based volatility of the most-happiness subgroup are larger than those of other subgroups. These results highlight the important role of social media in stock market. Zhang Yongjie et al. [17] advocated the provincial TV audience rating as the novel proxy for the provincial investor sentiment (PIS) and investigate its relation with stock returns. The empirical results firstly shown that the PIS is positively related to stock returns. Secondly, they provided direct evidence on the existence of home bias in China by observing that the provincial correlation coefficient is significantly larger than the cross-provincial correlation coefficient. Finally, the PIS can explain a large proportion of provincial co movement. To sum up, all these findings support the role of the non-traditional information sources in understanding the “anomalies” in stock market.
Sample selection and data sources
Investor sentiment is not only an immediate reflection of the current stock market returns, but also an expectation of future market prices. According to index data sources, it is generally divided into two categories, one is through direct questionnaire survey related investors to obtain direct indicators, such as "good light index" which released by ?Dynamic analysis of stock market?; the other is indirect indicator of investor sentiment change by collecting relevant financial data from the financial markets. Direct indicators are subject to the constraints of their own circumstances, the investigation object is limited. Coverage is small and cannot guarantee its authenticity. This paper selects trading volume as measure index has two advantages: first of all, the main one of the direct performance of the investors' psychological decision-making behavior is the change of the trading volume; secondly, the trading volume as a daily data has continuity, which has obvious advantages in the study of the emotional trend of investors.
This paper selects the change of trading volume between January 2010 to December 2014 to express the investor sentiment.
The calculation formula is as follows:
Investor sentiment change = (current trading volume-volume of the previous period) /volume of the previous period
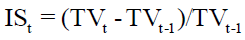
Among them, ISt represents the investor sentiment change, TVt represents the trading volume of period t, TVt-1 represents the trading volume of period t-1.
This paper selects Shanghai Stock Exchange A shares index to represent the market return, the calculation formula is as follows:
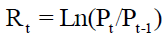
Among them, Rt represents the logarithmic return of the Shanghai Stock Exchange A shares index at the t day; Pt represents date closing price of the Shanghai Stock Exchange A shares index at the t day; Pt-1 represents date closing price of the Shanghai Stock Exchange A shares index at the t-1 day. The data source is RESSET database, and the analysis tool is Eviews 4.0 and Excel 2007.
Research Design
Data characteristics of investor sentiment
Table 1 reports the numerical characteristics of investor sentiment. Investor sentiment time series’ skewness is 1.3366, which is in a left skewed distribution; Kurtosis is 7.0692, which has obvious peak characteristics. So, the investor sentiment sequence has obvious leptokurtic heavy tail feature, and most of the financial data is similar. The Jarque-Bera statistic rejected the normal distribution hypothesis at the level of 0.0000.
| Variate | Mean | Median | Minimum | Maximum | Standard Deviation | Skewness | Kurtosis | Jarque-Bera statistic |
|---|---|---|---|---|---|---|---|---|
| IS | 0.0202 | -0.0104 | -0.4312 | 1.4947 | 0.2080 | 1.3366 | 7.0692 | 1197.092 |
| Note: The significance level of JB statistic is 0.0000 | ||||||||
Table 1: Numerical Characteristics of Investor Sentiment.
Model building
Firstly, considering the mutual influence between the investor sentiment and the stock index return, this paper selects the vector auto regressive (VAR) model to analyze the dynamic relationship. The VAR model with a lag phase k of N variables is expressed as follows:
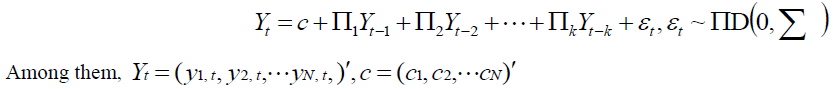
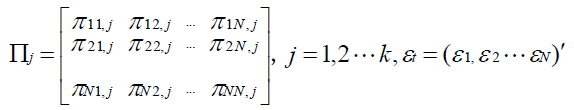
Yt is N×1 order time column vector, and c is N×1 order constant column vector.  are all N × N order parameter matrix,
 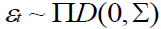 is N × 1 order random error column vector. This paper constructs the two element VAR model of investor sentiment and stock index, according to the AIC, HQIC and SBIC criterion, this paper chooses the lag period for the three orders. The results of the VAR model's stationary test are all located in the unit circle, so the VAR model is stable, which provides a basis for the following Granger causality test, impulse response function analysis and variance decomposition.
Secondly, this paper studies the asymmetric impact of stock market returns on investor sentiment and the impact of investor sentiment volatility on the investor's income. Based on the test results of VAR model, the model used in this paper is built with ARMA model and EGARCH model.
ARMA (p, q) model is the auto-regressive moving average model, and the general ARMA (p, q) can be expressed as the following form:

Among them,  is the white noise process for the variance
  , c is the constant term,
  and
and  represents the auto regression coefficient and the moving average respectively. ARMA model can better understand the data characteristics of the investors' sentiment, and it is the basis of the study of the mutual influence of investor sentiment and stock index returns. This paper uses the system estimation method proposed by Boakes and Jenkins (Box-Jenkins, 1976) and determine the ARMA (1,1) model.
ARMA (1,1) model is used to analyze the ARCH-LM test, and it is found that there is a significant heteroscedastic in the investor sentiment series, at the same time, the non symmetry of the financial time series is considered, so this paper uses one of the asymmetric GARCH model, EGARCH model to do the further research.
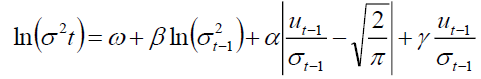
The conditional variance equation of the EGARCH model is expressed as follows:
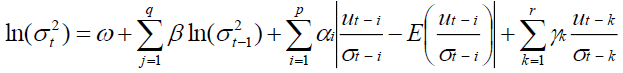
The left side of the equation is the logarithm of the conditional variance, which means that the leverage effect is exponential, so the forecast value of the conditional variance must be non-negative. The existence of the leverage effect can be tested by the hypothesis of γ<0. Compare with the GARCH model, there is no limit to this equation, and the process is more simple and flexible.
Empirical Results and Analysis
Time series stationary test
From the theory of econometrics, the false regression problem could be generated by using the non-stationary economic variables to establish the regression model, so it is necessary to conduct time series stationary test. This paper selects ADF(Augmented Dickey-Fuller) test method and results are shown in Table 2, t statistics value is less than the results of unit root test on every significance level, so it can be used to determine the sequence of investor sentiment sequence IS and the logarithm of the daily yield sequence R is a stationary time series.
| Objects | ADF Test Statistic | 1% Significance Level | 5% Significance Level | 10% Significance Level | Through Test (Y/N) |
|---|---|---|---|---|---|
| IS | -19.76898 | -3.4386 | -2.8644 | -2.5683 | Y |
| R | -14.96081 | -3.4386 | -2.8644 | -2.5683 | Y |
Table 2: ADF unit root test results.
Granger causality test
Granger causality test can analyze the causal relationship between two stationary time series X and Y. Test methods are as follows: To estimate the current value of Y is the value of the degree of its own lag can be explained, and then verify that through the introduction of hysteresis value whether the sequence X can improve the degree of Y is explained. If it is, then the sequence X is the Granger reason of Y and the lag coefficient of X has a significant statistical characteristics. Granger causality test results of investor sentiment and market returns are shown in Table 3.
| Null Hypothesis | ?2 Statistic | P Value | Conclusion |
|---|---|---|---|
| R is not the Granger reason of IS | 124.8307 | 0.0000 | Reject the null hypothesis |
| IS is not the Granger reason of R | 11.0867 | 0.0113 | Reject the null hypothesis |
Table 3: Granger causality test results.
As can be seen from the table, there is a two-way Granger causality between the return rate of stock index R and investor sentiment IS, and R has a more significant. impact on investor sentiment IS.
Impulse response function analysis and variance decomposition
The impulse response function describes the impact of a VAR model endogenous variables to other endogenous variables brought and analyzes the effects when an error term changes, or the model is affected by the dynamic effects of a certain impact on the system. And the variance decomposition is to analyze the contribution of each structure impact on the internal variable, and the importance of the impact of different structures is further evaluated.
Figure 1 shows the response of the stock index return to the impact of investor sentiment. As can be seen from the figure, the stock index return rate to the investor sentiment impulse response reached the maximum in the fourth period, at this time, when the investor sentiment appeared 1 percentage points of the positive impact, will make the stock market yield increased by 0.001 percentage points, followed by a rapid reduction in the impact, and showed signs of convergence to zero. In Table 4 of the variance analysis results, the contribution of investor sentiment after the first six stabilized and the impact of the stock market's contribution rate is 9.88%.

Figure 1: R response function for IS.
| Period | S. E. | IS | R |
|---|---|---|---|
| 1 | 0.189821 | 100.0000 | 0.000000 |
| 2 | 0.205408 | 91.46631 | 8.533694 |
| 3 | 0.207378 | 90.39173 | 9.608273 |
| 4 | 0.207921 | 90.12818 | 9.871823 |
| 5 | 0.208617 | 90.18945 | 9.810547 |
| 6 | 0.208745 | 90.11920 | 9.880795 |
| 7 | 0.208758 | 90.11316 | 9.886838 |
| 8 | 0.208762 | 90.11085 | 9.889152 |
| 9 | 0.208767 | 90.11130 | 9.888700 |
| 10 | 0.208768 | 90.11075 | 9.889254 |
Table 4: Results of stock index return variance decomposition (%).
Figure 2 describes the response of the investor sentiment to the stock market shock. When earnings appear one percentage point positive impact, the investor sentiment in the current period did not respond, and rise to a maximum positive response rapidly after one period, indicating that the response of investor’s sentiment has lagged behind. In the third phase, a relatively weak reverse response, followed by a rapid reduction of the impact, and showing signs of convergence of the zero effect. In the analysis of variance results in Table 5, the contribution of stock index return to stability after the fifth period and the impact of the stock market's contribution rate is 8.70%.

Figure 2: R response function for IS.
| Period | S.E. | IS | R |
|---|---|---|---|
| 1 | 0.011911 | 7.880601 | 92.1194 |
| 2 | 0.011932 | 8.193595 | 91.80641 |
| 3 | 0.011935 | 8.243893 | 91.75611 |
| 4 | 0.01196 | 8.620877 | 91.37912 |
| 5 | 0.011967 | 8.705837 | 91.29416 |
| 6 | 0.011969 | 8.70734 | 91.29266 |
| 7 | 0.011969 | 8.707286 | 91.29271 |
| 8 | 0.011969 | 8.710785 | 91.28921 |
| 9 | 0.011969 | 8.711305 | 91.2887 |
| 10 | 0.011969 | 8.711316 | 91.28868 |
Table 5: Results of investor sentiment variance decomposition (%).
Asymmetric effect of stock market returns on investor sentiment
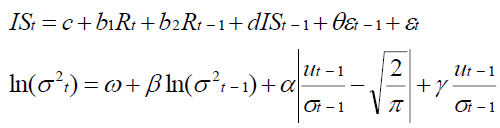
The results of VAR model test found that two-stage investor returns lagged effect on investor sentiment is not significant, but the first order is significant, so the stock market returns research model of investor sentiment should contain the first-order and the EGARCH model and the conditional variance accordingly constructed as follows:
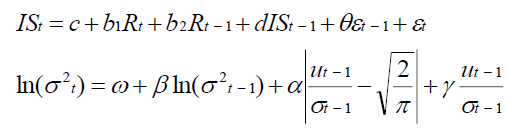
Among them, c is the constant term, b1and b2 are the affecting coefficients of the investor return. The above formula, only considering the effect of investor returns, it should also take into account changes in investor sentiment itself, under the conditions of constant variance, adding expression to adjust the model change in investor sentiment itself as follows:
The EGARCH model and the adjusted EGARCH model are estimated respectively, and the results are shown in Table 6.
| Coefficients | The adjusted EGARCH model | The simple EGARCH model |
|---|---|---|
| c | 0.019909 (0.0000) | 0.022486 (0.0006) |
| b1 | 3.939685 (0.0000) | 3.793221 (0.0000) |
| b2 | 2.316955 (0.0000) | 3.799692 (0.0000) |
| d | 0.354395 (0.0000) | —— |
| θ | -0.753634 (0.0000) | —— |
| ω | -2.289985 (0.0035) | -0.115505 (0.0000) |
| β | 0.353428 (0.0129) | -0.845903 (0.0000) |
| α | 0.114408 (0.0140) | 0.139897 (0.0001) |
| γ | -0.118994 (0.0039) | -0.020535 (0.1008) |
| R2 | 0.232205 | 0.095102 |
| Note: The values in parentheses are showing significant levels, R2 represents statistic model fit test. | ||
Table 6: Results of the EGARCH model estimation.
As can be seen by the table, the adjusted R2 has improved significantly.
In the adjusted EGARCH model, γ is significantly negative, which shows that the stock return has asymmetrical impact on investor sentiment, "bad news" can produce a greater volatility than the same amount of "good news", negative expected return on the impact of sentiment generated by investor sentiment is greater than the positive expected rate of return, it is also the performance of under-reaction and over-reaction.
The impact of investor sentiment volatility on stock return
In the results of the VAR model, there is no significant effect of investor sentiment on the stock return of the first order to the three order, so in the study of the impact of investor sentiment on the investment income model, only containing the current term, after taking into account the change in investor sentiment itself, EGARCH-M (1,1) model expression adjusted as follows:
Among them, C1 is a constant term, b3 is the influence coefficient of investor sentiment, estimating EGARCH-M (1,1) model and adjusted EGARCH-M (1,1) model respectively, the results are shown in Table 7:
| Coefficients | The adjusted EGARCH model | The simple EGARCH model |
|---|---|---|
| c1 | -0.036365(0.0000) | -0.029591(0.0000) |
| b3 | 0.014482 (0.0000) | 0.014598(0.0000) |
| δ | 3.233960(0.0000) | 2.561386(0.0000) |
| d1 | 0.937230(0.0000) | —— |
| θ1 | -0.887827(0.0000) | —— |
| ω | -2.414240(0.0001) | -3.108049(0.0032) |
| β | 0.739328(0.0000) | 0.662340(0.0000) |
| α | 0.107522(0.0003) | 0.123422(0.0004) |
| γ | -0.030568(0.0529) | -0.003579(0.8260) |
| R2 | 0.075895 | 0.071109 |
| Note: The values in parentheses are showing significant levels, R2 represents statistic model fit test | ||
Table 7: Results of EGARCH model estimation.
As can be seen by the table, significant level of each statistic in the adjusted model has improved significantly, and fit statistics R2 also increased. The risk premium is significant, which shows that the change of investor sentiment has a significant positive correlation with the earnings of investors, this is the same as Wang Mei jin(2004) 's research, also shows that investors in the stock market volatility requires higher returns.

Conclusion and Revelation
This paper selects the trading volume data from January 2010 to December 2014 to study investor sentiment and regard the market daily earnings ratio of Shanghai Stock Exchange A-shares index as stock return, using ARMA model to research its own characteristics of investor sentiment, integrating the VAR model, expanded heteroscedastic EGARCH model and EGARCH-M heteroscedastic models to do the empirical test, results are as follows: Firstly, in the dynamic relationship between investor sentiment and market returns, investor sentiment and market returns have Granger causal relationship exist between each other, and the effect of market return on investor sentiment is more significant. In a positive impact on investor sentiment, the stock market returns slowly to generate the same response; and in the positive impact of market returns, investor sentiment rapidly generate the same response and reach the maximum the second period, which shows that the emotional response of investors in China is lagging behind. Secondly, the impact of stock market returns on investor sentiment is asymmetric, that is, the negative market expectations will produce a greater investor sentiment volatility than the positive expectations, and also shows that China's investors have a loss aversion effect. Finally, investor sentiment has a significant positive correlation with stock return, and the "risk premium" effect of the stock market is also existed in our country.
References
- Daniel NB. Conditional Heterosdasticity in Asset Returns: A New Approach. Econmonetrica. 1991;59:347-70.
- Lee WY, Jiang CX, Indro DC, et al. Stock market volatility, excess return, and the role of investor sentiment. J Bank Financ. 2002;2277-99.
- Baker M, Wurgler J. Investor Sentiment and the Cross-Section of Stock Returns. J Financ. 2006;61:1645-80.
- Kling G, Lei Gao. Chinese Institutional Investors’ Sentiment. 2008;18:374-87.
- Yulei R, Dafeng L. Behavioral Finance. Shanghai. Shanghai University of Finance and Economics Press. 2003;144-55.
- Meijin W, Jianjun S. Stock Market Returns. Volatility and the Role of Investor Sentiment in China. Econom Res J. 2004;10:75-83.
- Kun C, Renhe L. A Study of the Interactional Relationship between the Investor Sentiment and the Stock Markets. Shanghai J Econom. 2005;11:86-93.
- Xiao L, Yiming L. The application of GARCH family model in the story -Study on Shenzhen Component Index Volatility. Technoeconomics Manag Res. 2005;5:36-8.
- Guanyao H, Rui C. Non-linear study of stock market volatility in China-Compare findings from GARCH Models. Technoeconomics and Management Research. 2007;2:56-9.
- Chaohui W, Xindan L. Investor sentiment volatility and stock returns in China. Journal of Ningbo University. Humanities and Social Sciences Edition. 2008;11:89-98.
- Qiang Z, Shu’e Y. Noise trading, investor sentiment volatility and stock returns. Sys Eng Theory Prac. 2009;3:40-7.
- Yang Y, Difang W. Relationship among investor sentiment. Stock market return and volatility in different market states. Sys Eng. 2010;1:19-23.
- Lixu C, Xintian Z. A study on the relationship between investor sentiment and the stock market returns in China-Based on Panel Data Model. Manag Rev. 2011;6:41-8.
- Fang X. Research on investment-cash flow sensitivity from the respective of mispricing. Sys Eng. 2012;7:111-6.
- Liping W. The effect of interest surprise on stock index returns-based on investor sentiment. Journal of Taiyuan Normal University. 2014;9:67-70.
- Zhang W, Li X, Shen D, et al. Daily happiness and stock returns: Some international evidence. Physica A: Statistical Mechanics and its Applications. 2016;460:201-9.
- Zhang Y, Zhang Y, Shen D, et al. Investor sentiment and stock returns: Evidence from provincial TV audience rating in China. Physica A: Statistical Mechanics and its Applications. 2017;466:288-94.