Research
, Volume: 16( 1) DOI: 10.37532/0974-7451.2020.16(1).104Computational Investigation of the Ranges of Wastes Digested by Different Water Sources
- *Correspondence:
- NN Subrahmanyeswara Rao
Department of Chemical Engineering
Gayatri Vidya Parishad College of Engineering (Autonomous)
Vishakapatnam, India
Tel: (+91) 6352379635
E-Mail: subbu813@gmail.com
Received: January 22, 2020; Accepted: January 23, 2020; Published: February 25, 2020
Citation: Rao NNS. Computational Investigation of the Ranges of Wastes Digested by Different Water Sources. Indian J Environ Sci. 16(1):104.
Abstract
Pollution of water is still a major concern across the globe. Different studies have shown the cause of pollution as the discharge of untreated industrial wastes, consumption of many things, and lack of efficient waste management. All the water sources somehow managed to survive based on their purification capacities. But continuous discharge of different types of wastes made the existing condition of sources still worse. This triggered the need to test the limits of discharged wastes into the sources within their ability to purify themselves. The author carried out this using MATLAB simulations along with the existing literature on different parameters of the sources. Profiles of dissolved oxygen (DO) and variation of critical times with the type of waste were reported. This study provides the limits of waste to be discharged into different water sources there by will offer some guidance for the discharge of waste into these sources.
Keywords
Pollution; Self purification; Simulation; Dissolved oxygen; Waste
Introduction
Water is one of the gifts of nature for all beings. It exists on the surface of the earth in the form of ponds, lakes, brooks, streams, and rivers [1]. Pollution of all these water sources increases day by day due to the release of untreated industrial effluents, lack of awareness about preserving their hygienic nature, and improper waste disposal methods [2]. Importance of studying pollution of these increases continuously due to the need to follow the standards for environmental pollution. Hence, proper monitoring and enforcement of these guidelines will help to keep the quality of all the water sources.
Dissolved oxygen (DO) levels of each water source indicate the survival ability of different organisms in them. A very high or low value of DO affects the water quality and thereby aquatic life of the organisms. Crabs, oysters, bottom feeders and worms, etc survive at the DO levels of 1-6 mg/L unlike 4-15 mg/L for shallow water fishes [3]. Pollution of water occurs at physical, chemical and biological levels [4]. Severe pollution affects the physiological functions of the marine organisms without any damage to their life. But these effects damage their reproduction capacity, immunity responses, and energy deficits, and finally will lead to the death of the organisms [5-8]. Wastes from industries, agricultural fields, and domestic sectors need oxygen for their decomposition. Hence, the existence of different types of organisms became questionable.
The decomposition of dumped wastes occurs by microorganisms (biochemical) and chemical agents. Microorganisms need oxygen in the name of biological oxygen demand (BOD) to degrade a waste. The decomposition of most of the organic matter through this means is high. But this is a very slow process. The remaining waste needs the chemical treatment which also demands the oxygen, named as Chemical Oxygen Demand (COD). The rate of BOD depletion gives the natural decomposition of the waste by consuming oxygen. Hence, the measurement of BOD and COD helps to characterize a particular type of waste [9]. DO at a particular instant is the result of both re-oxygenation and deoxygenation. Oxygenation of ponds and small lakes takes place through photosynthesis [3]. On the other hand, the plants are grown on and under the surface, consuming oxygen. Uptake of oxygen from the surrounding atmosphere is less than they are stagnant. On the other side moving water bodies such as brooks, streams, rivers are readily oxygenated due to the good dispersion of oxygen. Naturally, all the water sources are able to purify on their own. The self-purification coefficient (f) characterizes the ability of the water source to purify on its own [10]. Moving water sources have high self-purification coefficients compared to the stationary ones. Hence, the determination of the best quantities of discharged waste into the water sources without affecting their self-purification abilities is of interest. The existing experimental techniques help to measure the amount of waste in the water source. But knowing the ranges of wastes that can be discharged into a particular water source is a better one.
Abundant literature on f, BODs of different wastes, rate expressions for reoxygenation and deoxygenation is available [11-13]. This motivated the author to find the amounts of waste theoretically by considering the existing model equations and experimental data. The author simulated the modeling equations using MATLAB for the surface water bodies from ponds to very large rivers. The study considered the least DO require for the organisms to do this. Also, profiles for variation of DO with the post-discharge time and BOD are plotted. The times for reaching the critical deficit, are reported. The author hopes that this study will be helpful to give information about the largest amount of waste without any aid of further experimentation.
Model for Oxygen-Sag
Streeter and Phelps introduced the model [14] to predict the DO and deficit of a river after the discharge of waste. The model has some differential equations to describe the processes of re-oxygenation and deoxygenation with time. The net DO of a stream is a function of time, f, equilibrium DO, BOD and decomposition constant of the waste. DO of the mixed stream starts to decrease after the discharge of waste. Both the equilibrium DO and the BOD depletion constant are functions of temperature. The critical time is the time during which, the decrease in DO put the life of the organisms in a water source in danger. The equations of the model are given below.
Mixed DO
CA=(QWCW+QSW CSW)/(QW+QSW)…………………………………………….. (1)
Mixed BOD
LA=(QWLW+QSW LSW)/(QW+QSW) …………………………………………….. (2)
BOD depletion rate constant
K=K20 (1.047(T-20)) …………………………………………….. (3)
Equilibrium oxygen concentration
CS=14.64–(0.41T)+0.008 (T2) …………………………………………….. (4)
Rate of BOD depletion
DCDE/DT=-KLA EXP (-KT) …………………………………………….. (5)
Rate of Oxygenation
DCRE/DT=F K (CS-C) …………………………………………….. (6)
Balance for net DO: From Equations (5) and (6)
DC/DT=-KLA EXP (-KT)+F K (CS-C) …………………………………………….. (7)
-Oxygen deficit
D=CS-C …………………………………………….. (8)
-Oxygen deficit after the discharge of waste into a water source
DA=CS-CA…………………………………………….. (9)
Time for critical deficit
TCR=1/(K (F -1) LN (F (1-(F-1) (DA) LA)) …………………………………………….. (10)
Critical deficit
DCR=LA EXP (-K (TCR))/F …………………………………………….. (11)
Simulation
The MATLAB program [15] can simultaneously solve both the algebraic and differential equations. The DO and BOD of the mixed stream are rapidly changed after the discharge of waste (Equations 1and 2). The BOD depletion constant (Equation 3) and equilibrium DO (Equation 4) Together find the net DO of all the water sources through deoxygenation and oxygenation (Equations 5-7). The self-purification coefficients (f) for all the streams at 20°C. Were reported in the literature [11]. These values along with an exponent for re-oxygenation constant (1.024) are used to calculate ‘f’ at other temperatures. The critical deficit and the time for it are calculated using the (Equations 8-11). A temperature range of 0°C- 30°C. is used for simulation of all sources along with 38°C. For very large rivers. Hence, the largest and least BOD values of wastes that can be handled by all the sources correspond to the values at 0°C. And 20°C-38°C. The least DO levels required for the survival of all organisms in shallow and deep water sources are five and six [3]. Hence, all the simulations are carried out by maintaining five for lakes and six for other high flow water sources.
Stationary water sources keep up their DO nearer to equilibrium values due to photosynthesis and diffusion of atmospheric oxygen. Self-purification coefficients of Ponds and lakes were reported as 0.05-1.0 and 1-1.5 [11]. The largest values of ‘f’ used for simulation of ponds and the lakes are 0.9 and 1.5 respectively. Due to some movement in lakes over the ponds, lakes have higher purification coefficients. The flow rate of the sewage used for simulation of both these sources is 0.0029 m3/s to study the effect of dumping low BOD containing wastes. A flow rate of 0.0028 m3/s for water in the lakes is used.
The atmospheric oxygen disperses very rapidly after entering a moving water source. The dispersion rates depend on their flow rates. The categorization of moving water sources based on their flow rates was reported [16]. Also, the self-purification coefficients of all these water sources are taken as 1.7, 2.5, 3, 3.5, 4, 4.5 and 6 [17]. The sewage flow rate of 0.4 m3/s is used for simulation of all the water sources.
Results and Discussion
Dissolved oxygen in shallow water sources is reduced drastically after the discharge of waste. The pond is affected even with the discharge of a treated waste (DO=2) which is evident from TABLE 1. It is also found through the simulation that the pond will take 20 days to bring back its DO to 3. But all the organisms in a pond need a minimum DO of four for their survival. This situation is further worsened by adding an untreated waste. The reason for all of these is the lack of movement.
| Type of water source | Flow rate (m3/sec) | Temperature | ||||
|---|---|---|---|---|---|---|
| 0°C | 10°C | 20°C | 30°C | 38°C | ||
| Ponds | 0 | 19 | 12 | 8 | ||
| Lakes | 0.0028 | 59 | 33 | 15 | ||
| Brooks | 0.09 | 85 | 44 | 16 | ||
| Small streams | 1 | 148 | 77 | 30 | ||
| Streams | 10 | 1380 | 760 | 359 | 99 | |
| Small rivers | 100 | 15,200 | 8380 | 4020 | 1200 | |
| Rivers | 1000 | 1,68,600 | 93,800 | 45,000 | 14,300 | |
| Large rivers | 10000 | 18,45,000 | 10,33,500 | 5,00,000 | 1,60,000 | |
| Very large rivers | 12000 | 28,50,000 | 15,90,000 | 7,80,000 | 2,60,000 | 2000 |
Table 1: Highest BOD containing wastes handled by different water sources.
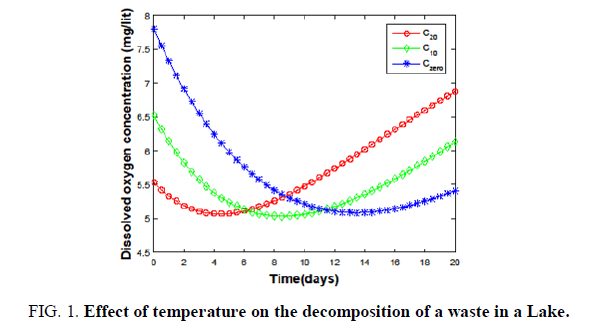
Hence, the health of the ponds had to be preserved by not dumping any type of waste. On the other hand, the discharge of waste into a lake reduces its DO to five with time at different temperatures FIG. 1.
Figure 1. Effect of temperature on the decomposition of a waste in a Lake.
The equilibrium oxygen concentration is high at 0°C (blue) and reaches a lower value at 20°C (red). Due to this, the lakes could keep their purity against the discharge of a treated waste at low temperatures TABLE 1.
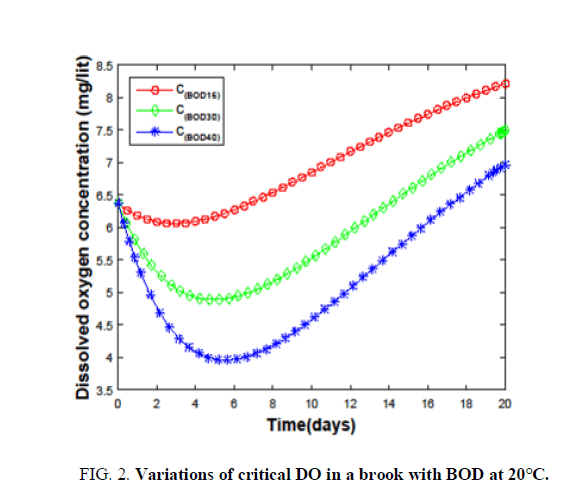
The largest and least BOD values that can be handled by all the water sources are determined by varying different wastes. Brooks shows the ability to disperse both the treated and high BOD (16-85) containing wastes TABLE 1. The effect of BOD on the critical oxygen concentration of a brook at 20°C is shown in FIG. 2.
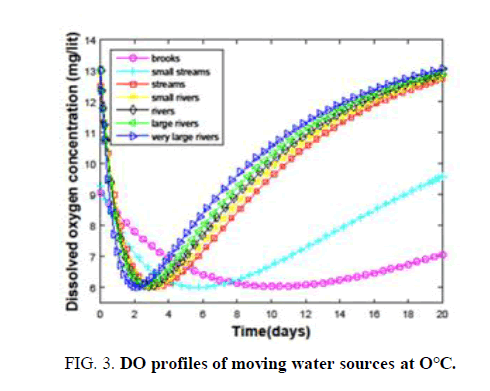
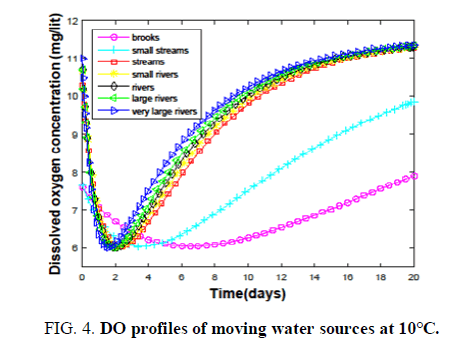
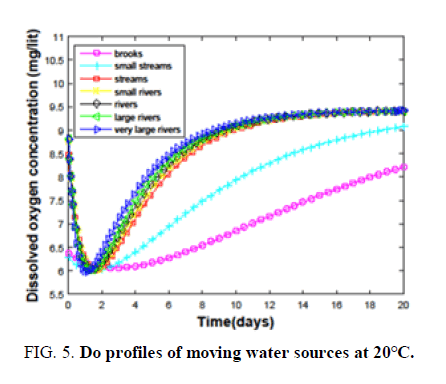
It is clear from the FIG. 2, that changing the BOD from 16 to 40 has an adverse effect on DO. Hence, the largest BOD that can be handled by the brooks to keep up a DO of 6 is considered as 16. The same procedure is followed to calculate BODs for other sources. Small water streams are observed to accept the waste of having BOD (30-150). Streams can purify themselves against the discharge of raw and high BOD (350-1400) wastes. Wastes having BODs, that can be dispersed effectively by small rivers, rivers, large and very large rivers are 4000-15,200, 45,000-1,68,600, 5,00,000-18,45,000 and 7,80,000-28,50,000. When the temperature approaches 38°C even a very large river is able to handle only a waste of BOD (2000) TABLE 2, Ability to handle low BOD wastes is drastically reduced as the temperature crosses 40°C due to high degradation and low oxygen content. Hence, the discharge of waste during summer will devastate the health of very large rivers as well. Every water source has a characteristic time for the dispersion of a particular waste. The critical time depends on the type of water source. It is clear from TABLE 2, that the critical time for ‘brooks’ is very high compared to the rest of the sources at 0°C. The difference in the critical times keeps on decreasing when we move towards very large rivers. This is due to the availability of large amounts of oxygen and high degradation rates in fast-moving sources. Each source has a less temperature at 10°C compared to that at 0°C. Due to an increase in the degradation rate despite the availability of small amounts of oxygen. Dispersion of waste at 20°C. It is majorly controlled by degradation rates. On the other hand for highly moving sources oxygenation plays a key role. Due to the combination of these two factors, the trend of critical times is maintained with a change in small streams. But at higher temperatures, all the sources have the problem of dispersing the waste due to the limited availability of oxygen and very high degradation rates. The last row of TABLE 2, evidences this fact. How a water source disperses the discharged waste and purifies on its own is interesting. Variation of DO of all the fast-moving sources with time at different temperatures (0°C-20°C.) is shown in FIG. 3-5.
| Temperature | Time for critical deficit (TCR) of different water sources (days) | ||||||
|---|---|---|---|---|---|---|---|
| Brooks | Small streams | Streams | Small rivers | Rivers | Large rivers | Very large rivers | |
| 0℃ | 10.261 | 5.65 | 3.247 | 3.016 | 2.779 | 2.576 | 2.134 |
| 10℃ | 6.53 | 3.57 | 2.32 | 2.175 | 2.01 | 1.866 | 1.584 |
| 20℃ | 2.88 | 1.492 | 1.625 | 1.55 | 1.43 | 1.336 | 1.143 |
Table 2: Critical deficit times of different water sources.
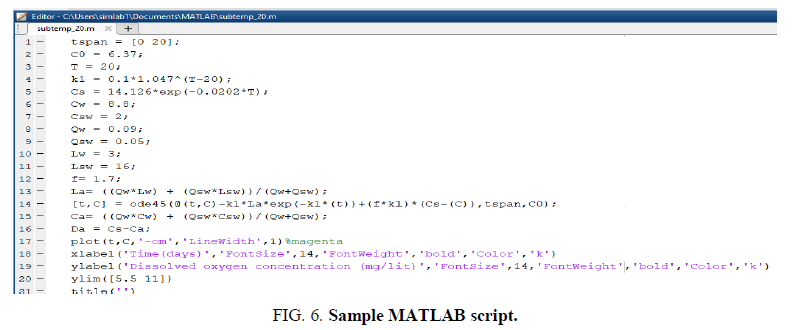
The sample MATLAB script is shown in FIG. 6.
At 0°C brooks and small streams have high critical and recovery times compared to other sources with brooks being the highest. Other sources have some little variation in the times among them. But this variation is diminished as we move to high temperatures. Also, the space between the curves for brooks and small streams, and those for the other sources, is reduced. All these observations suggest the dominance of degradation rates at high temperatures as shown in TABLE 2. Hence, the discharge of hot waste or waste into a source at high temperatures is dangerous.
Conclusion
The simulation study predicted the limits of waste that can be discharged into different water sources. It also emphasized the need to keep their hygienic nature by avoiding the discharging of waste at high temperatures into the water sources. The author hopes that this study will give some guidance for the discharge of wastes.
Acknowledgement
The author acknowledges the Gayatri Vidya Parishad college of engineering (Autonomous) for providing the computational facilities.
References
- Fenton R. The liquid continent. Water the biggest gift from nature. 2012. https://theliquidcontinent.com/basic/water-the-biggest-gift-from-nature/accessed 28August 2019.
- Owa FW. Water pollution: sources, effects, control and management Int. Lett Nat Sci. 2014;8:1-6.
- Fondriest Environmental, Inc. dissolved oxygen fundamentals of environmental measurements: Dissolved oxygen. 2013. https://www.fondriest.com/environmental- measurements/parameters/water-quality/dissolved-oxygen/ (accessed 28 August 2019).
- Obiukwu CE. Microbial ecology and physicochemical quality of the Okirika sector of Bonny Estuary as affected by refinery effluents. Ph.D. thesis, University of Port Harcourt, Dept. of Microbiology. 2000.
- Lech JJ, Vodnicnik MJ, Elcombe CR. Induction of monooxygenase activity in fish. In Aquatic toxicology Ed LJ Weber, 1982:107-48.
- Sindermann CJ, Lloyd R, Vader SL, et al. Implications of oil pollution in production of disease in marine organisms Phil Trans R. Soc Lond B. 1982;297(1087):385-99.
- Payne JF, Penrose, WR. Induction of aryl hydrocarbon (benzo[a]pyrene) hydroxylase in fish by petroleum. Bull. Environ. Contam. Toxicol. 1975;14(1):112-6.
- Rattner BA, Hoffman DJ, Marn CM. Use of mixed-function oxygenases to monitor contaminantss exposure in wildlife. Environ Toxicol Chem. 1989;1:1093.
- Sawyer CN, McCarty P, Parkin GF. Chemistry for Environmental Engineering and Science (5th ed.). New York: McGraw-Hill. ISBN 978-0-07-248066-5. 2003.
- Negulescu M. Self purification. Developments in water science 1985;23:53-70.
- Fair GM, Gayer JC, Okun DA. Ecology and management of natural and receiving water in Elements of water supply and waste water Disposal (2nd ed.). London: John Wiley and Son Inc. 1971.
- The University of reading ECIFM. Biological oxygen demand. https://www.ecifm.rdg.ac.uk/bod.htm/(accessed 28 August 2019).
- Brenner A, Shachamb M, Michael BC. Applications of mathematical software packages for modeling and simulations in environmental engineering education. Environmental Modelling and Software. 2005;20:1307-13.
- Streeter HW, Phelps, EB. A Study of the pollution and natural purification of the Ohio river. HEW. 1958.
- III. Factors concerned in the phenomena of oxidation and reaeration, Public Health Bulletin no. 146, Reprinted by U.S. Department of Health, Education and Welfare, Public Health Service, 1958, ISBN B001BP4GZI. 1925.https://udspace.udel.edu/handle/19716/1590.
- MATLAB R2015a, The MathWorks, Natick, 2015.
- Chapman, DV. World Health Organization, Unesco and United Nations Environment Program. Water quality assessments: a guide to the use of biota, sediments and water in environmental monitoring edited by Deborah Chapman (2nd ed.) London: E and FN Spon. 1996.
