Original Article
, Volume: 13( 6)Comparative Statistical Analysis of Photocatalytic Degradation of Reactive Yellow 145 Dye Using Response Surface Methodology and Artificial Neural Network
- *Correspondence:
- Karchiyappan T
Department of Chemical Engineering, State University of Maringá, Av. Colombo 5790, 87020-900, Maringá – PR, Brazil
Tel: +91-9843086090; E-mail: thirusambath5@gmail.com
Received Date: June 19, 2017 Accepted Date: November 20, 2017 Published Date: November 22, 2017
Citation:Karchiyappan T. Comparative Statistical Analysis of Photocatalytic Degradation of Reactive Yellow 145 Dye Using Response Surface Methodology and Artificial Neural Network. Environ Sci Ind J. 2017;13(6):155
Abstract
The aim of this research was to analyze the operating parameters in photocatalysis process such as initial pH, dye concentration (reactive yellow 145), irradiation time and catalyst (TiO2) loading for the degradation of reactive yellow 145 dye. The rate coefficient (k=0.0522 min-1) of degradation, follows the pseudo-first-order kinetics. Four factors three levels, Box-Behnken response surface design (BBD) was employed in RSM (Response Surface methodology), whereas multi-layer feed-forward was employed in ANN (Artificial neural network). Optimum operating conditions (97% removal) was determined in initial pH of 6, dye concentration of 0.005 M, irradiation time of 40 min and catalyst loading of 0.08 g. Also, the degradation was confirmed by UV Spectra.
Keywords
Photocatalysis; Reactive yellow 145 dye; UV spectra; Box-Behnken design; Multi-layer feed-forward; Optimization
Introduction
Water is a basic requirement for all living beings in the world. Population increase and industrialization led to water pollution [1]. Now-a-days, most of the industrial waste was disposed in landfills [2-3]. Mismanagement of industrial as well as "hazardous" waste has resulted in polluted aquatic life [4]. A diversity of hazardous pollutants is discharged into the aquatic bodies from several industrial streams. Dye from textile industries have been a main focus of environmental remediation [5-7].
Lase few decades, color removal from the textile wastewater has become a subject of interest; because of the toxicity of the dyes [8,9]. The reactive yellow 145 dye and its intermediates with high aromaticity and low biodegradability have emerged as major environmental pollutants and nearly 10%-15% of the reactive yellow 145 dye is lost in the dyeing process. It is released in the water environment, which is an important source of environmental contamination [10]. The wastewater from textile industries, which are used reactive yellow 145 dye causes serious impact on natural water bodies and land in the surrounding area [11]. High values of COD and BOD and color leading to turbidity in the effluents [12].
Various physical, chemical and biological techniques have been developed over the last two decades to remove color from dye contaminated wastewaters [13]. Chemical and biological treatments have been conventionally followed till now, but these treatment methods have their own disadvantages. The aerobic treatment process is associated with production and disposal of large amounts of biological sludge [14]. They either transfer it to a solid which is often disposed of in landfills or must be treated in an energy-intensive regeneration process. Merely transferring toxic materials from one medium to another is not a long-term solution to the problem of hazardous waste loading on the environment [15]. Therefore, there is a critical need to develop an economic and efficient viable treatment technique for the treatment of reactive yellow 145 dye containing wastewater.
Advanced oxidation processes (AOP’s), uniting together titanium dioxide (TiO2) and high output ultraviolet technologies, in conjunction with hydrogen peroxide and catalyst are successfully used to decompose many toxic and bio-resistant organic pollutants in aqueous solution to acceptable levels, without producing additional hazardous by-products or sludge which require further handling [16-19]. TiO2/UV process is known to have many advantages such as large number of organic compounds dissolved or dispersed in water can be completely mineralized; the rate of reaction is relatively high if large surface area of the catalyst can be used. TiO2 is available at a relatively modest price and can be recycled on a technical scale. UV lamps emitting in the spectral region required to initiate the photocatalytic oxidation are well known and are produced in various sizes [20,21].
An extensive literature survey shows that, there was no research reports are available on the treatment of reactive yellow 145 dye using photocatalysis process via RSM and ANN. RSM is one of the statistical tool, which mainly used for the modeling and investigation of complex multivariable systems. ANN constitutes intelligent bionic models and the nonlinear, adaptive dynamics systems which have been widely applied to the complex process. Hence, Current study attempted to evaluate the individual and interactive effect of process variables such as initial pH, dye concentration, irradiation time and catalyst loading on the percentage degradation of reactive yellow 145 dye using RSM and ANN. Finally, UV Spectra was used to analyses the progress in photocatalytic process and kinetic studies was also investigated. This study creates the novel opportunity to know the in-depth knowledge of mechanism behind the photocatalysis process to degrade reactive yellow 145 dye.
Materials and Methods
Materials
Reactive yellow 145 dye is an aromatic chemical compound with the molecular formula of C28H20ClN9Na4O16S5. This has the molecular weight of 1026.25 g/mol. Structure of reactive yellow 145 dye is shown in Figure 1.

Figure 1: Structure of reactive yellow 145 dye.
Synthesis of TiO2 Nano particles
The Titanium tetra chloride is used as a starting material in this synthesis. 50 ml of Ticl4 is slowly added to 200 ml of distilled water in an ice-cold bath and the beaker was taken in to room temperature. Then, the beaker was kept in a magnetic stirrer to make a homogeneous solution for 30 min. Bath temperature was raised to 150°C and kept in the same temperature till the process of Nano particles was completed.
In another vessel 26 g of urea was dissolved in 250 ml of distilled water. From the vessel 150 ml of urea solution was added to beaker under constant stirring, drop by drop touching the walls of the beaker. The solutions turned into white collide without any precipitation. After complete reaction, the solution was allowed to settle and the solution was washed with distilled water for more than 2 min.
Photocatalytic reactor
Schematic diagram of photocatalytic reactor was shown in Figure 2. Photocatalytic reactor was laboratory-built system consisting of UV lamp source. The intensity level of light is controlled by fixing the distance between the source of light and the specimen. The sample was added in the thermo stated photo cell using constant stirring. The suspension was constantly stirred for 30 min in the dark. During the irradiation, the photoreactor was maintained under magnetic stirring for homogeneous suspension and to promote the adsorption on the surface of TiO2.

Figure 2: Schematic diagram of reactive yellow 145 dye degradation unit.
Experimental procedure
For the degradation experiments, different loading of photocatalyst (TiO2) was added to 100 ml of dye solution. Then, the suspension was subjected to irradiation under UV light. The aqueous mixture was magnetically stirred and aerated throughout the experiment. At different time intervals a liquot was taken out with the help of a syringe. Then absorption spectra were recorded at λmax=417 nm. The decolorization efficiency (%) was calculated as:
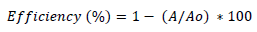 (1)
(1)
where Ao is the initial absorbance of dye and A is the final absorbance of dye after photo irradiation [22]. A UV/VIS spectrophotometer was employed for absorbance measurement. Photocatalytic decomposition reaction kinetic model was determined as follows:
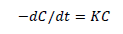 (2)
(2)
In equation (2), k is the pseudo-first-order rate constant andt, is the reaction time. Finally, A plot of ln (C0/C) versus t was recorded.
Statistical experimental design
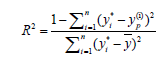
In RSM, four factors three level Box-Behnken design (BBD) was applied to investigate the individual and interactive effects of process variables including initial pH, dye concentration, irradiation time and catalyst loading on the reactive yellow 145 dye degradation. Based on the analysis of variance (ANOVA) results, mathematical model was selected. While, the multilayer feed-forward network with back propagation algorithm was used in ANN. ANN topology for photo catalysis process is shown in Figure 3. The effective modeling and predicting capacity of RSM and ANN was obtained with coefficient determination values. The R2 value was determined as follows [23]:

Figure 3: ANN topology for photo catalysis process.
 (3)
(3)
Where, Yi and Yp were actual and predicted values from RSM and ANN.
Results and Discussion
Effect of process variables
In the photocatalytic process to degrade the dye, initial pH is a crucial factor, which can influence the overall treatment efficiency. To determine the effective initial pH, experiments were done at different pH (2-9) and results are shown in graphically Figure 4.(a-c). It is shown that the greatest results are obtained in acidic solutions, best degradation results were obtained at pH 6. At high pH values the hydroxyl radicals are so rapidly scavenged that they do not have the opportunity to react with the dyes [24-25].

Figure 4: Effect of process variables on the reactive yellow 145 dye degradation.
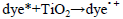
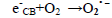
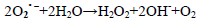
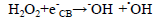
The dye concentration is one of the important parameter in photocatalytic treatment process, which mainly influences the reaction of the OH• (Hydroxyl radical) with reactive sites (Table 1). To examine its effect on photocatalytic process, the experiments were carried out at various dye concentration and the results were exhibited in Figure 4a-c. From the results, it is found that dye degradation is increased with increasing dye concentration up to 0.0075 M, due to the availability of large number of reactive sites for reactive OH• radicals [26]. The mechanism as follows:
| Variable (unit) | Factors | Levels | ||
|---|---|---|---|---|
| X | -1 | 0 | 1 | |
| Initial pH | A | 2 | 5.5 | 9 |
| Dye concentration (M) | B | 0.0001 | 0.005 | 0.01 |
| Irradiation time (min) | C | 0 | 50 | 100 |
| Catalysis loading (g) | D | 0 | 0.1 | 0.2 |
Table 1. Ranges of process parameters.
 (4)
(4)
 (5)
(5)
 (6)
(6)
 (7)
(7)
 (8)
(8)
dye•++ O2→peroxide or hydroxyl intermediates (9)
Further increase of dye concentration beyond 0.0075 M would increase the reactive site, which are not degraded by OH• radicals.
The photocatalytic treatment process reactions are highly affected by irradiation time, because it plays a key function in the degradation of dye. In order to investigate the effect of irradiation time, experiments were performed at different irradiation time and the observations are shown in Figure 4.(d-f). From the results, it is observed that the percentage degradation of dye is increased with increasing irradiation time, due to the structure of highly reactive hydroxyl radical, which contain strong affinity to oxidize the dye. Beyond that, there is negligible effect on dye degradation [27].
Experiments were carried out without and with catalyst loadings in order to determine optimal amount of photo catalyst in oxidation. The percentage of degradation of dye as a function of catalyst loading is shown in Figure 4.(d-f). As seen in the figure, the dye degradation is increased with increases in TiO2 loading up to 0.15 g. TiO2 loading beyond 0.15 g shows the reduction in dye degradation. This phenomenon may be explained that increase in catalyst concentration decreases photo absorption; which in turn reduces the dye adsorption onto the catalyst surface, thus reducing the reaction rates [28].
Mathematical modeling
The four independent variables such as initial pH (A), dye concentration (B), irradiation time (C) and catalysist loading (D) were examined (Table 2) using multiple regression analysis (Table 3) on the experimental data, the model for the predicted response Y as follows: where Y is the reactive yellow 145 dye degradation.
| Run | A | B | C | D | Degradation (%) |
|---|---|---|---|---|---|
| 1 | 9 | 0.0100 | 50 | 0.1 | 54.74 |
| 2 | 2 | 0.0100 | 50 | 0.1 | 47.84 |
| 3 | 5.5 | 0.0100 | 50 | 0 | 75.63 |
| 4 | 2 | 0.0051 | 100 | 0.1 | 54.64 |
| 5 | 5.5 | 0.0051 | 50 | 0.1 | 96.69 |
| 6 | 5.5 | 0.0100 | 50 | 0.2 | 59.64 |
| 7 | 5.5 | 0.0051 | 50 | 0.1 | 96.69 |
| 8 | 5.5 | 0.0051 | 0 | 0.2 | 69.36 |
| 9 | 5.5 | 0.0001 | 100 | 0.1 | 87.68 |
| 10 | 2 | 0.0001 | 50 | 0.1 | 29.65 |
| 11 | 5.5 | 0.0100 | 0 | 0.1 | 97.68 |
| 12 | 5.5 | 0.0001 | 50 | 0.2 | 64.74 |
| 13 | 5.5 | 0.0100 | 100 | 0.1 | 44.96 |
| 14 | 5.5 | 0.0051 | 50 | 0.1 | 96.69 |
| 15 | 9 | 0.0001 | 50 | 0.1 | 64.62 |
| 16 | 5.5 | 0.0051 | 100 | 0.2 | 68.73 |
| 17 | 9 | 0.0051 | 50 | 0.2 | 60.74 |
| 18 | 9 | 0.0051 | 0 | 0.1 | 75.63 |
| 19 | 9 | 0.0051 | 100 | 0.1 | 37.96 |
| 20 | 5.5 | 0.0001 | 0 | 0.1 | 43.95 |
| 21 | 5.5 | 0.0051 | 0 | 0 | 84.21 |
| 22 | 5.5 | 0.0051 | 50 | 0.1 | 96.69 |
| 23 | 2 | 0.0051 | 0 | 0.1 | 37.96 |
| 24 | 5.5 | 0.0001 | 50 | 0 | 70.64 |
| 25 | 9 | 0.0051 | 50 | 0 | 69.14 |
| 26 | 5.5 | 0.0051 | 100 | 0 | 88.28 |
| 27 | 2 | 0.0051 | 50 | 0 | 67.58 |
| 28 | 2 | 0.0051 | 50 | 0.2 | 34.96 |
| 29 | 5.5 | 0.0051 | 50 | 0.1 | 96.69 |
Table 2. RSM experimental results.
| Source | Sum of squares | DF | Mean square | F Value | Prob>F |
|---|---|---|---|---|---|
| Sequential model sum of squares for dye degradation (%) | |||||
| Mean | 135789 | 1 | 135789 | ||
| Linear | 1557 | 4 | 389 | 0.81 | 0.5340 |
| 2FI | 3439 | 6 | 573 | 1.26 | 0.3219 |
| Quadratic | 7888 | 4 | 1972 | 101.48 | <0.0001 |
| Cubic | 196 | 8 | 24 | 1.93 | 0.2194 |
| Residual | 76 | 6 | 13 | ||
| Total | 148944 | 29 | 5136 | ||
Table 3. Sequential model sum of squares for response.
Y=96.69+7.52A+1.60B-2.21C-8.11D-7.02AB-13.59AC+6.05AD-24.11BC-2.52BD-1.18CD-32.04A2-18.75B2-12.59C2-9.76 D2 (10)
Where, A, B, C and D are initial pH, dye concentration, irradiation time and catalyst loading, respectively. The model showed the value of the determination coefficient (R2) was 0.9483, which implied that 94.83% of the variations could be explained by the fitted model. For a good statistical model, R2 adj should be close to R2. As shown in Table 4, R2 adj was 0.94, which implied that small variations were not explained by the model. It also indicated that a high degree of correlation between the observed and predicted values. A relatively low value of C.V. (coefficient of variation) (1.25%) indicated a better reliability of the experiments values [29]. Values of p less than 0.05 showed model terms were significant. So, the F-value (F=47.12) and p-value (p=0003) implied this model was significant. Meanwhile, the adequacy of developed mathematical model was done by constructing diagnostic plots such as predicted versus actual plot (Figure 5a).

Figure 5: Predicted versus actual plot for response (Y), (a) RSM and (b) ANN.
| Source | Degradation (%) | ||||
|---|---|---|---|---|---|
| Sum of squares |
Mean square |
F-value | p-value | ||
| Model | 12883.3 | 920.2385 | 47.357541 | <0.0001 | |
| A | 678.003 | 678.0033 | 34.891577 | <0.0001 | |
| B | 30.752 | 30.75201 | 1.5825675 | 0.2290 | |
| C | 58.6976 | 58.69763 | 3.0207122 | 0.1041 | |
| D | 789.103 | 789.103 | 40.609016 | <0.0001 | |
| AB | 196.981 | 196.9812 | 10.137097 | 0.0066 | |
| AC | 738.481 | 738.4806 | 38.003874 | <0.0001 | |
| AD | 146.652 | 146.6521 | 7.5470469 | 0.0157 | |
| BC | 2325.65 | 2325.651 | 119.68321 | <0.0001 | |
| BD | 25.452 | 25.45203 | 1.3098185 | 0.2716 | |
| CD | 5.5225 | 5.5225 | 0.2842003 | 0.6023 | |
| A2 | 6657.05 | 6657.046 | 342.58657 | <0.0001 | |
| B2 | 2279.7 | 2279.696 | 117.31828 | <0.0001 | |
| C2 | 1027.89 | 1027.888 | 52.897452 | <0.0001 | |
| D2 | 618.151 | 618.1509 | 31.811438 | <0.0001 | |
| AP | 21.04 | ||||
| CV% | 6.44 | ||||
| Source | Std. Dev. | R2 | Adjusted R2 | Predicted R2 | PRESS |
| Model summary statistics for MB degradation (%) | |||||
| Linear | 21.9837 | 0.1183 | -0.0286 | -0.2095 | 15912.00 |
| 2FI | 21.2917 | 0.3797 | 0.0351 | -0.2770 | 16799.93 |
| Quadratic | 4.4081 | 0.9793 | 0.9386 | 0.9435 | 1566.97 |
| Cubic | 3.5623 | 0.9942 | 0.9730 | 0.1666 | 10963.91 |
Table 4. ANOVA table for response.
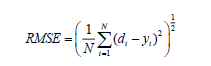
In this ANN study, the feed-forward neural network trained by back propagation algorithm was also used. The input process parameters to feed-forward neural network were the initial pH (A), dye concentration (B), irradiation time (C) and catalyst loading (D). Optimization of ANN topology is perhaps the most important step in the development of a mathematical model to describe the photocatalytic process [30]. A series of topologies was used, in order to determine the optimum number of hidden nodes in which the number of nodes was varied range from 2 to 10. The RMSE is calculated as follows,
 (11)
(11)
In order to produce the ANN outputs, the training is performed to minimize the error function (MSE). The terminology namely back propagation algorithm minimizes the MSE between the observed and the predicted response values in the output layer via two phases. Here, each topology (Feed Forward and backward) was repeated five times and three-layered feedforward back propagation neural network was employed for the modeling of the photocatalytic process to degrade the reactive yellow 145 dye [31]. Figure 5b shows a comparison between experimental reactive yellow 145 dye removal values and predicted values using the ANN model. The obtained plot is the perfect-fit Y=X (predicted data=experimental data) with the liner equation Y=0.986X+1.335, correlation coefficient (R2) 0.986 and RMSE 2.025. This high value of correlation coefficients ((R2) shows that the predicted reactive yellow 145 dye removal fit with measured reactive yellow 145 dye removal, closely. Therefore, the ANN modeling effectively simulates and predicts the influential process factors of the photocatalytic degradation. In order to find the effective mathematical modeling of photocatalytic degradation, R2 value is taken into account and it clearly stated that ANN has superior capacity compare to RSM.
Optimization and validation
Numerical optimization technique was employed to optimize the photocatalytic process parameters to achieve maximum reactive yellow 145 dye degradation. The results showed that the optimized conditions were initial pH of 6, dye concentration of 0.005 M, irradiation time of 40 min and catalyst loading of 0.08 g. Under these conditions, 97% of reactive yellow 145 dye were degraded. Then, the suitability of optimum conditions for predicting optimum response value (reactive yellow 145 dye degradation) is tested based on above mentioned conditions. Triplicate experiments were performed under the optimized conditions and the mean value (96.85%) obtained from real experiments established the validation of the optimized photocatalytic process conditions [32-34].
Kinetic and confirmation studies
The reactive yellow 145 dye degradation under photocatalytic process was analyzed UV-vis spectrum. Figure 6a shows UV-vis spectrum of reactive yellow 145 dye and the spectrum exhibits in 417 nm. According to results, reduced absorption intensity shows the ultraviolet radiation are broken the dye molecules. From the results, linear plot (Figure 6b) suggests that the photodegradation reaction follows the pseudo-first-order kinetics (k=0.0522 min-1).

Figure 6: (a) UV spectra and (b) Kinetics of photo catalytic degradation on removal reactive yellow 145 dye.
Conclusion
Photo catalysis process is eco-friendly way to decrease the pollution from dye wastewater. Degradation of reactive yellow 145 dye has been carried out with variation in parameters like pH, dye concentration, irradiation time and catalyst loading under UV light. The remarks of these work clearly reveal the significance of choosing the optimum degradation parameters to attain a higher degradation, which is essential for any practical application. R2 value is taken into account for prediction of dye degradation and it clearly stated that ANN has superior capacity compare to RSM. 97% of reactive yellow 145 dye was degraded, under the optimum conditions such as initial pH of 6, dye concentration of 0.005 M, irradiation time of 40 min and catalyst loading of 0.08 g. The rate coefficient k=0.0522 min-1 of the photodegradation reaction follows the pseudo-first-order kinetics.
References
- Namata N, Patil Sanjeev RS . Degradation of Reactive Yellow 145 dye by persulfate using microwave and conventional heating. J Water Process Eng. 2015;7:314-27.
- Gharbani P. Preparation, characterization and application of synthesized nano Zn(OH)8Cl2H2O in removing of dye pollutants: Modeling of removal process by response surface methodology. J Mol Liq. 2017;246:317-24.
- Katsumata H, Koike S, Kaneco S, et al. Degradation of Reactive Yellow 86 with photo-Fenton process driven by solar light. J Environ Sci. 2010;22(9):1455-61.
- Jha P, Kana EBG, Schmidt S. Can artificial neural network and response surface methodology reliably predict hydrogen production and COD removal in an UASB bioreactor? Int J Hydrogen Energy. 2017;42(30):18875-83.
- Yi-fan Hu, Chang-zhu, Yang Jin-feng, et al. Modeling of expanded granular sludge bed reactor using artificial neural network. J Environ Chem Eng. 2017;5(3):2142-50.
- Li W, Wu X, Jiao W, et al. Modelling of dust removal in rotating packed bed using artificial neural networks (ANN). Appl Therm Eng. 2017;112:208-13.
- Azadi S, Amiri H, Rakhshan Dehroo GR. Evaluating the ability of artificial neural network and PCA-M5P models in predicting leachate COD load in landfills. Waste Manage. 2016;55:220-30.
- Ebrahiem EE, Al-Maghrabi MN, Mobarki AR. Removal of organic pollutants from industrial wastewater by applying photo-Fenton oxidation technology. Arabian J Chem. 2017;10(2):S1674-S79.
- Thirugnanasambandham K, Sivakumar V, Prakash Maran J. Treatment of egg processing industry effluent using chitosan as an adsorbent. J Serb Chem Soc. 2014;79(6):743:57.
- Sridhar R, Sivakumar V, Prince Immanuel V, et al. Treatment of pulp and paper industry bleaching effluent by electrocoagulation process. J Hazard Mater. 2011;186:1495-1502.
- Wei Lung C, Chihta W, Wenchun C, et al. Adsorption treatment of oxide chemical mechanical polishing wastewater from a semiconductor manufacturing plant by electrocoagulation. J Hazard Mater. 2010;180:217-24.
- Cansares P, Martinez F, Jimenez C, et al. Coagulation and electrocoagulation of oil-in-water emulsion. J Hazard Mater. 2008;151:44-51.
- Muftah HEN, Sulaiman A, Amal A, et al. Assessment of electrocoagulation for the treatment of petroleum refinery wastewater. J Environ Manage. 2009;91:180-5.
- Sridhar R, Sivakumar V, Prince Immanuel V, et al. Development of model for treatment of pulp and paper industry bleaching effluent using response surface methodology. Environ Prog Sustain Energy. 2012;31:558-565.
- Thirugnanasambandham K, Sivakumar V, Prakash Maran J. Application of chitosan as an adsorbent to treat rice mill wastewater: Mechanism, modeling andoptimization. Carbohyd Polym. 2013;97:451-7.
- Bhatti MS, Kapoor D, Kalia RK, et al. RSM and ANN modeling for electrocoagulation of copper from simulated wastewater: Multi objective optimization using genetic algorithm approach. Desalination. 2011; 274(1-3):74-80.
- Prakash Maran J, Manikandan S, Thirugnanasambandham K, et al. Box-Behnken design based statistical modeling for ultrasound-assisted extraction of corn silk polysaccharide. Carbohyd Polym. 2013;92:604-11.
- Maran JP, Sivakumar V, Sridhar R, et al. Development of model for barrier and optical properties of tapioca starch based edible films. Carbohyd Polym. 2013;92:1335-47.
- Thirugnanasambandham K, Sivakumar V, Prakash Maran J. Optimization of electrocoagulation process to treat biologically pretreated bagasse effluent. J Serb Chem Soc. 2013;78(5):613-26.
- Ravikumar K, Pakshirajan K, Swaminathan T, et al. Optimization of batch process parameters using response surface methodology for dye removal by a novel adsorbent. Chem Eng J. 2005;105:131-8.
- Ravikumar K, Krishnan S, Ramalingam S, et al. Optimization of process variables by the application of response surface methodology for dye removal using a novel adsorbent. Dyes Pigm. 2007;72:66-74.
- Kobya M, Hiz H, Senturk E, et al. Treatment of potato chips manufacturing wastewater by electrocoagulation. Desalination. 2006;190:201-11.
- Kumar M, Infant Anto Ponselvan F, Ram Malviya J, et al. Treatment of bio-digester effluent by electrocoagulation using iron electrodes. J Hazard Mater. 2009;165:345-52.
- Tak Hyun K, Chulhwan P, Shin EB, et al. Decolorization of disperse and reactive dyes by continuous electrocoagulation process. Desalination. 2002;150:165-75.
- Zhang H, Zhang D, Zhou J. Removal of COD from landfill leachate by electro-Fenton method. J Hazard Mater. 2006;135:106-11.
- Bautistaa P, Mohedanoa P, Gilarranza MA, et al. Application of Fenton oxidation to cosmetic wastewaters treatment. J Hazard Mater. 2007;143:128-34.
- Zhang H, Choi HJ, Huang CP. Optimization of Fenton process for the treatment of landfill leachate. J Hazard Mater. 2005;125:166-74.
- Deng Y. Physical and oxidative removal of organics during Fenton treatment of mature municipal landfill leachate. J Hazard Mater. 2007;146:334-40.
- Abu Hassan MA, Pei li T, Zainon Noor Z. Coagulation and flocculation treatment of wastewater in Chicken processing industry using chitosan. J Chem Nat Resour Eng. 2004;4:43-53.
- Gül?, ÖzcanÖ, Erbatur O. Ozonation of C.I. Reactive Red 194 and C.I. Reactive Yellow 145 in aqueous solution in the presence of granular activated carbon. Dyes Pigm. 2007;75(2):426-31.
- Gül ?, Özcan-Y?ld?r?m Ö. Degradation of reactive red 194 and reactive yellow 145 azo dyes by O3 and H2O2/UV-C processes. Chem Eng J. 2009;155(3):684-90.
- Sridhar R, Sivakumar V, Prince Immanuel V, et al. Development of model for treatment of pulp and paper industry bleaching effluent using response surface methodology. Environ Prog Sustain Energy. 2012;31:558-65.
- Ravikumar K, Pakshirajan K, Swaminathan T, et al. Optimization of batch process parameters using response surface methodology for dye removal by a novel adsorbent. Chem Eng J. 2005;105:131-38.
- Thirugnanasambandham K, Sivakumar V. Microwave assisted extraction process of betalain from dragon fruit and its antioxidant activities. J Saudi Society Agric Sci. 2017;16(1):41-48.

