Research
, Volume: 21( 1)Assessment of the Levels of Toxic and Essential Metals in Fish, Water and Sediment Samples from Argungu River, Kebbi State
- *Correspondence:
- Mohammed A. Zanna
Department of Pure and Industrial Chemistry,
Federal University,
Birnin kebbi,
Nigeria
E-mail: mohammed.zanna@fubk.edu.ng
Received: December 17, 2020; Accepted: December 21, 2020; Published: March 27, 2021
Citation: Assessment of the Levels of Some Toxic and Essential Metals in Fish, Water And Sediment Samples From Argungu River, Kebbi State. Anal Chem Ind J. 2021;21(1):1-11.
Abstract
This study deals with the quantification of some toxic and essential metals. Zn, Pb, Mn, Cu, Ni, and Cd in the water, fish and sediment Samples collected from Jakara dam, Minjibir, Kano. The water samples were collected using 4 liter plastic container dipped below the surface at the designated points. The sediment samples were collected using stainless steel auger from five (5) points randomly taken and homogenize in clean plastic bucket and air dried then sieved using 2 mm mesh. The fish species tilapia, cat and lung fish were purchase from the fishermen at the dam site during each visit. The samples were individually digested using aqua regia at 100˚C for three hours. The results showed that tilapia, and cat fish have highest levels of essential metals while lung fish has highest levels of toxic metals. The water samples have the highest levels of metals than sediment. The water samples have metals concentration in this order 0.773 ± 0.546>0.0585 ± 0.0414>0.0364 ± 0.0257>0.0230 ± 0.0162>0.0126 ± 0.0089>0.0138 ± 0.0098 while sediment samples have metals concentration in this order 1454.16 ± 0.0411>966.66 ± 0.0227>674.72 ± 0.0190>576.66 ± 0.0163>187.07 ± 10.018>0.1233 ± 0.0087. In the gills of cat fish the concentration were in the order 7633.25 ± 0.145>966.67 ± 0.0195>606.67 ± 0.0313>378.32 ± 0.0151>352.5 ± 0.0871>341.67 ± 0.0051. Bones of cat fish have metals concentration in this order of 3050 ± 0.0643>785.82 ± 0.0224>339.17 ± 0.0135>0.305 ± 0.201>0.0386 ± 0.0156>0.0136 ± 0.0052. While flesh of cat fish have metals concentration in this order 6799.17 ± 0.137>1808.32 ± 0.0269>492.50 ± 0.145>473.32 ± 0.010>400 ± 0.0032>25.08 ± 0.0010. In tilapia fish gills metals concentration are in the order of 6822.5 ± 0.147>4108.32 ± 0.094>1800.32 ± 0.0621>668.32 ± 0.0267>590 ± 0.0175>400 ± 0.00670. The bones of tilapia fish have metals concentration in the order 8108.32 ± 0.168>2058.32 ± 0.0461>Pb>Mn>Ni>Cd while flesh have metals in the order of Zn>Cu>Mn>Pb>Ni>Cd. Lung fish have metals in the order of Cu>Zn>Mn>Cd>Pb> Ni. Tilapia and cat fish have highest levels of essential metals and which is good for human consumption and within the permissible heavy metals for human consumption set by FAO/WHO Recommendation were exceeded in the edible portions. All the elements are above FOA/WHO recommendation.
Keywords
Heavy metals; Fulvic acids; Toxic metals
Introduction
Heavy metals may occur in aquatic environments from natural processes and from discharges or leachates from several anthropogenic activities [1]. The contamination of natural waters by heavy metals negatively affects aquatic biota and poses considerable environmental risks and concerns [2]. Monitoring programmed and research on heavy metals in aquatic environments samples have become widely important due to concerns over accumulation and toxic effects in aquatic organisms and to humans through the food chain Contaminants can persist for many years in sediments, fish in both freshwater and marine systems where they hold the potential to affect human health and the environment [3]. Sediments are an important sink of a variety of pollutants, particularly heavy metals and may serve as an enriched source for benthic organisms [4] especially in estuarine ecosystems. Metals may be present in the estuarine system as dissolved species, as free ions or forming organic complexes with humic and fulvic acids. Additionally, many metals e.g. Pb associate readily with particulates and become adsorbed or co-precipitated with carbonates, oxide, hydroxides, sulphides and clay minerals. Consequently, sediments accumulate contaminants and may act as long-term stores for metals in the environment [5]. Exposure of sediment-dwelling organisms to metals may then occur via uptake of interstitial waters, ingestion of sediment particles and via the food chain [6].
Materials and Methods
Sample was collected from Jakara dam which is located at Minjibir Local Government Area Kano State-Nigeria. The different species of fish were collected from the study site of the dam by fishermen. The entire sample, were collected due to availability of samples of fish of consumption. The collected fish samples are (tilapia fish, cat fish and lung fish) were properly labelled, packaged and transported to the laboratory for identified and preparation and analyses. Also sediment and water samples were collected in the same site with fish in Jakara dam.
Sample Collection
Sediment samples were collected using stainless steel soil anger to collect core samples at a 15 cm soil depth for each water in serves 5 core samples randomly taken were homogenized in a plastic bucket and composited. (Amodor 1998)The sediment samples were taken and air dried crushed and sieved using 2 mm mesh. The samples were kept in a plastic container and labeled accordingly [7]. The samples of available fish species are (tilapia fish, cat fish and lung fish) in jakara dam minjibir were purchased from fishermen at the dam site. They were properly and carefully washed and cut into pieces.
Water samples were collected using 4L plastic container and fetch the water at the designated point rise by 0.1N nitric acid and keep in deep freezer for of the time for analyses.
Digestion
2 g of sediment samples were digested with 5 ml of HNO3 15 m l HCL and placed on a lot plate at 100⁰C for 3 hours after cooling the digest was filtered into a 100 ml volumetric flask and made up to the mark with distilled water.
2 g of Gills, Bones, and flesh samples separately digested with 5 ml HNO3 15 ml HCL and place on a lot plate at 100⁰C for 3 hours after cooling the digest was filtered into a 100 ml volumetric flask and made up to the mark with distilled water.
Water samples were evaporated from 4l ml to 250 ml was also digest with 5 ml HNO3 15 ml HCL on hot plate at 100˚C for three hours after cooling the digest was filtered into volumetric flask made up to the mark with distilled water.
Instrumentation
Atomic Absorption Spectrometry (AAS) is an analytical technique that measures the atoms of different elements. Absorb characteristics wavelengths of light. Analyzing a samples to see if it contains a particular element means using light from that element for example with lead, a lamp containing lead emits light from excited lead atoms that produced the right from mix of wavelength, to be absorbed by any lead atom from the sample, in AAS, the sample is atomized- i.e. converted into grown state free atoms in the vapor sate and a beam of electromagnetic radiation emitted from excited lead atoms is passed through the vaporized samples. Some of the retention is absorbed by the lead atom in the samples the greater the number of atoms there is in the vapor, the more radiation is absorbed. The amount of light absorbed I proportional to the number of lead atoms. A calibration curve is constructed by running several samples a known lead concentrate in the unknown samples consequently an atomic absorption spectrometer needs the following three components. A light source, a sample cell to produce gaseous atoms and means of measuring the specified light absorbed.
Results and Discussion
Results
| Sample | Pb | Mn | Zn | Ni | Cu | Cd |
|---|---|---|---|---|---|---|
| Sediment | 576.66688 ± 0.016311 |
1454.1628 ± 0.04113 |
674.725 ± 0.019084 |
0.12333 ± 0.008721 |
966.665 ± 0.0227341 |
187.07 ± 10.018707 |
| Water | 0.0230085 ± 0.016269 |
0.05855566 ± 0.041405 |
0.0364664 ± 0.025786 |
0.0138666 ± 0.009805 |
0.0773333 ± 0.054683 |
0.01264 ± 0.008938 |
| Gills cat | 606.675 ± 0.031315 |
352.5 ± 0.087126 | 7633.25 ± 0.145026 |
341.675 ± 0.005188 |
966.675 ± 0.019517 |
378.325 ± 0.015133 |
| Bone cat | 785.825 ± 0.022485 |
3050 ± 0.06432 | 0.305333 ± 0.20193 |
0.013667 ± 0.005292 |
0.038667 ± 0.015674 |
339.175 ± 0.013567 |
| Flesh cat | 473.325 ± 0.010328 |
492.50 ± 0.145172 | 6799.175 ± 0.137834 |
400 ± 0.003202 | 1808.325 ± 0.026913 |
25.0825 ± .0.0010033 |
| Gills tilapia | 590 ± 0.01758 | 4108.325 ± 0.09438 | 6822.5 ± 0.14762 | 400 ± 0.006702 | 1800.325 ± 0.062179 |
668.325 ± 0.026733 |
| Bone tilapia | 655.825 ± 0.015835 |
5308.325 ± 0.111718 |
8108.325 ± 0.168915 |
350 ± 0.003862 | 2058.325 ± 0.046126 |
458.325 ± 0.018333 |
| Flesh | 803.325 ± | 2258.325 ± | 13067.5 ± | 0.0001 ± 0.004787 | 144.1675 ± | 647.15 ± 0.0259 |
| tilapia | 0.020572 | 0.533181 | 0.415885 | 0.02473 | ||
| Lung fish | 320.825 ± 0.008342 |
4250 ± 0.111524 | 7787.5 ± 0.155991 | 183.325 ± 0.004787 |
18000 ± 0.028408 | 620 ± 0.0248 |
TABLE 1: Heavy Metals Analysis mg/kg.
Discussion
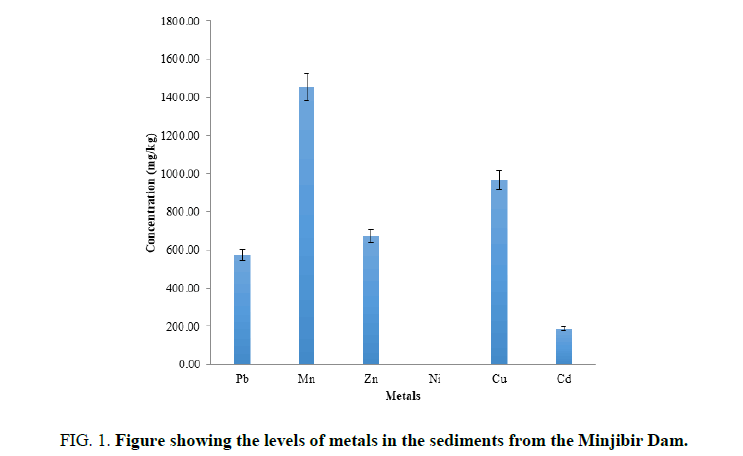
FIG. 1 showed the mean concentration of heavy metals determined in sediment in Jakara Dam, Minjibir, The mean metal concentrations is in sediment are in order Mn>Cu>Zn>Pb>Cd>Ni (TABLE 1). All the heavy metals Analyzeds in sediment are above the recommended levels by WHO and USEPA [8,9]. The presence of these heavy metals in the sediments could be attributed to discharge of industrial effluents, municipal and residential waste which is similar to the observation of [10].
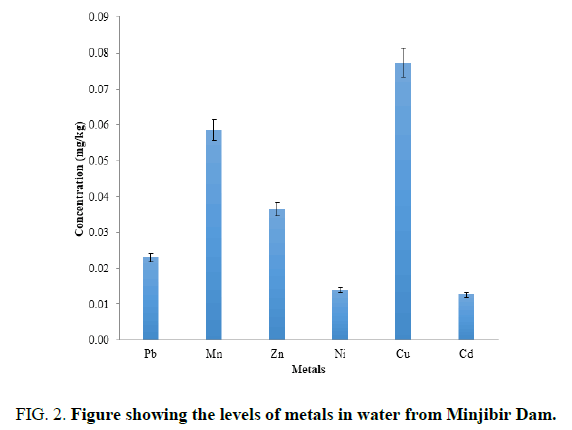
FIG. 2 showed that the mean concentration of heavy metals in water samples in Jakara dam, Minjibir. And the metal concentrations are in this orders Cu>Mn>Zn> Pb>Cd>Ni. And when compared with WHO [8] recommendation in water, all the elements were above the standard levels the observed levels could be contamination of the water by industrial and municipal waste into to the water. The higher concentration levels of these heavy metals could be attributed to anthropogenic source arising from solid and liquid wastes discharged by cottage industries located in the area. Ni has the least concentration in the water, while the levels order was found to have changed when compared to the sediment, with Cu, being higher than Mn.
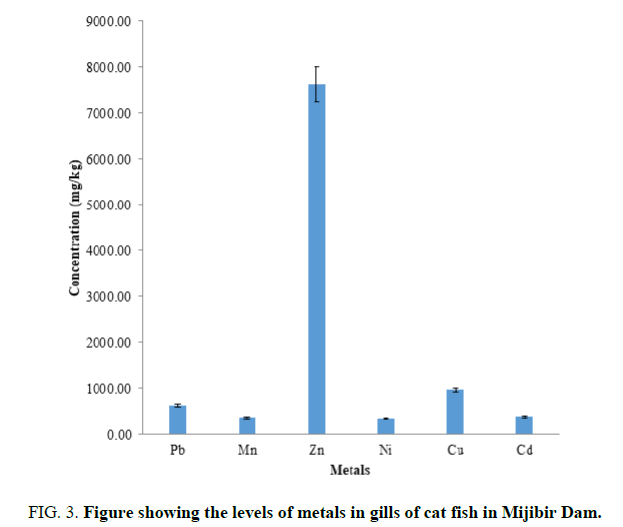
FIG. 3 shows the levels of metals in the gills of catfish obtained from the minjibir dam. The metals are in the order Zn>Cu>Pb>Ni>Mn>Cd. The elements are above of WHO [11] recommended levels implying that the fish posed immediate hazard to people consuming them. The sample however recorded significantly higher concentration levels when compared other studies show [12] the Zn levels in the gill is much higher than the levels found in the water and sediment of the same site. This shows that catfish accumulates the metal more than the water and sediment.
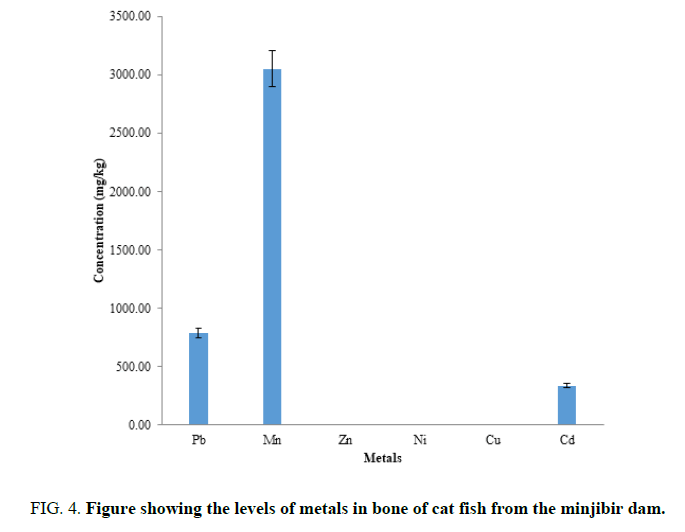
FIG. 4 shows the mean concentration of heavy metals determined in bone of catfish and are in this order Mn>Pb>Cd>Zn>Ni>Cu. Mn has no limit as by WHO in the bone of catfish but research by Sani [12] showed high levels of Mn. The toxic metals determined were higher than the WHO limits ,thus the bones of catfish from this dam should not be consumed.it is observe that most of the Pb is stored in the bones than other part of fish body. This is good since people do not consume fish bones.
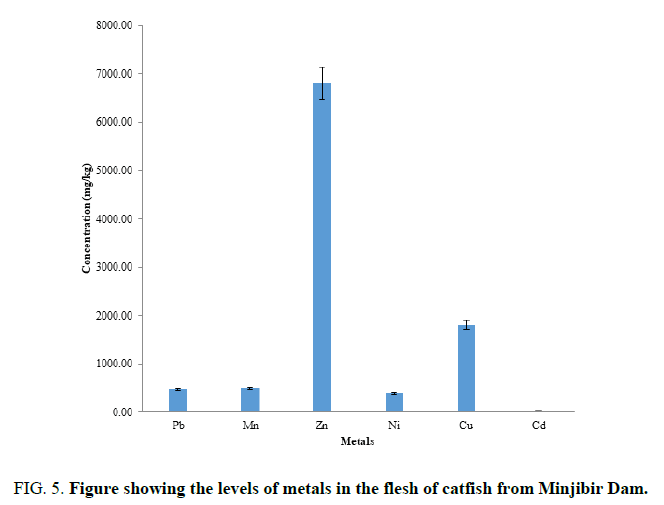
FIG. 5 shows the levels of metals in the flesh of catfish are in the order Zn>Cu>Mn>Pb>Ni>Cd. Essential metals were determined is higher than the WHO limits in the flesh of catfish. The toxic metals determined are in within the levels of WHO limits. The flesh of the fish should be consume.it is observe the most the Zn is stored in the flesh than the other part of fish body. It is good to consume since Zn is essential.
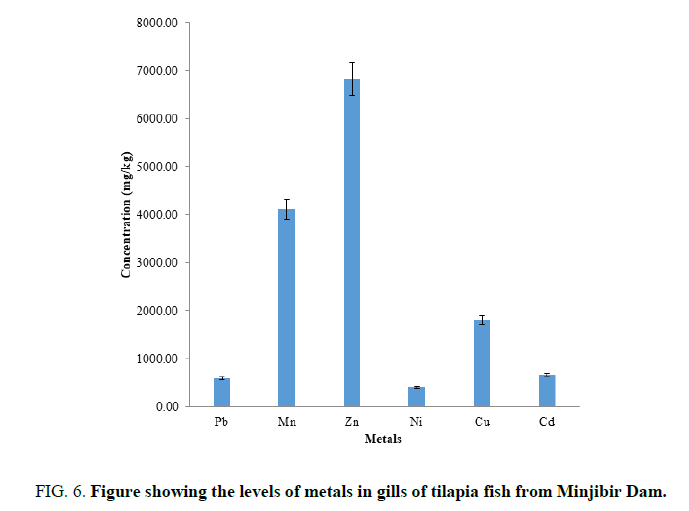
FIG. 6 shows the mean metals concentrations in the gills of tilapia and are in the order Zn>Mn>Cu>Cd>Pb>Ni. The higher level of Zn observer in this work is similar to what [13] was reported when compared to WHO level of the Zn is extremely high. The consumption of fish with high Zn levels could result to intestinal irritants, nausea and abdominal pain while prolonged exposure could result in copper deficiency and subsequent anemia [14].
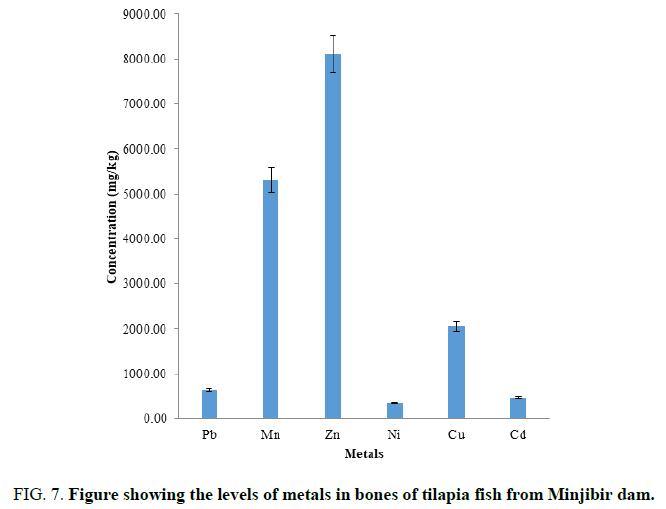
FIG. 7 showed the mean concentration of heavy metals determined in the bones of tilapia fish are in the order Zn>Mn>Cu>Pb>Cd>Ni. Essential metals were determined in the bone tilapia fish is higher than WHO limits. The toxic metals were also higher than the WHO limits, thus the Bones of tilapia fish from this Dam should not be consumed. It is observed that the Zn is stored in the bones of than the other part of the fish body. This is good since people do not consume fish bones.
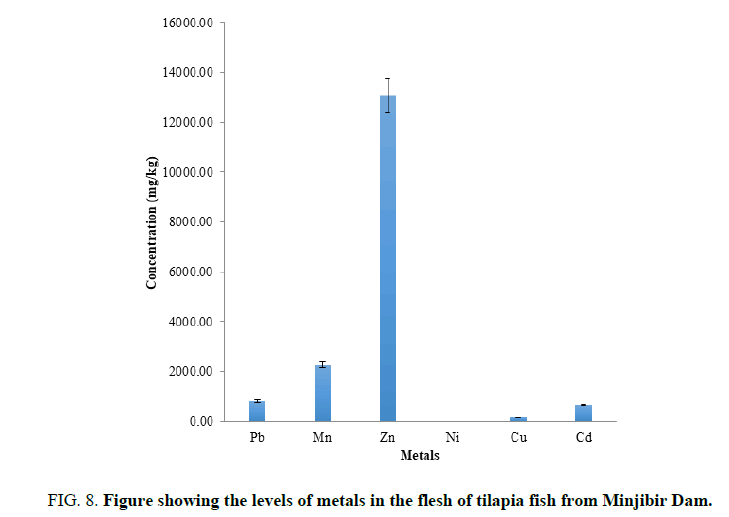
FIG. 8 shows the mean concentration of heavy metals in flesh of tilapia fish are in the order Zn>Mn>Pb>Cd>Cu>Ni. Essential metals are higher compared to the WHO limits in the flesh of tilapia fish. The toxic metals determined were higher than the WHO limits, the flesh of tilapia fish from the dam should not be consume.is observed that the most of the Zn is stored in the flesh than other part of the fish body. The fish is not recommended due to the extremely high levels of the toxic metals.
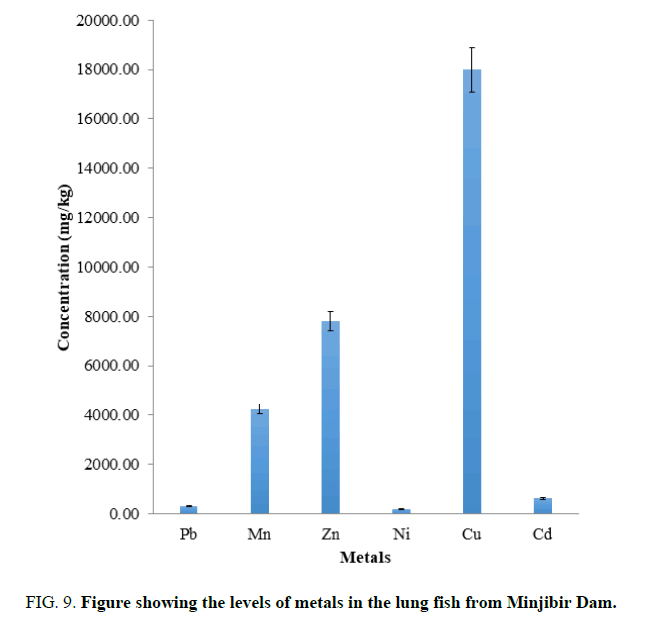
FIG. 9 showed the mean concentration of heavy metals in lung fish are in the order Cu>Zn>Mn>Cd>Pb>Ni. The Essential metals are higher compared to WHO limits. The toxic metals determined in lung fish were higher than the WHO limits. The lung fish of that Dam should not be consumed due to the levels of the toxic metal.it is observed that most of the Cu is stored in the lung fish than other elements.
Figure 9: Figure showing the levels of metals in the lung fish from Minjibir Dam.
Conclusion
In conclusion, It was generally observed that the concentration of the metals in the gills, bones, and flesh of the fish sample of Tilapia fish and Catfish analyzed are in the following order Zn>Mn>Cu>Pb>Cd>Ni. In Lung fish the concentration of metals are also in the following order Cu>Zn>Mn>Cd>Pb>Ni. In both water and sediment, the concentration of metals are in the order Mn>Cu>Zn>Pb>Cd>Ni. All the sample analyzed are above WHO recommendation standard limit. The observed differences in metal concentrations in the three species of fish examined indicated the differences in metal uptake as reported by WHO.
The reason for higher metal uptake in all fish generally depends on the accumulation of metal concentrations, time of exposure, way of metal uptake, environmental conditions (water temperature, pH, hardness, salinity), and intrinsic factors (fish age, feeding habits).
References
- Wandiga SO, Onyani JM, Benz JP. The effects of sewage on trace metal concentrations and scope for growth in Mytilus edulis aoteanus and Perna caliculus from Wellington Harbour, New Zealand. Sci Total Environ. 1988;12: 263-88.
- Cajaraville MP, Bebianno MJ, Blasco J, et al. The use of biomarkers to assess the impact of pollution in coastal environments of the Iberian Peninsula: a practical approach. Sci Total Environ. 2000;247(2-3):295-311
- Mackeviciene. Levels of Some Heavy Metals in Tissues of Fish, Ethmallosa fimbriata from Forcados River. J Appl Environ Biol Sci. 2002;1:44-7.
- Wang WX, Fisher NS, Rainbow PS. Heavy metals in water and some fishes of Buriganga River, Bangladesh. Int J Environ Res. 2002;4:321-32.
- Spencer KL, Macleod. Heavy metal concentrations in water, sediments and their bio-accumulations in fishes and oyster in Dhaleswari River. Terr Aquat Environ Toxicol. 2002;3:33-41.
- Luoma HJ. Bioaccumulation of some heavy metals of six fresh water Fishes caught from Lake Chad in Doron buhari, Maiduguri, Borno state, Nigeria. J App Sci Env Sani. 1989;4:103-14.
- Amodor MK. Assessment of heavy metal pollution in surface water. Int J Environ Sci Technol. 1998;5:119-24.
- Environmental Health Criteria No. 239. World Health Organization, Geneva. 2008.
- United States Environmental Protection Agency (USEPA) (1994). Sediment Sampling, US.
- Bryan. Analysis of some heavy metals in the riverine water, sediments and fish from river Ganges at Allahabad. Environ Monit Assess. 1980;157:449-58.
- Environmental Health Criteria No. 221: Zinc. World Health Organization, Geneva. 2001.
- Sani U. Determination of some heavy metals concentration in the tissues of Tilapia and Catfishes. Nigerian Society for Experimental Biology. 2011;23(2):73-80.
- Jarup L. Arsenic pollution at Obuasi gold mine, town and surrounding countryside. Environ Health Pers, 1998;12:131-5.
- Reilly C, Riget F, Johanson P, et al. Metal contamination of food. Blackwell Science Limited. USA, 2002;81-194.
