Original Article
, Volume: 17( 2)Application of Capillary Electrophoresis on the Analysis of Polyoxometalates
- *Correspondence:
- Legesse A Department of Chemistry, Ambo University, Ethiopia, Tel: +251 11 236 2006; E-mail: abishalom.com@gmail.com
Received: December 04, 2017; Accepted: December 29, 2017; Published: January 6, 2018
Citation:Legesse A, Yang L. Application of Capillary Electrophoresis on the Analysis of Polyoxometalates. Anal Chem Ind J.2018;17(2):125.
Abstract
This research was carried out to separate of polyoxo-anions, P2Mo5, Mo7 and Mo8, by Capillary electrophoresis. The equilibrium conditions, stability and solubility of these polyoxoanions are also studied. The equilibrium depends both on the concentration and pH of the solution. Counter ions have also an effect on the equilibrium of these Polyoxomolybdate. The interaction of polyoxomolybdate with different counterions, namely Na+, K+, Li+ and NH4+, is also part of this study. This kind of interaction is important in determining POM properties and consequently their application. Their properties and structure can be also controlled by interacting with cations. The affinity of these cations with POM and their stability was observed from electropherogram. On other way, the interaction of POM with five specific amino acids is also characterized using CE. These five amino acids includes negatively charged (D-Aspartate and D-Glutamate), neutral (L-Leucine and L-Phenylalanine) and positively charged (L-Histidine) to study the effect of the charges of amino acids on interaction with diphosphopentamolybdate. Lastly, the interaction of Polyoxomolybdate with α-CD and β-CD is also studied. α), have optimal limits.
Keywords
Polyoxometalates; Capillary electrophoresis; Separation; Polyoxoanion; Diphosphopentamolybdate
Introduction
Polyoxometalates (POMs) are discrete anionic inorganic metal-oxide cluster of transition metals (W, Mo, V, Nb, Ta) in their highest oxidation state which have interesting structural, physical and chemical properties [1-3]. They can be isopolyanions (IPA) with a general formula [MmOy] q, in which M is from a single element, or heteropolyanions (HPA) which incorporate a variety of heteroatom [4,5]. The composition and structural diversity of POM enables a wide versatility in terms of shape, redox potentials, surface charge distribution, polarity and acidity [3]. Currently, POMs are attracting the attention of many researchers due to their potential application in catalysis, medicine, nanoscale science and material science [1,6-9].
Particularly, antitumoral, antiviral, notably anti HIV and antibiotic [10-12] properties of POMs in terms of their specific POM-protein interaction [13-18] have been reported which open an opportunities in biomedical studies [19-23].
POMs are very unstable and undergo rapid and complex structural equilibria in aqueous solution. The equilibria depend on pH and concentration [5]. Solution equilibria have been studied by X-ray diffraction [14,24,25], NMR [7,26], FT- IR [26,27] and ESI-MS [4]. However, these techniques are time consuming,laborious, insensitive, or non-specific and the results obtained are often subjected to interpretation [5]. NMR is usually of limited use in case the structures are labile or paramagnetic and for poor receptive nuclei [28]. On other way, ESI-MS based methods may manipulate the result during the transfer of solution ions to the gas phase in the electrospray process.
Though POMs are unstable and have complex solution equilibria, a little success has been reported in separation science. In 1989, A. D. Kirk [29] used reversed-phase HPLC to separate highly charged POM ions. However, this method is of limited use in pharmaceutical and biomedical application as well as in solution equilibria study of POMs because the mobile phase may result in decomposition of polyoxometalates. Owing to the growing interest of POM, the development of electrophoretic technique in this area is important due to its simplicity, sensitivity and high efficiency [30]. Not only this, the relatively short analysis times and low operational cost as well as the better compatibility of sample matrix and background electrolyte (BGE) compositions will make this technique a promising method in the development of POMs. Over a decade ago, K. Hettiarachchi and coworkers [5] have reported a remarkable application of CE in this area. However, there have been very limited reports since then, due to a challenging instability of POMs. In 2003, Himeno and Kitazumi reported the formation and transformation of isopolytungstates in aqueous and aqueous-CH3CN media using capillary electrophoresis [31].
Experimental Method
Chemicals
Acetic acid, ethanol, sodium hydroxide, potassium hydroxide, lithium hydroxide and ammonium hydroxide were obtained from Beijing Chemical works (Beijing, China). α- and β-CD were purchased from Seebio Biotechnology, Inc (Shanghai, China) and Shanghai huishi chemical factory (shanghai, china), respectively. All D- and L-amino acids were purchased from Shanghai Maikun chemical Co., Ltd. (Shanghai, China). [(CH3)4N]3 Na[(C6H5PO3)2Mo5O15]. 6H2O, (NH4)4 [(C6H5PO3)2Mo5O15. 5H2O, ammonium molybdate tetrahydrate ((NH4)6Mo7O24. 4H2O), sodium molybdate dehydrate, phenyl phosphonic acid, hydrochloric acid, tetra methyl ammonium chloride and ammonia. All reagents were of analytical grade. Pentamolybdobis (phenylphosphate) was synthesized according to [32].
The acetate buffers of Na, K, Li and NH4 were prepared by dissolving NaOH, KOH, LiOH and NH4OH in 50 mm HAc, respectively to pH 5. Sample solutions of diphosphopentamolybdate and amino acids were prepared in run buffer. All the solutions were prepared daily and filtered through an inorganic 0.2 mm membrane prior to use.
Instrumentation
All CE experiments were carried out on CE apparatus (CL1020 Beijing Cailu Science Apparatus, China) with UV detector at 251 nm. Fused-silica capillaries (50 mm ID, 365 mm OD) of 50 cm total length (effective length 41 cm) were supplied by Hebei Yongnian Optical Fiber Factory, China. Capillaries were conditioned prior to use by pressure rinsing with 0.1M NaOH for 15 min, distilled water for 5 min and run buffer for 2 min, successively. If the run buffer changed, the capillary would be rinsed with the new buffer for 30 min.
Separation was performed with cathode at the injection side and samples were injected hydrodynamically at a height differential of 10 cm for 2 s. The electrophoretic separation voltage was set at -400 V/cm.
The FTIR spectra of the synthesized Pentamolybdobis (phenylphosphate) isopolyanion and heteropolyanion were carried out on a fluorescence spectrometer (Varian).
Results and Discussion
The diphosphopentamolybdate anion is built up of five MoO6 octahedra and two PO4 tetrahedra. The octahedra shares four edges and one corner and form pentagonal ring. Each MoO6 octahedra has four bridging oxygen atoms and two terminal oxygen atoms. The PO4 tetrahedra are attached each one to one side of the ring by three oxygen atoms (FIG. 1a ). The two phosphate units connected directly to two phenyl groups. The Mo7 ion is composed of seven MoO6 octahedra (FIG. 1b ) and each connected by bridging Oxygen. Similarly, the Mo8 is built up of eight MoO6 octahedra (FIG. 1c ).

Figure 1: Polyhedral and ball/stick drawing of a) P2Mo5 b) Mo7 ion c) Mo8 ion. Color code: MoO6 octahedra=green, Phosphorous= yellow, Phenyl=black, Oxygen=red,
FTIR Characterization
IR spectra of polyoxoanions (P2Mo5, MO7, and Mo8 ions) were measured at room temperature. The characteristic peaks at 1047, 1000, 977, 911 and 890 cm-1 are attributed to ν (P–O), ν (Mo=O) and ν (Mo–O–Mo), respectively. The characteristic bands in the region of 1634, 1595 and 1412 cm-1 can be regarded as features of organic molecules in these compounds. A broad band at 3450 cm-1 was due to the O–H stretching vibration of water.
Concentration dependence of P2Mo5 Equilibria
POM equilibria depend on concentration, pH and counter ions. To study this dependence, we discussed the effects of these three factors on equilibria independently. Different solutions of diphosphopentamolybdate were prepared in the running buffer to study the concentration dependence of isopolyanion and heteropolyanion of polyoxomolybdate equilibria. The running buffer was 50 mm NaAc buffer at pH 5.
Mo8- ⇔ P2Mo5 ⇔ MO7 (2.1)
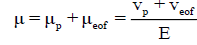
The dependence of this equilibrium (Eq. 2.1) on the concentration of diphosphopentamolybdate was revealed by the electropherogram as shown in FIG. 2 . The technique of capillary electrophoresis was designed to separate species based on their charge to size ratio in the interior of a small capillary filled with an electrolyte. The electrophoretic migration mobility (μp) of an analyte toward the electrode of opposite charge is:
 (2.2)
(2.2)

Figure 2: Concentration dependence of P2Mo5 sample prepared in Sodium acetate buffer at a pH 5.
where vp and μp are the electrophoretic velocity and mobility, and E is the electric field strength. The electrophoretic mobility is proportional to the ionic charge to size ratio of a sample. The velocity of migration of an analyte in capillary electrophoresis is also dependent upon the rate of electroosmotic flow (EOF) of the buffer solution. The apparent mobility (μ) of an analyte in an electric field is the resultant of its electrophoretic mobility and EOF as:
 (2.3)
(2.3)
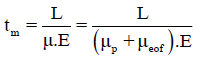
Where veof and μeof are the electroosmotic velocity and mobility. In a typical system, the electroosmotic flow is directed toward the negatively charged cathode so that cations will be accelerated, while anions will be decelerated. Thus the apparent migration time (tm) of an analyte, i.e., how long an ion takes to travel through a certain distance (L, from the capillary inlet to detection window) under a definite electric field is defined as:
 (2.4)
(2.4)
In this work, the magnitude of the electrophoretic mobility of MO7, P2Mo5 and Mo8 ions with reversed direction to EOF exceed the EOF mobility, thus negative separation voltage was applied for electrophoretic separation and the samples were injected at cathodic end of the capillary. The electroosmotic mobility was experimentally determined by measuring the retention time of a neutral marker (ethanol). As shown in FIG. 2, three peaks were observed as the concentration of diphosphopentamolybdate sample in the low concentration range (< 2.5 mm). Three migration peaks, representing MO7 (peak I), P2Mo5 (peak II) and Mo8 (peak III) ions were obtained based on their electrophoretic mobility, which is proportional to the charge to size ratio. Components with higher charge to size ratio have a greater mobility and shorter apparent migration time. Here we assume that MO7, P2Mo5 and Mo8 ions are global and their charges to size ratios are proportional to their charge to mass ratios. The charge to mass ratio of MO7, P2Mo5 and Mo8 ions was calculated to be 5.7 × 10⁻³, 4.0 × 10⁻³ and 3.4 × 10⁻³ e?mol/g, respectively. Thus the order of electrophoretic mobility were MO7>P2Mo5>Mo8. Therefore, the peak I, II and III was corresponding to MO7, P2Mo5 and Mo8 ions, respectively. According to the electropherograms and Eq. 2.4, the electrophoretic mobility of MO7, P2Mo5 and Mo8 ions were also calculated to be 8.85 × 10⁻⁴, 7.35 × 10⁻⁴ and 6.8 × 10⁻⁴ (cm2s-1V-1), respectively.
With an increase of diphosphopentamolybdate concentration larger than 2.5 mm, MO7- ion becomes unstable and peak I is broadened. However, P2Mo5 and Mo8 present pretty good stability under the whole concentration range (0.625 mm – 20 mm) and show nice defined peaks. The peak area of peak I (MO7-) was measured as the shallow area and that of peak II and III was measured as Gauss peaks. The effect of diphosphopentamolybdate concentration on the peak areas of MO7, P2Mo5 and Mo8 ions was shown in FIG. 3. With increasing diphosphopentamolybdate concentration, the peak area of both peak I (MO7) and peak II (P2Mo5) was increased, while peak III did not shown a notable change. As the concentration of diphosphopentamolybdate is less than 2.5 mm, MO7 is the dominating component. However, with increasing diphosphopentamolybdate concentration, the increase rate of peak area of P2Mo5 is greater than that of MO7, which peak area even became little decreased when the concentration of diphosphopentamolybdate is larger than 15 mm. Obviously, P2Mo5 becomes the dominating component instead of MO7 at the higher concentration (>10 mm). The change of relative peak areas of peak I, II and III indicates that the equilibrium was shifted from MO7- to P2Mo5 (Eq. 2.1) to counteract the imposed concentration increase and a new equilibrium was established. The third peak did not show a notable change. This may show that Mo8- was unfavorable at buffer pH 5 and does not involved in the equilibrium. As a result, the equilibrium lies only between P2Mo5 and MO7- under the above conditions. Diphosphopentamolybdate was stable in all concentrations. MO7 ion was stable at a concentration ≤ 2.5 mm.

Figure 3: Concentration dependence of P2Mo5 sample prepared in Sodium acetate buffer at a pH 5.
Interaction of diphosphopentamolybdate with different counter-ions
In the solution of POM, the study of interaction between POMs and their counter-ions is important for determining their properties and consequently their applications. Their properties and structure can be also controlled by interacting with cations. Herein, the interaction of diphosphopentamolybdate with four counter-ions, Na+, NH4+, Li+, and K+ was described.
The peak area of the sample with same concentration was not the same in interaction with different counter-ions due to the different affinity of cations for the cluster of diphosphopentamolybdate. The respective peak areas for peak I and II were plotted against the sample concentration in different buffers, and the results are shown in FIG. 4. The intensity of the peak I was high in NH4Ac buffer which indicate that there was high interaction between MO7- ion and NH4+ ion.

Figure 4: Peak area of peak I and II Against the Concentrations of Phenyl Diphosphopentamolybdate dissolved in 50 mm NaAc, KAc, LiAc and NH4Ac in PH = 5.0.
In NH4Ac buffer, peak I was increased slowly as the concentration of diphosphopentamolybdate increased to 15 mm, and then decreased as a concentration raised to 18 mm. At a concentration above 18 mm, the peak started to increase. Upon increasing the concentration of diphosphopentamolybdate, the peak I grew slowly in LiAc and NaAc, and fall after a concentration of 15 mm.
On the other hand, it grew monotonously in KAc buffer as a concentration was raised to 5 mm and very slowly when a concentration increased to 15 mm. Then it decreased slowly. The peak II showed a high intensity in LiAc, which indicate that P2Mo5- ion has high interaction with Li+ ion. The peak increased highly as the concentration was increased to 15 mm and then decreased gradually. In NH4Ac, the second peak was increased as the concentration increased to 10 mm and decreased slowly at a concentration >10 mm. The peak also increased in KAc with an increased diphosphopentamolybdate concentration and reached its maximal at a concentration of 15 mm. Then decreased as a concentration of diphosphopentamolybdate was raised to 18 mm and grow slowly at a concentration >18 mm.
The interaction between diphosphopentamolybdate and sodium ion was discussed in section 3.3. As shown in FIG. 4, the first peak was increased from a concentration of 0.625 mm to 5 mm and was stable as observed from the electropherogram obtained. This indicates that the equilibrium was shift from P2Mo5 to MO7-, as described for the interaction of Na+ with diphosphopentamolybdate.
As the concentration increased from 10 mm to 20 mm, the first peak was also increased, but MO7- was unstable in this concentration range. The second peak also increased slightly from a concentration of 0.625 to 5 mm. This shows that, as the concentration of diphosphopentamolybdate increased, the equilibrium shift from P2Mo5 to MO7- (Eq 2.1) until a new equilibrium established. The peak intensity continued to increase strongly from a concentration of 5 mm to 20 mm. On the other way, the third peak was not recognizable, which indicate that the equilibrium lies between MO7- and P2Mo5. It is obvious that the interaction between POM and NH4+ is through hydrogen bonding.
Diphosphopentamolybdate was more stable in interaction with Lithium ion, as observed from FIG. 4. The first peak was increased with the increased concentration of diphosphopentamolybdate, as that of interaction with Na+ and NH4+. As the concentration of diphosphopentamolybdate increase, the equilibrium shift from P2Mo5 to MO7- and a new equilibrium was established, according to Li Chatelier’s principle.
The second peak was also increased slightly as a concentration increased from 0.625 mm to 5 mm and then strongly from 10 mm to 20 mm. As we observed from the shape of the peaks, the interaction between the sample and Lithium ion was very stable than the other counter-ions that were under investigation.
This results from the strong affinity of Lithium ion to POM. Counter-ions that have strong affinity for the oxoligands, for example Li+, Na+, interact strongly with the cluster [1,2] and Li+ have strong affinity for oxoligands when compared to Na+ ion, due to its small size. On the other way, there was no third peak which indicates that, the equilibrium lies between P2Mo5- and MO7- and the pH of the buffer solution may not favor the interaction of Mo8- with Lithium ion.
Unlike Li+ and Na+ ions, K+ ion has less affinity for the cluster. Instead, they are located as solvated ions and are not bonded to POM [2]. The height of the first peak was increased as a concentration increased from 0.625 mm to 5 mm (FIG. 5 ), which indicates that the equilibrium was shift from P2Mo5- to MO7- and reestablished.

Figure 5: Electropherogram of 5 mm diphosphopentamolybdate prepared in a 50 mm Naac buffer at pH range of 4.4 - 5.6.
MO7- was more stable at this concentration range. As the concentration was raised above 5 mm, the peak height was increased, but MO7- was very unstable in interaction with K+ ion. The second peak was also increased as a concentration increased. The migration time of the second peaks at a concentration of 15 mm, 18 mm and 20 mm were increased as compared to concentrations less than 15 mm. There was no third peak observed, which indicate that Mo8- did not take part in the equilibrium.
Buffer pH dependence of equilibria
At higher pH: Diphosphopentamolybdate sample were prepared in a 50 mm NaAc buffer solution with various pH values. Three migration peaks were obtained from the electropherogram recorded. As the buffer pH was raised from pH= 5 to pH=5.8 (FIG. 5), the first peak was increased, which indicate that the equilibrium was shift from P2Mo5- to MO7- (eq. 2.1). The migration time of the first peak decreased as the pH increased. At a pH=6, the direction of the running buffer solution was changed and consequently the migration time of both first peak and second peak was increased. The second peak were decreased slowly as a pH increased from pH=5 to pH=5.8 and decreased strongly at a pH=6. This indicates that at a higher pH, the equilibrium shifts from P2Mo5- to MO7-. The migration time of the second peak were decreased as the pH of the buffer solution increased from pH=5 to pH=5.8. The height of the third peak also did not show a significant change at a pH= 5 to pH=5.8 and disappeared at a pH=6. This indicates that, the equilibrium lies mostly between P2Mo5- and MO7- at a higher buffer pH. The migration time of the third peak was decreased as the pH of the buffer increased.
At a lower pH: The first peak was decreased gradually as a buffer pH was decreased from pH=5 to pH=4.2 and disappeared (FIG. 5). The second peak were also decreased from a pH=5 to pH=4.6 whereas the third peak increased from a pH=5 to pH=4. These indicate that the equilibrium was shift from MO7- to Mo8- and at the same time from P2Mo5 to Mo8-. The P2Mo5 ion was unstable at pH< 4.4 as observed from FIG. 5. The equilibrium lies between P2Mo5- and Mo8- ions, as MO7- ion was disappeared at a lower pH. The migration time of the peaks were decreased as the pH was decreased. At a lower pH, Mo8- was more likely appeared in the equilibrium and disappeared at a higher pH. MO7- is more favorable at a higher pH whereas P2Mo5 were observed at pH=4.6 to pH=5.6 in the equilibrium.
Interaction of amino acids with diphosphopentamolybdate
Amino acids interact with polyoxoanions by forming covalent bond through their carboxylate groups [33,34]. We present the electropherogram of the interaction of diphosphopentamolybdate with typical amino acids. These typical amino acids are negatively charged (D-Aspartate and D-Glutamate), neutral (L-Leucine and L-Phenylalanine) and positively charged (L-Histidine) to study the effect of the charges of amino acids on interaction with diphosphopentamolybdate
The effect of amino acids on the electrophoretic mobility of Diphosphopentamolybdate was observed from the electropherogram recorded for each interaction of amino acid with diphosphopentamolybdate, which indicates the interaction of amino acids with Polyoxoanions as compared to the electropherogram of diphosphopentamolybdate prepared in a buffer with 0 mm of amino acids. The pH of the buffer solution was kept constant at a pH=5.
As the concentration of L-Histidine raised ( FIG. 6), the migration time of the sample was increased, which indicate the conjugation of L-Histidine with diphosphopentamolybdate as it have effect on the charge and mass of diphosphopentamolybdate. L-Histidine is positively charged amino acid. As a result the overall L-Histidine-diphosphopentamolybdate conjugate charge was decreased and the mass of the conjugate increased, which result to a slow electrophoretic mobility of the compound and consequently large migration time. The first peak was increased as the concentration of L-Histidine increased from 0 mm to 10 mm. This indicates that, the equilibrium were shift from P2Mo5 to MO7- (Eq 2.1) as a new compound introduced to the equilibrium, according to Le Chatelier’s principle. The order of the first and second peak was changed as a concentration of L-Histidine increased from 20 mm to 50 mm which indicate that, L-Histidine was conjugated more with MO7-. This can be observed from the fact that, the overall charge of MO7- – L-Histidine conjugate was decreased whereas the mass of the conjugate were increased which resulted to a larger migration time than that of P2Mo5 – L-Histidine conjugate. On the other way, the height of the second peak were increased as the concentration of L-Histidine increased, indicating that the equilibrium was shifted from P2Mo5 to MO7 ion. The Mo8- ion did not show any interaction with amino acids as there was no recognizable peak observed.

Figure 6: An electropherogram of a 5 mm phenyldiphosphopentamolybdate in 50 mm sodium acetate buffer At pH 5 containing L-histidine.
The interaction of diphosphopentamolybdate with D-Aspartate was also described as shown in FIG. 7. As the concentration of D-Aspartate was raised, the height of the first peak was increased and the second peak was decreased. This indicates the equilibrium shift from P2Mo5 to MO7 ion as D-Aspartate has effect on the equilibrium. D- Aspartate is charged negatively so that the overall D-Aspartate- diphosphopentamolybdate conjugate charge was increased, which relatively have a large charge to mass ratio. As a result, the migration time of the peaks were decreased as the concentration of D-Aspartate was increased. The third peak did not show a recognizable change which may show that, Mo8 ion was not favorable at this buffer pH. Similar result was observed for the interaction of D-Glutamate with diphosphopentamolybdate as D-Glutamate is negatively charged and almost has the similar effect on the equilibrium and migration time of the compound.

Figure 7: An electropherogram of 5 mm phenyldiphosphopentamolybdate in 50 mm sodium acetate buffer at pH 5 containing D-aspartate
Both L-Leucine and L-Phenylalanine are neutral amino acids. As shown FIG. 8a, the first peak was increased with the increased concentration of L-Leucine whereas the second peak was decreased. This indicates that the equilibrium was shift from P2Mo5 to MO7 ion (Eq 2.1). The third peak was also decreased as the concentration of L-Leucine was increased indicating that the equilibrium was shift from Mo8 ion to P2Mo5 ion.

Figure 8: An electropherogram of 5 mm phenyldiphosphopentamolybdate in 50 mm sodium acetate buffer at pH 5 containing a) L-Leucine b) L-Phenylalanine
These two neutral amino acids did not show a remarkable change on the migration peak except the intensity of the peak.
Interaction of phenyldiphosphopentamolybdate with α- and β-CD
Cyclodextrins, CDs, are macrocyclic oligosugars most commonly composed of 6, 7, or 8 glucosidic units with the names α-, β- and γ- CD, respectively. Smaller molecules (called guests) can enter their cavity forming inclusion complexes with these hosts. Cyclodextrins are widely used in chemical, pharmaceutical, food, and other technologies as enzyme mimics, enantioselective catalysts, drug carriers, odor and taste-masking compounds and most importantly as chiral selectors in separation science [35]. Currently, CDs are effectively used as chiral selectors in all enantioseparations techniques. This is mainly due to the macrocyclic structure of CDs which is the major contributors to their ability to form intermolecular complexes and chiral recognition ability. In addition, the presence of free hydroxyl groups on the outer surface of CDs allows a variety of derivatives (ionic or nonionic, hydrophilic or lipophilic, etc.) to be synthesized, as well as for linkage of CDs to various surfaces. The other important property of CDs is their solubility in aqueous media, due to their hydroxyl groups, which is a key importance for their application as chiral selectors in CE. Their transparency in UV-Vis region is another advantageous property of CDs to be application in CE.
The intermolecular cavity of CDs contains water molecules that surrounded by a hydrophobic wall mainly composed of hydrogen atoms. As a result, these water molecules cannot fully form hydrogen bonds and are energetically less stable than bulk water molecules. When a guest molecule with a suitable size and preferably hydrophobic character, is added to a CD solution, the water molecules in the CD cavity are replaced by the guest molecule which induces a structural change in the CD. The size of the CDs is different depending on the number of glucosidic units they contain. TABLE 1 shows the size of α-CD and β-CD.
| Cyclodextrins | Mass | Outer diameter, (nm) |
Cavity diameter (nm) | Cavity volume, (mL/g) |
|
|---|---|---|---|---|---|
| Inner rim | Outer rim | ||||
| α-CD | 972 | 1.52 | 0.45 | 0.53 | 0.10 |
| β-CD | 1134 | 1.66 | 0.60 | 0.65 | 0.14 |
TABLE 1. Size and Mass of Α-CD and Β-CD
When CDs form a complex with a guest molecule that is so larger than the cavity space, a part of the molecule cannot be accommodated within the CD cavity. The cavity of α-CD is most suitable for the inclusion of a benzene ring with its long axis parallel to the molecular axis of α-CD [36]. Therefore, a guest molecule which is smaller than benzene can be fully included in the α-CD cavity whereas the larger guest cannot be included. It is Obvious that, Phenyl diphosphopentamolybdate is larger than benzene ring. So that Phenyl diphosphopentamolybdate was located outside the α-CD ring and coordinated by hydroxyl groups and/or water molecules. As observed from FIG. 9a, there was no significant change between the peaks recorded for phenyl diphosphopentamolybdate and its complex with α-CD. This indicates that Phenyl diphosphopentamolybdate did not included in the cavity of α-CD. On the other way, β-CD is wider than α-CD (TABLE 1), and can accommodate larger molecules, like naphthalene ring. Though β-CD is wider than α-CD, 2, 7- Dihydroxynaphthalene is the largest guest so far observed in crystals with the cage-type packing structure in β-CD [36]. As the host-guest interaction of CDs is highly dependent on the size and shape of the guest molecule, Phenyl diphosphopentamolybdate were not included in the cavity of β-CD due to its large size. As observed from FIG. 9b, there was a little change on the peak height of Phenyl diphosphopentamolybdate interacted with β-CD which indicates the high coordination between Phenyl diphosphopentamolybdate and hydroxyl groups and/or water molecules of β-CD.

Figure 9: An electropherogram of 5 mm phenyldiphosphopentamolybdate prepared in a 50 mm NaAc buffer (pH=5) containing, a) α-CD and b) β-CD
Conclusion
The dependence of Polyoxometalate equilibria on concentration, pH and counter ions was investigated. Accordingly, as the concentration of P2Mo5 increases, the equilibrium between P2Mo5 and Mo8 is favored and shifts from MO7 to Mo8. This means that, MO7 is stable at less concentration and Mo8 at higher concentration. This can be demonstrated from the electropherogram based on their electrophoretic mobility. The interaction of diphosphopentamolybdate with four counter-ions, Na+, NH4+, Li+,and K+ can also be depicted by electropherogram. The level of interaction can be used to study the properties of Polyoxomolybdate and their applications.
Compliance with Ethical Standards
Conflict of interest
The authors declare that they have no competing interests.
Ethical approval
This article does not contain any studies with human participants or animals performed by any of the authors.
Informed consent
Not applicable.
Acknowledgements
The authors would like to thank Northeast Normal University for funding this research.
References
- Song YF, Long DL, Cronin L. Hybrid polyoxometalate clusters with appended aromatic platforms. Cryst Eng Comm. 2010;12:109-15.
- Pradeep CP, Li FY, Lydon C, et al. Design and synthesis of “dumb?bell” and “triangular” inorganic–organic hybrid nanopolyoxometalate clusters and their characterisation through ESI?MS analyses. Chem-Eur J. 2011;17:7472-9.
- Bareyt S, Piligkos S, Hasenknopf B, et al. Highly efficient peptide bond formation to functionalized wells?Dawson?type polyoxotungstates. Angewandte Chemie International Edition. 2003;42:3404-6.
- Vila-Nadal L, Wilson EF, Miras HN, et al. Combined theoretical and mass spectrometry study of the formation-fragmentation of small polyoxomolybdates. Inorg Chem. 2011;50:7811-9.
- Hettiarachchi K, Ha Y, Tran T, et al. Application of HPLC and CZE to the analysis of polyoxometalates. J Pharmaceut Biomed. 1995;13:515-23.
- Tan H, Chen W, Liu D, et al. Diphosphonate-functionalized asymmetric polyoxomolybdates with catalytic activity for oxidation of benzyl alcohol to benzaldehyde. Dalton Transactions. 2011;40:8414-8.
- Jin HJ, Zhou BB, Yu Y, et al. Inorganic–organic hybrids constructed from heteropolymolybdate anions and copper–organic fragments: syntheses, structures and properties. Cryst Eng Comm. 2011;13:585-90.
- Vrdoljak V, Prugove?ki B, Matkovi?-?alogovi? D, et al. Hybrid organic–inorganic compounds based on the Lindqvist polyoxomolybdate and dioxomolybdenum (VI) complexes. Cryst Eng Comm. 2011;13:4382-90.
- Chen Q, Cui Y, Sun Q, et al. Hydrothermal synthesis, structure characterization, catalytic property of four inorganic?organic hybrid phosphomolybdates. Zeitschrift für anorganische und allgemeine Chemie. 2009;635:2302-8.
- Judd DA, Nettles JH, Nevins N, et al. Polyoxometalate HIV-1 protease inhibitors. A new mode of protease inhibition. J Am Chem Soc. 2001;123:886-97.
- Hill CL, Weeks JMS, Schinazi RF. Patent Ductus Arteriosus. PDA information. J. Med. Chem. 2990;33:10.
- Shigeta S, Mori S, Yamase T, et al. Anti-RNA virus activity of polyoxometalates. Biomedicine & Pharmacotherapy. 2006;60:211-9.
- Crans DC, Mahroof-Tahir M, Anderson OP, et al. X-ray structure of (NH4) 6 (Gly-Gly) 2V10O28. cntdot. 4H2O: Model studies for polyoxometalate-protein interactions. Inorg Chem. 1994 ;33:5586-90.
- Santos FM, Brandão P, Félix V, et al. Synthesis and structural characterization of Keggin polyoxometalate compounds with argininium (2+) cations. J Mol Struct. 2010; 963:267-73.
- Fukaya K, Srifa A, Isikawa E, et al. Synthesis and structural characterization of polyoxometalates incorporating with anilinium cations and facile preparation of hybrid film. J Mol Struct. 2010;979:221-6.
- Sadakane M, Dickman MH, Pope MT. Chiral Polyoxotungstates. 1. Stereoselective interaction of amino acids with enantiomers of [Ce(III)(α1-P2W17O61)(H2O)x]7-. The structure of dl-[Ce2(H2O)8(P2W17O61)2]14. Inorg Chem. 2001;40:2715-9.
- Li S, Wang E, Tian C, et al. In situ fabrication of amino acid-polyoxometalate nanoparticle functionalized ultrathin films and relevant electrochemical property study. Mater Res Bull. 2008;43:2880-6.
- An H, Wang E, Li Y, et al. A functionalized polyoxometalate by hexanuclear copper–amino acid coordination complexes. Inorg Chem Commun. 2007;10:299-302.
- Cartuyvels E, Görller-Walrand C, Parac-Vogt TN. Chemical studies of anti-tumor active polyoxomolybdate complexes. 2008.
- Hasenknopf B, Micoine K, Lacote E, et al. Chirality in polyoxometalate chemistry. Eur J Inorg Chem. 2008;2008:5001-13.
- Einstein A, Podolsky B, Rosen N. Can quantum-mechanical description of physical reality be considered complete?, Phys. Rev. 1935;47:777-780.
- Liu J, Peng J, Wang E, et al. A novel amino acid salt of 18-molybdodiphosphate: synthesis and structural characterization of (Lys) 2 H 6 [P2Mo18O62]· 16H2O. J Mol Struct. 2000;525:71-7.
- Rhule JT, Hill CL, Judd DA. Introduction: polyoxometalates multicomponent molecular vehicles to probe fundamental issues and practical problems. Chem. Rev.1998;98:327-57.
- Natarajan S, Ewald B, Prots Y, et al. Synthesis and crystal structure of [C10N2H10]2 [P2Mo5O21(OH)2]·2H2O. Zeitschrift für anorganische und allgemeine Chemie. 2004;630:678-82.
- Kortz U. Polyoxometalate−diphosphate complexes. 6.1 Possible intermediates in the molybdate-catalyzed hydrolysis of pyrophosphate: Structure of hexamolybdopyrophosphate [(O3POPO3) Mo6O18 (H2O)4]4. Inorg Chem. 2000;39:625-6.
- Fu RB, Wu XT, Hu SM, et al. Self?Assembly of organodiphosphonate, polyoxomolybdate and diphenanthrolinecobalt (II) into two clusters and one linear polymer. European Journal of Inorg Chem. 2003;2003:1798-801.
- Miras HN, Stone D, Long DL, et al. Exploring the structure and properties of transition metal templated {VM17(VO4) 2} Dawson-like capsules. Inorg Chem. 2011;50:8384-91.
- Miras HN, Wilson EF, Cronin L. Unravelling the complexities of inorganic and supramolecular self-assembly in solution with electrospray and cryospray mass spectrometry. Chem Commun. 2009;11:1297-311.
- Shuvaeva OV, Zhdanov AA, Romanova TE, et al. Hyphenated techniques in speciation analysis of polyoxometalates: identification of individual [PMo12−xVxO40]−3−x(x=1–3) in the reaction mixtures by high performance liquid chromatography and atomic emission spectrometry with inductively coupled plasma. Dalton T. 2017;46:3541-6.
- Timerbaev AR. Recent advances and trends in capillary electrophoresis of inorganic ions. Electrophoresis. 2002;23:3884-906.
- Himeno S, Kitazumi I. Capillary electrophoretic study on the formation and transformation of isopolyoxotungstates in aqueous and aqueous-CH3CN media. Inorganica Chimica Acta. 2003 ;355:81-6.
- Wachtel EV, Hendricks-Muñoz KD. Current management of the infant who presents with neonatal encephalopathy. Curr Prob Pediatr Ad. 2011;41:132-53.
- Kortz U, Vaissermann J, Thouvenot R, et al. Heteropolymolybdates of phosphate, phosphonate, and phosphite functionalized by glycine. Inorg Chem. 2003;42:1135-9.
- Kortz U, Savelieff MG, Ghali FY, et al. Heteropolymolybdates of AsIII, SbIII, BiIII, SeIV, and TeIV functionalized by amino acids. Angewandte Chemie International Edition. 2002;41:4070-3.
- Matsuura T, Aroon MA, Ismail AF. A comparison between β-cyclodextrin and chitosan as soft organic materials for surface modification of MWCNTs. J Nanosci Nanotechno. 2012;8:71-8.
- Dodziuk H. Cyclodextrins and their complexes: Chemistry, analytical methods, applications. John Wiley & Sons, NY, USA, 2006.