Original Article
, Volume: 12( 2)
Adsorption of Cu(II) and Cd(II) from Aqueous Solution by Using Rice Husk Adsorbent
Khalid M. El–Moselhy1, Magdi Abdel Azzem2, Adel Amer1 and Ahmed E. Al–Prol1*
1National Institute of Oceanography and Fisheries, Suez Branch, 182 Suez, Egypt
2Chemistry Department, Faculty of Science, El- Menoufia University, Egypt
- *Correspondence:
- Ahmed E. Al–Prol , National Institute of Oceanography and Fisheries, Suez Branch, 182 Suez, Egypt, E-mail: ah831992@gmail.com
Received: March 14, 2017; Accepted: May 16, 2017; Published: May 24, 2017
Citation: El–Moselhy KM, Abdel-Azzem M, Amer A, et al. Adsorption of Cu(II) and Cd(II) from Aqueous Solution by Using Rice Husk Adsorbent. Phys Chem Ind J. 2017;12(2):109.
Abstract
In this study, rice husk was used as a low cost adsorbent to remove copper and cadmium ions from wastewater by batch method. The effects of pH, initial adsorbent concentration, contact time, initial metal ion concentration and temperature were studied. The experimental data were agreement with the pseudo-second-order kinetic model; and analyzed by Langmuir and Freundlich isotherm models to investigate the adsorption of copper and cadmium ions on rice husk. The adsorption mechanisms of metal ions onto the rice husk were examined using: Scanning electron microscopy (SEM) and Fourier-transform infrared spectroscopy (FT-IR). As a conclusion, rice husk could be one of the low cost and effective adsorbent to be used in large amount operation of water treatment.
Keywords
Rice husk; Heavy metals; Adsorption; Kinetics; Isotherm
Introduction
The presence of toxic heavy metal ions in waste water is a major concern because their toxicity to many aquatic organisms. Heavy metal contamination exists in aqueous wastes of many industries, as metal plating, chloralkali, mining operations, radiator manufacturing, smelting, alloy industries and storage batteries industries, etc. [1]. For removal of metalloids and heavy metals, many conventional techniques such as carbon adsorption, membrane filtration, chemical precipitation ion exchange and co-precipitation have been studied. But they are not suitable for high concentration of metals and also not cost effective [2]. In recent years, the need for safe and economical techniques for removal of heavy metals from wastewaters has necessitated research interest towards the production of low cost alternatives [3]. Whatever, adsorption has been universally accepted because one of the most effective pollutant removal process, with low cost, ease in handling, low consumption of chemicals, and scope for treatment of value added components by regeneration of adsorbents and desorption [4]. Rice husk is agricultural waste arising in rice producing countries, particularly in Egypt. Dry rice husk contains 70% to 85% of organic matter (cellulose, lignin, sugars, etc.) and the remnant consists of silica, which is existing in the cellular membrane [5].
In modern years, attention has been focused on the exploitation of unmodified rice husk as an adsorbent for the removal of some pollutants [6]. Accordingly, the objective of this study was to valuation the possibility of rice husk as alternative low-cost adsorbents for decontamination of heavy metal ions from aqueous solutions. The adsorption studies were achieved as a function of solution pH values, adsorbent dosage, contact time, initial copper (II) and cadmium (II) concentrations and temperature. The equilibrium data were described by the Langmuir and Freundlich isotherm models in addition to determine adsorption kinetics. FTIR and SEM analyses were performed to clarify the adsorption mechanism.
Materials and Methods
Adsorbent preparation
Fresh rice husk was obtained from a local rice mill and the collected rice husk were washed with additional tap water and eventually with distilled water in order to remove dust and particulate substances from the surface, and dried in an oven at 70°C for 24 h. It grinding to powder by using a mixer and sieved to a uniform particle sizes to obtain even intra–particular diffusion of the metal ion.
Adsorbate
Stock solutions of Cd (NO3)2 and CuSO4 at concentration 1000 mg/L were prepared in deionized water. The desirable concentrations were prepared through the adequate dilution of stock solution with distilled water. The primary pH was adjusted by concentrated NaOH or HCl. Initial metal concentrations were measured using a flame atomic absorption spectroscopy (Perkin Elmer A Analyst 100).
Procedures
Effect of pH value: This part of the experiment was performed to verify the effect of pH effect, the parameters of temperature, solution volume, adsorbent amount, initial metal ion concentration, and shaking time were fixed at 30ºC 10 mL, 0.2 g, 10 mg/L, and 120 min, respectively. pH was tested for Cd (II) at pH 2, 3, 4, 5, 6, 7 and 8, While, for Cu(II) was at pH 3, 4, 5, 6, 7 and 8 and agitation speed was maintained at 130 rpm.
Effect of adsorbent amount: Different weights of adsorbent rice husk (0.1 g, 0.2 g, 0.3 g, 0.4 g and 0.5 g) were mingled and shaked with 10 mL of solution at 10 mg/L of Cu(II) and Cd (II) with 30ºC and pH 6 for 120 min to study the effect of biomass weight on sorption process.
Effect of contact time: The effect of time was investigated by agitating 0.2 g of adsorbent at pH 6, 30ºC in 10 mL, 10 mg/L of Cd(II) and Cu(II) solution over time periods of 10 min, 15 min, 30 min, 45 min, 60 min and 120 min at constant agitation speed of 130 rpm.
Effect of initial heavy metal concentration: Different Cu(II) and Cd(II) concentrations of 10 mg/L, 20 mg/L, 30 mg/L, 40 mg/L, 50 mg/L, 60 mg/L, 70 mg/L and 80 mg/L were examined at fixed parameters, 0.2 g of adsorbent with pH 6 added into 10 mL of solutions for 120 min in order to assess initial metal concentration.
Effect of temperature: Adsorption process achieved at various values of temperature (25°C, 30°C, 35°C, 40°C, 45°C and 50°C), at pH 6, 0.2 g adsorbent weight and 10 mL in volume of 10 mg/L for Cd(II) and Cu(II) at 120 min.
Isotherm studies: To assess, equilibrium process of different Cu(II) and Cd(II) varying from 10 mg/L to 70 mg/L were investigated at fixed parameters, pH 6 with 0.2 g of adsorbent, 30°C and 150 rpm for 6 h.
Calculation of copper and cadmium uptake
The removal uptake and adsorption capacity given by Yoonaiwong et al. [7] and analyzed as following Eq.1 and Eq. 2.
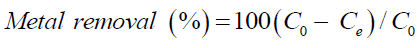 (1)
(1)
The capacity of adsorption (mg/g) for heavy metal ions can be analyzed based on the mass balance according as;
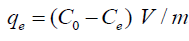 (2)
(2)
Where (C0) is the primary concentration of metal ions in the solution (mg/L), Ce is the equilibrium concentration of heavy metal ions in the solution (mg/L), (V) is the volume of solution (in liters) and (m) is the mass of adsorbent applied in grams.
Fourier Transform Infrared (FTIR) analysis of rice husk
FT-IR analysis was done to predict the functional groups on the walls of the adsorbent responsible for the adsorption process. FTIR spectra were showed for adsorbent solid samples before and after adsorption process for Cu(II). The spectra were recorded in Tensor - 27. Bruker transformed Infrared (FTIR). A sample of the adsorbent with the range 400 cm-1 to 4000 cm-1.
Scanning electron microscopy (SEM)
Scanning electron microscope (Model S 3400N, Hitachi, Japan) analysis was carried out for the dry rice husk particles and different sections in the samples were examined (before and after of Cu(II) adsorption) for determining the surface morphology.
Results and Discussion
Effect of pH
pH value has large effect in adsorption studies, because it influences the activity of functional groups in the adsorbents. Results of the effect of pH on adsorption of copper and cadmium ions are presented in Figure. 1. It was found that the total amount of adsorption of Cu(II) and Cd(II) onto rice husk increases with an increase of pH from 3 to 6 and reached a higher value at pH 6. At low pH (2- 3), more H3O+ ions will be available to compete with copper ions for the adsorption sites of the adsorbent, most of the functional groups are protonated [8]. As pH changes, surface charge also changes, and the sorption of charged species is affected (attract ion between the positively charged metal ion and the negatively charged rice husk surface). The solution pH was retained in the pH range of 2 – 6 due to the precipitation of metal ion was happened simultaneously at pH values higher than 6 [9].
Figure 1: Effect of pH values on Cu(II) and Cd(II) ions sorption.
Effect of adsorbent amount
Mass of adsorbents is one of the significant factors in adsorption processes due to it determines the uptake of an adsorbent Figure. 2, displays that the adsorption of metals increases gradually with an increase in the amount of rice husk because the greater availability of metal binding sites of the surface area at higher amount of the adsorbent [10]. Adsorption decreases at higher concentrations of adsorbent (0.5 g), because at high adsorbent amounts cause cell agglomeration and a consequent reduction in intercellular distance between dense layer of cells, leading to the ‘shield’ of binding sites from metal ions [11]. A relationship could also be given between a adsorbent amount and metal removal due to the availability of metal ion may be limited with increased interference, electrostatic interactions between binding sites, and reduced mixing at higher adsorbent dose.
Figure 2: Effect of adsorbent amounts on percentage uptake of Cu(II) and Cd(II) ions sorption.
Effect of contact time
The effect of sorption time on sorption efficiency has been showed in Figure. 3. The plot reveals that the percent of Cu(II) and Cd(II) removal were about 33.84% of Cu(II) and 30% of Cd(II) within the first 10 min this is probably owing to a larger surface area of the rice husk being available at the beginning for the adsorption of heavy metal ions. The increasing contact time increased the copper and cadmium adsorption and it remained constant after equilibrium was reached in 120 min, as the binding sites became exhausted, the uptake rate slowed due to competition for decreasing availability of actives sites by metal ions.
Figure 3: Effect of contact time on percentage uptake of upper and cadmium ions sorption
Effect of initial concentration
The effect of initial copper and cadmium ions concentration on adsorption was examined and is shown in Figure. 4. It is obvious from this figure that the percentage removal of Cu(II) and Cd (II) ions reduced with the increase in initial concentration of Cu(II) and Cd(II) ions. The percentage removal minimizes from 97.48 to 81.33% for Cu(II) ions; while, in Cd(II) ions 97.58 to 80.02% at the same condition.
Figure 4: Effect of initial metal ion concentration on percentage uptake of copper and cadmium ions sorption.
A significant dose of metal ions adsorbed at high initial metal concentration can be related to two factors, namely high probability of collision amongst metal ions with the adsorbent surface and high rate of metal ions diffusion onto adsorbents surface [12]. As discussed by Wang et al. [13], high initial metal concentration accelerates the driving force and decrease the mass transfer resistance of copper and cadmium ions between the aqueous phase and the solid phase.
Effect of temperature
Figure. 5, showed the change of percentage removal with temperature of solution. It can be concluded that the higher percentage removal of metals has been obtained at 30°C and reduced with the rise in temperature from 30°C to 50°C. With raise in temperature above 20°C to 30°C, this is mainly due to the decreased surface activity, and increasing temperature is known to increase the diffusion rate of adsorbate molecules within pores and will also, modify the equilibrium capacity of the adsorbent for a particular adsorbate [14].
Figure 5: Effect of temperature on percentage uptake of copper and cadmium ions sorption.
Adsorption isotherm models
The study of adsorption isotherms is fundamental in supplying the essential information desired for the design of the sorption process. In this investigation Langmuir and Freundlich isotherm models were used to analyze the equilibrium data.
Langmuir isotherm model: Langmuir adsorption isotherm [15] applied to equilibrium adsorption assuming a monolayer adsorption onto the surface of the adsorbent with a finite number of identical sites. The isotherm is presented by the following equation:
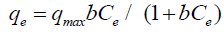 (3)
(3)
where qe (mg/g) is the observed adsorption uptake at equilibrium, qmax (mg/g) is the maximum adsorption uptake corresponding to the saturation capacity (representing total binding sites of biomass), Ce (mg/L) is the equilibrium concentration and b (L/mg) is a coefficient related to the affinity between the sorbent and sorbate (b is the energy of adsorption). The linear relationship can be obtained by plotting (1/qe) vs. (1/Ce):
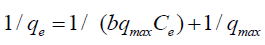 (4)
(4)
In which b and qmax are determined from slope and intercept, respectively. The different adsorbents can be compared by it’s respectively qmax values which are calculated from fitting the Langmuir isotherm model to actual experimental data. The essential features of the Langmuir isotherm probably expressed in terms of equilibrium parameter RL, which is a dimensionless steady referred to as separation factor or equilibrium parameter [16].
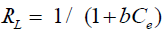 (5)
(5)
Where: Ce is the initial concentration b is the fixed related to the energy of adsorption (Langmuir Constant). RL value shows the adsorption nature to be either unfavorable if RL>1), linear if RL =1, favorable if 0<RL<1 and irreversible if RL=0. From the data calculated in Table 1, the RL is more than 0 but less than 1 indicating that Langmuir isotherm is favorable. The displayed results demonstrate that the Langmuir isotherm models able to fit the sorption of Cu(II) and Cd(II) by rice husk with the linear regression coefficient "R2" of 0.95 and 0.98, respectively. And the maximum monolayer coverage capacity (qmax) from Langmuir Isotherm model was determined to be 133.34 mg/g for Cu(II) ions while, for Cd(II) ions 41.15 mg/g. The Langmuir constant (b) which is related to the heat of adsorption was found to be 0.07 and 2.56 for uptake of Cu(II) ions and Cd(II) ions, respectively as shown in Figure 6, and Table 1, RL (the separation factor) is 0.81 and 0.28 for Cu(II) and Cd(II) ions respectively, indicating that the equilibrium sorption was favorable.
Figure 6: Langmuir isotherms plot for the sorption of Cu(II) and Cd(II).
| Metal ions |
Langmuir Isotherm |
Freundlich Isotherm |
| R2 |
qmax(mg/g) |
B
(L/mg) |
RL |
R2 |
n |
Kf
(mg/g) |
| Cu(II) |
0.948 |
133.34 |
0.07 |
0.81 |
0.96 |
1.04 |
8.489 |
| Cd(II) |
0.978 |
41.15 |
2.56 |
0.28 |
0.956 |
2.78 |
22.13 |
Table 1: Parameters for plotting Langmuir and Freundlichadsdorption isotherms.
Freundlich adsorption isotherm: The Freundlich isotherm suppose a heterogeneous surface with non-uniform distribution of adsorption heat over the surface (binding sites are not equivalent) and a multilayer adsorption [17]. The monocomponent Freundlich isotherm equation is given by:
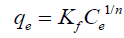 (6)
(6)
Where Kf is the Freundlich isotherm fixed related to the sorption capacity and n is the steady related to affinity of metal ions on adsorbent. The Freundlich model can be easily linearized by plotting it in a logarithmic form:
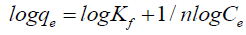 (7)
(7)
By plotting log qe vs. log Ce, the constant n and Kf can be determined from the slope and intercept, respectively. The linearized Freundlich isotherms acquired for copper and cadmium, are presented in Figure. 7, and Table 1. The experimental data obeyed the Freundlich model, as confirmed by the high determination linear regression coefficient (R2 more than 0.96). The ‘n’ value of Freundlich equation could give an indication on the favorability of sorption and the n values were found to be more than unity for adsorbent of both Cu(II) and Cd(II). According to Kadirvelu and Namasivayam [18], n values among 1 and 10 represent beneficial adsorption.
Figure 7: Freundlich isotherms plot for the sorption of Cu(II) and Cd(II).
Adsorption kinetics
In the kinetic models, it is normally assumed that the overall rate of adsorption is exclusively controlled by the adsorption rate of the solute on the surface of the adsorbent. The adsorption kinetics is modeled with the pseudo-first-order and pseudosecond- order kinetics.
The pseudo-first order is given by the follower’s equation Ho et al. [19].
 (8)
(8)
Where qe and qt (mg. g−1) are the adsorption capacity at equilibrium and time t, respectively. K1 (min−1) is the rate constant of pseudo-first-order adsorption. When values of log (qe - qt) are linearly correlated with t, we have a good fit for the pseudofirst- order reaction. Values of k1 and qe are determined from the slope and intercept of the kinetic model, respectively. On the other hand, the pseudo-second order is given by follower’s formula.
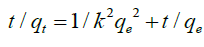 (9)
(9)
Where k2(g. mg−1 min−1) is the pseudo-second-order rate constant of sorption. Plots of t/qt against t should give a linear relationship from which the values of qe and k2 can be determined from the slope and intercept, respectively. Conformity between the experimental data and model-predicted values was expressed by the coefficient of determination (R2 values close or equal to 1). The experimental results of the heavy metals uptake, qt, versus time were fitted to the above-mentioned models by the method of nonlinear regression. The results are shown in Tables 2 and 3 and Figure. 8 and 9. It was concluded, that pseudo- first-order kinetic models were ruled out because their correlation coefficients (R2) for the present experimental data were too small (less than 0.38) for both Cu(II) and Cd(II) ions. Experimental data were closely aligned with the second-order equation because the determination coefficient was more than 0.98. The second-order rate parameter qe indicated that this model was successful in estimating qe because the experimental values of qe agree with the qe (calculated).
Figure 8: Pseudo-first order plot for the sorption of Cu(II) and Cd(II) ions.
Figure 9: Pseudo-second order plot for the sorption of Cu(II) and Cd(II) ions.
| Metal ions |
Pseudo-first-order rate equation |
| R2 |
qe(mg/g) |
kad(min-1) |
qe_exp.(mg/g) |
| Cu(II) |
0.384 |
0.552 |
-0.0154 |
0.873 |
| Cd(II) |
0.021 |
0.295 |
-3.224×10⁻³ |
0.846 |
Table 2: Comparison between the adsorption rate constants with Pseudo-first-order.
| Metal ions |
Pseudo-second-order rate equations |
| R2 |
qe, cal.(mg/g) |
K (g mg-1min-1) |
qe _ exp.(mg/g) |
| Cu(II) |
0.989 |
0.993 |
0.0461 |
0.878 |
| Cd(II) |
0.987 |
0.959 |
0.0436 |
0.846 |
Table 3: Comparison between the adsorption rate constants with Pseudo-second-order rate equations.
FTIR Spectrum
FTIR analysis was investigated in order to identify the different functional groups present in rice husk Figure. 10 and 11, which were responsible for adsorption process. By comparing the FTIR spectra of rice husk before and after adsorption, there were remarkable shifts in some bands Table 4. These bands are the function groups of rice husk participate in Cu(II) adsorption.
Figure 10: IR spectrum before adsorption of Copper ions.
Figure 11: IR spectrum after adsorption of Copper ions.
Scanning electron microscopy (SEM)
The morphology of rice husk surface was analyzed by scanning electron microscopy before and after metals loading Figure. 12a and 12b. The cells before exposure were fine, well-shaped and had certain dimensions. After exposure to metals the SEM analysis is clearly indicated the presence of lot of irregular surface, swollen, highly porous structure of the RH sample studied and their surface becomes meanders after exposure to metals ions solution. This may be because changes in surface morphology are usually related to disruption of the cross-linking between the metal ions and negatively charged chemical groups, as carboxyl groups, in the cell wall [20-25], and evidence the increase surface adsorption of metals.
Figure 12: SEM micrograph (12000) of rice husk cell wall (a-left) before and (b- right) after copper ions adsorption.
Conclusion
The adsorption of Cu(II) and Cd(II) ions by rice husk were investigated and found to be dependent on the pH solution, initial concentration, contact time and temperature. The maximum removal of Cu(II) and Cd(II) ions were attained at pH 6 at 30°C, using heavy metals concentration of 10 mg/L. The adsorption isotherm data could be well fitted by both Langmuir equation and Freundlich equation. The adsorption kinetic was described well by the pseudo-second-order model. Data of the IR spectrum confirmed the presence of some functional groups in the biomass of rice husk. The relatively low cost and high capabilities of the rice husk make it potentially attractive adsorbent for the elimination of copper and cadmium from wastewater.
References
- Ashraf G. Heterologous expression of stress-responsive DUF538 domain containing protein and its morpho-biochemical consequences. Plant J. 2011;30(5):351-8.
- Takahashi S, Yoshikawa M, Kamada A, et al. The photoconvertible water-soluble chlorophyll-binding protein of Chenopodium album is a member of DUF538, a superfamily that distributes in Embryophyta. J Plant Physiol. 2013;170(17):1549-52.
- Ashraf G, Kohnehrouz SB.Identification ofDUF538cDNA clone from Celosia cristata expressed sequences of nonstressed and stressed leaves. RussJPlant Physiol. 2010;57(2):247-52.
- Nakagami H, Sugiyama N, Mochida K, et al. Large-scale comparative phosphoproteomics identifies conserved phosphorylation sites in plants. Plant Physiol. 2010;153(3):1161-74.
- Ashraf G, Kohnehrouz SB. ProtJ.2013;32:163.
- Ashraf G.Prediction of tertiary structure homology between bactericidal/permeability increasing protein of innate immune system and hydrolase enzymes. IntJBiosci. 2014;5(2):1-6.
- Ausubel FM, Brent R, Kingston RE, Moore DD, Seiolman JG, Smith JA, et al. Current Protocols in Molecular Biology. New York: John Wiley & Sons; 1991.
- Livak KJ, Schmittgen TD. Analysis of relative gene expression data using real-time quantitative PCR and the 2−ΔΔCT method. Methods. 2001;25(4):402-8.
- Rabbani MA, Maruyama M, Abe H, et al. Monitoring expression profiles of rice genes under cold, drought, and high-salinity stresses and abscisic acid application using cDNA microarray and RNA gel-blot analyses. Plant physiol. 2003;133(4):1755-67.
- Shinozaki K, Yamaguchi SK, Seki M, et al. Regulatory network of gene expression in the drought and cold stress responses.CurrOpinPlant Biol. 2003;6(5):410-7.
- Shinozaki K, Yamaguchi SK. Gene networks involved in drought stress response and tolerance. JExpBot. 2007;58(2):221-7.
- Yamaguchi SK, Shinozaki K. Organization of cis-acting regulatory elements in osmotic- and cold-stress-responsive promoters. Trends Plant Sci. 2005;10(2):88-94.
- Bartels D, Sunkars R. Drought and Salt Tolerance in Plants. CritRevPlant Sci. 2005;24(1):23-58.
- Seki M, Narusaka M, Abe H, et al. Monitoring the expression pattern of 1300 Arabidopsis genes under drought and cold stresses by using a full-length cDNA microarray. Plant Cell. 2001;13(1):61-72.
- Schimid M, Davison TS, Hens SR, et al. A gene expression map of Arabidopsis thaliana development. NatGenet. 2005;37(5):501-6.