Original Article
, Volume: 13( 4)Risk Assessment of Environmental Pollution of Lead and Zinc in Ishiagu and Uburu Communities of Ebonyi State
- *Correspondence:
- Oje OA, Department of Chemistry/Biochemistry/Molecular Biology, Faculty of Science and Technology, Federal University Ndufu Alike Ikwo (FUNAI), Ebonyi State, Nigeria, Tel: +234–803–643–1336; E-mail: obinna.oje@funai.edu.ng
Received: July 06, 2017; Accepted: July 26, 2017; Published: July 30, 2017
Citation: Oje OA, Ubani CS, Ekwueme FN, et al. Risk Assessment of Environmental Pollution of Lead and Zinc in Ishiagu and Uburu Communities of Ebonyi State. Environ Sci Ind J. 2017;13(4):143.
Abstract
This investigation was aimed at assessing the risk involved in eaten vegetable obtained from mining or quarrying locations. Ten (10) – Edible vegetable samples were collected from different farms and also soil and water samples from Ishiagu and Uburu communities were assessed for lead and zinc concentrations. The bioaccumulation factor (BAF), transfer factor (TF) and the health risk index were calculated as index of environmental risk. The results showed higher levels of lead and zinc in the vegetables sampled when compared with the permissible limits of the lead and zinc. Most vegetables investigated showed high BAF and TF values which varied from one vegetable to the other. This variation might be due to the differences in metal concentration in water and soil, rate of transpiration in plant, nature or chemical form of the metal and age of plants. The health risk index for both metal in both communities were found to be less than 1 which shows that the environment could be considered safe. Although the study revealed no health risk associated with the consumption of vegetables from these environment, caution should be applied in the consumption of the vegetables due to long time bioaccumulation of the metals.
Keywords
LULC; Food security; Land transformation; Urban sprawl; Biodiversity.
Introduction
Heavy metal pollution is one of the major problem facing the environmentalist today. The effect heavy metal toxicity on humans cannot be over-emphasized as they are known to affect most vital organs in the body. Heavy metals are some of the component that contribute to the contamination of the environment (air, water, soil, plants etc.) [1]. These heavy metals for example lead and zinc have been known to cause some health problems ranging from hematological to neurological problems [2]. Lead can be hazardous to the body in trace quantity because it can affect virtually all the organ in the body. It induces both microcytic and hypochromic anemia [3]. According to Zenz [4], the anemia could be due to several factors, which includes (a) inhibition (restriction) of normal heme synthesis [5], (b) interference with the synthesis of globin, (c) interference with the incorporation of iron into erythrocyte precursors and (d) shortened erythrocyte life span by lead [6]. Zinc is an abundant element and constitutes approximately 0.004 percent of the Earth’s substance [7]. Zinc is also an essential element for all living things, including man. Zinc-containing proteins and enzymes are involved in every aspect of metabolism, including the replication and translation of genetic material [8]. Nearly 200 zinc-containing enzymes have been identified from all species [9], which include; carbonic anhydrase, aspartase, and transcarbamylase and alcohol dehydrogenase. At higher concentrations, zinc can be toxic thereby, leading to reduced cell-division rates, uncoupling of cell division and photosynthesis [10,11].
High concentrations of zinc also produced symptoms of zinc toxicosis in animals [12] which may manifest with the following symptoms; depressed rate of weight gain and feed intake, arthritis, extensive hemorrhage in the axillary spaces, gastritis, catarrhal enteritis, congestion of the mesentery, and hemorrhages [13]. Lead and zinc accumulation in soils and plants is of increasing concern because of the potential human health risks associated with it. Heavy metals are not biodegradable but are transferable, at some levels they become toxic and tend to accumulate along the food chain, where man is the last link [14,15]. There are many sources of heavy metal exposure to humans. Plants have the ability to absorb nutrients and micro-nutrients from the soil through their roots and transport them to other parts of the plants [16,17]. Through these processes, heavy metals can also be absorbed from the soil and water environment into the plant. The increase in metal uptake by food crops grown on contaminated soils affects the food quality and safety of consuming such crop [18].
The rate by which these heavy metals enter plants could be assessed by calculating the transfer factor (TF) and the bioaccumulation factor (BAF). The efficiency of different plants in absorbing metals is evaluated by either plant uptake or soil-to-plant transfer factors of the metals [19]. The transfer factor tends to evaluate the ratio of the metal concentration on plants to its concentration in soil while bioaccumulation factor tends to evaluate the ratio of the metal concentration in plants to its concentration in water. Some of the factors that could affect the TF and BAF include: the chemical form of the metals, age of plants, soil texture and so on [20,21]. Vegetables are important part of human's diet, they are also source of important nutrient and functional food components (by contributing protein, vitamins, and minerals) which have marked health effects [22]. Vegetables grown in heavy metal contaminated soils accumulate higher amount of metals than those grown in uncontaminated soils [23]. In health risks assessment, it is necessary to identify the potential sources of risk - agents in the environment and estimate the amount of risk - agents that is in contact with the human environment. The determination of the health consequence of exposure is also very necessary [24]. Concerning hazardous chemicals, the Organization for Economic Co-operation and Development (OECD), European Union (EU) and US Environmental Protection Agency (EPA), had outlined procedures and regulations for risk assessment [25-27]. According to the National Research Council [28], there are four steps in risk analysis: 1. hazard identification, 2. exposure assessment, 3. dose-response assessment and 4. risk characterization.
However, studies on the metal uptake, accumulation and assessment of human health risks associated with mining and quarrying environments are still needed. Therefore, this study is aimed at accessing the pollution level using the transfer and bioaccumulation factors as indexes of pollution and the health risk index associated with the intake or consumption of vegetable in Ishiagu community of Ebonyi state where mining and quarrying are presently going and Uburu is contagious town in Ebonyi State, Nigeria, that has significant quantity of deposits of lead but mining was suspended for over 30 years.
Experimental Section
Sample locations
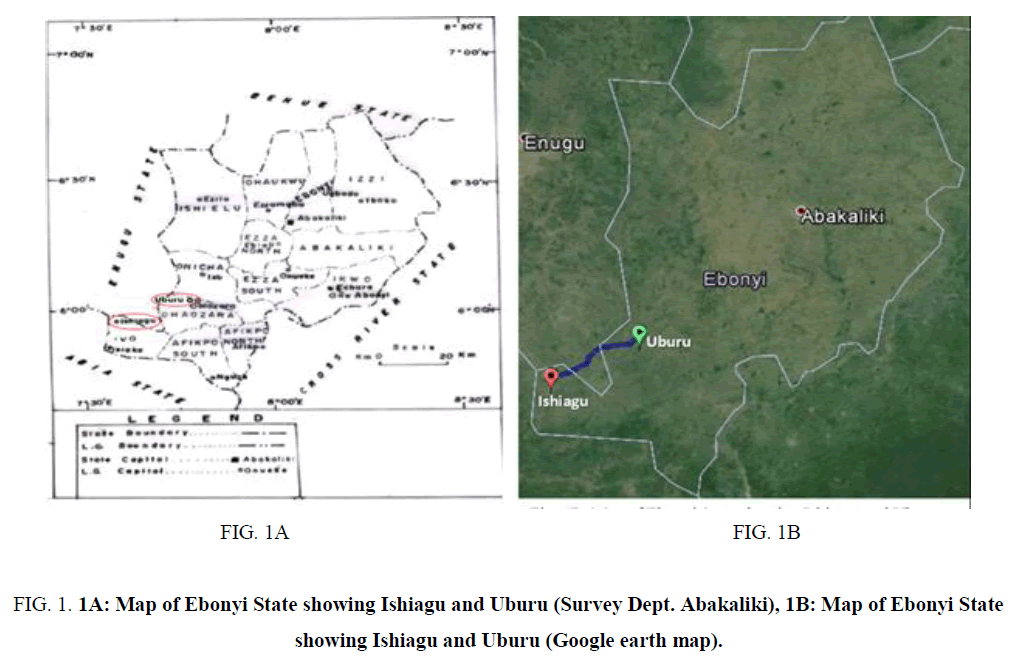
Two towns were used as location of the study. Ishiagu a lead mining town in Ivo Local Government Area in Ebonyi State, Nigeria, located on the plains of the south-eastern savannah belt. It is located on latitude 5°57’N and longitude 7°34'E. and Uburu, a non-mining /quarrying town in Ohaozara Local Government Area in Ebonyi state still on the plains of the south - eastern savannah belt. It is located on the latitude 6°2' N and longitude 7°46' E. The distance between the two communities was about 23.98 Km apart (Figure 1).
Figure 1: 1A: Map of Ebonyi State showing Ishiagu and Uburu (Survey Dept. Abakaliki), 1B: Map of Ebonyi State showing Ishiagu and Uburu (Google earth map).
Plant materials
The plant materials used in this study where obtained from farm lands about 500 m away from the mining sites. Matured plant materials that have grown to maturity was used for this study. 10 edible vegetables were collected for the study which include; Telfairia occidentalis, Amarantus spp, Hydrophyllum capitatum, Abelmoschus esculentus, Oryza sativa, Zea mays, Dioscorea Bulbifera, Dioscorea alata, Manihot esculenta, and Colocasia esculenta. (only the edible parts of the plants were used for the analysis). The samples were harvested and put in a polyethene bag and taken to laboratory where they were store in the refrigerator at a temperature of 4°C till the time of heavy metal analysis.
Soil samples
The soil samples used in this study where obtained from three (3) different farm lands where the plants where collected. Top soils (10 cm - 20 cm depth) were collected using an auger and put in a polyethene bag and in the same condition as the plant materials. The soil samples were ground in a mortar and air-dried. It was also sieved with a 2-mm sieve to achieve uniformity of soil particles and also to remove some other materials (such as plant debris and roots) that might affect the result.
Water samples
The water samples were obtained from water bodies around the farm lands (stream and dug-well water) the where about 100 m - 200 m away from the site. The water sample were acidified with few drops of tetraoxosulphate (vi) acid before taken them to the laboratory in sample bottles that was previously washed and rinsed with dilute tetraoxosulphate vi acid and dried.
Preparation of edible plant parts for lead and zinc AAS analysis
The preparation of lead and zinc for AAS analysis was done by the method of Adrian, [29], as outlined below; The sample (plant and soil) samples were washed with distilled water and air dried, after which they were dried in the oven and grinded into powder (Note: soil samples were not washed). 1 g of the sample was weighed into a beaker. 10 cm3 of 1:1 dilution of concentrated HNO3 and distilled water was mixed and then covered with a watch glass. The solution was placed on a hot plate to reflux for 10 to 15 min without boiling (one hour for soil samples). The beaker was allowed to cool and then 2 cm3 of distilled water and 3 cm3 of 30% H2O2 were added, covered with watch glass and placed over a hot plate. After the effervescence had subsided, the solution was removed and cooled. HCl (5 cm3) and 10 cm3 of distilled water were added and then heated for another 15 min without boiling. The solution was then transferred to 100 cm3 beaker and made up to mark using deionized water and taken for AAS analysis for lead and zinc.
Calculation of concentrations of lead and zinc.
The concentrations of lead and zinc determined are on a wet weight basis in μg/g thus;
 Eq. (1)
Instrumentation and optimal condition
Perken - Elmer flame atomic absorption spectrometer, FAAS, (model 2380) equipped with burner- nebulizer for airacetylene having single slot 100 mm was used for carrying out the analysis Table 1.
| Element | Wavelength | Slit band width (mm) |
|---|---|---|
| Lead (Pb) | 283.3 | 0.7 |
| Zinc (Zn) | 213.9 | 0.7 |
Table 1: Shows the wavelength and slit band width of the AAS machine.
Determination of the bioaccumulation factor of lead and Zinc
Bioaccumulation of metals in different samples can be quantified by a bioaccumulation factor (BAF), which is the ratio of a particular metal concentration in the plants to the concentration of that metal in water [30].
 Eq. (2)
Determination of the transfer factor of lead and zinc
The transfer factors of lead and zinc were determined as described by Lokeshwari and Chandrappa [31]. Thus
 Eq. (3)
Risk assessments
Determination of the absorbed lead and zinc amount: According to Hart et al. [32], the pattern of consumption of African leafy vegetables in rural areas shows the average consumption of vegetable to be 61.5 g day-1.
The average concentrations of lead and zinc in vegetable in Ishiagu can be calculated as thus:
 Eq. (4)
OR
 Eq. (5)
Where Cp1 = concentration of metal in plant 1
Cp2 = concentration of metal in plant 2
Cp3 = concentration of metal in plant 3
Cpn = concentration of metal in plant n
n = number of plants used
Note: this method of calculation does not show the contribution of each vegetable but the interest here is on the average concentration of lead and zinc that might be consumed through the consumption of these vegetables.
The amounts of lead or zinc consumed per day through the consumption of vegetables can be calculated thus:
Amount of lead consumed = Average Conc of heavy metals in edible part of the plant Average mass of edible part of the vegetable consumed Equ (6)
About 90% of consumed lead is excreted and only about 10% is absorbed into the blood [33] therefore, the amount of lead absorbed into the blood could be calculated. And knowing that 99% of the total lead burden in the blood is found hemoglobin and 1% in the plasma [33], the theoretical concentration of lead in plasma and hemoglobin could also be calculated.
Daily Intake of Metals (DIM): This is determined by the following equation:
 Eq. (7)
Where:
Cmetal = Mean heavy metals conc. in plants (mg kg-1) metal
Cfactor = Conversion factor
Dfood intake = Daily food intake of vegetables
The conversion factor of 0.085 is to convert fresh vegetable weight to dry weight [19].
Health Risk Index (HRI): By using Daily Intake of Metals (DIM) and reference oral dose we obtain the health risk index. The following formula is used for the calculation of HRI:
 Eq. (8)
RfD is the food reference dose for the metal (mgd-1)
If the value of HRI is less than 1 then the exposed population is said to be safe [34].
Statistical analysis
The results were statistically analyzed and presented as mean ± standard deviation. The t-test statistics was used to compare the difference in mean and the level of significance at p < 0.05.
Results and Discussion
The bioaccumulation and transfer factor of lead and zinc were determined in some major edible vegetable in both Ishiagu and Uburu communities in Ebonyi state Nigeria. The bioaccumulation and transfer factor were observed to differ from one plants to another due to the differences in the elemental selectivity, nature of elements and accumulation from soil solutions. Other factors include the rate of transpiration, nature and type of soil and the age of the vegetable. Bioaccumulation and transfer factors could be affected by the localization of these metals in the soil environment. These factors contribute to difference in values of the same plants collected from different sites.
The concentrations of lead and zinc in leafy vegetables
The result in Table 2 shows the concentration of lead and zinc in soil and in water from Ishiagu and Uburu. It shows that the concentration of lead was higher in the soil collected from the agricultural soil in Uburu while the zinc concentration in soil was found to be higher in the soil sample collected from Ishiagu. The result also showed that lead and zinc concentrations were higher in water sample from Ishiagu when compared with that from Uburu.
| Town | Metal Concentration in Soil (μg/g) | Metal Concentration in Water (μg/g) | ||
| Lead | Zinc | Lead | Zinc | |
| Ishiagu | 14.20 ± 2.32 | 256.83 ± 23.32 | 0.019 ± 0.006 | 0.250 ± 0.07 |
| Uburu | 14.48 ± 1.98 | 170.66 ± 15.32 | 0.006 ± 0.001 | 0.127 ± 0.04 |
Table 2. The metal concentration in soil and water in both communities.
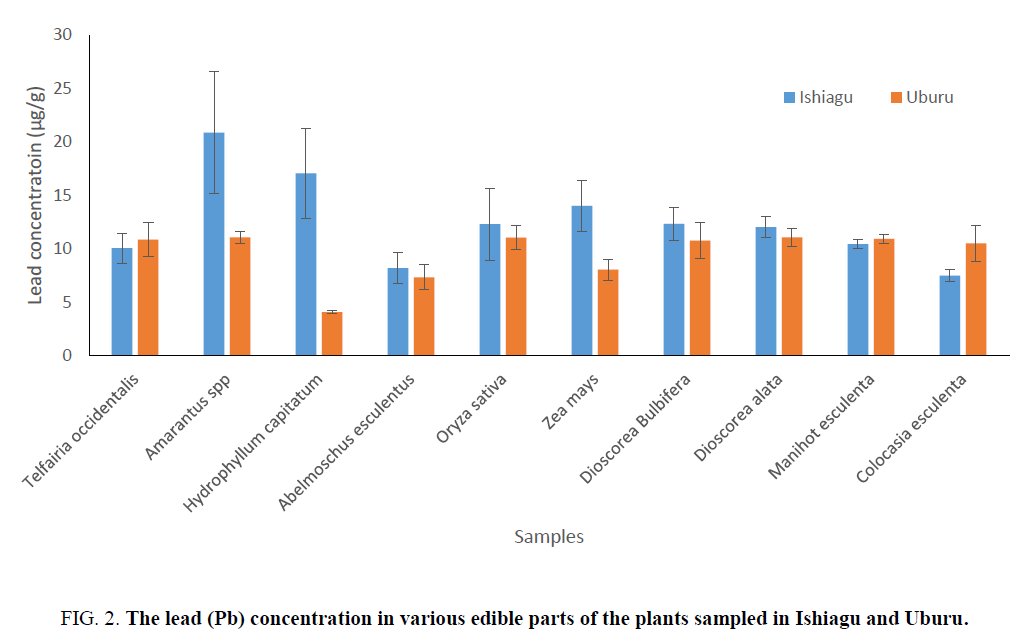
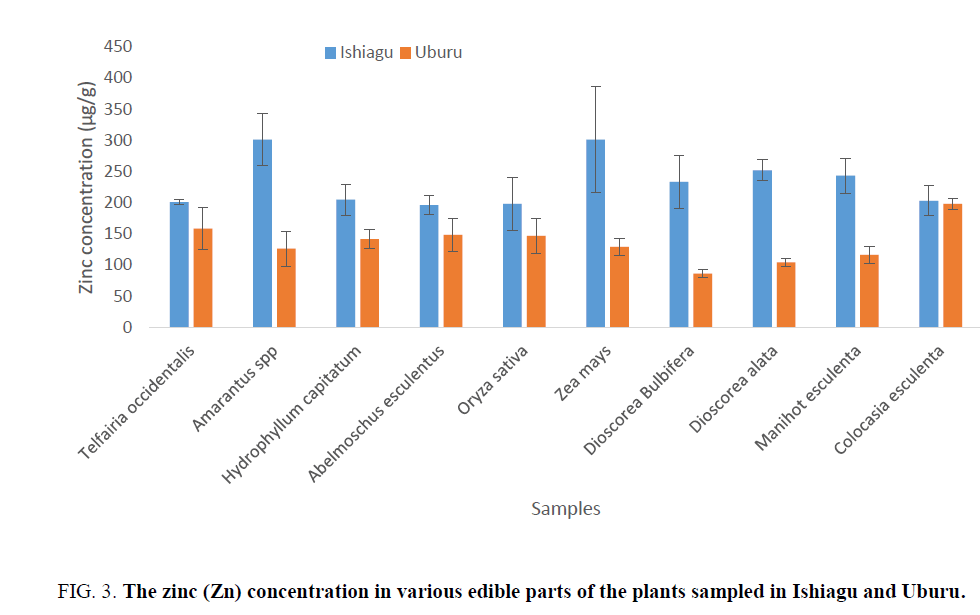
The determination of lead and zinc concentrations in edible plant parts show that the concentrations of lead and zinc in Amarantus spp and Hydrophyllum capitatum from Ishiagu gave higher amount (Figure 2). The concentration of lead in H. capitatum in Uburu was found to be low. However, apart from H. capitatum, Abelmoschus esculentus, and Zea mays, the concentration of lead in the other plant samples were approximately equal. The variation in the levels of lead and zinc could be as a result of increase in the rate of transpiration which is a function of the plant’s leaves surface area or it might be as a result of localization of these metals in the soil [35], which might be as a result of the anthropogenic activities in the area (Figure 3).
Figure 2: The lead (Pb) concentration in various edible parts of the plants sampled in Ishiagu and Uburu.
Figure 3: The zinc (Zn) concentration in various edible parts of the plants sampled in Ishiagu and Uburu.
Lead and Zinc transfer factors of different food stuffs
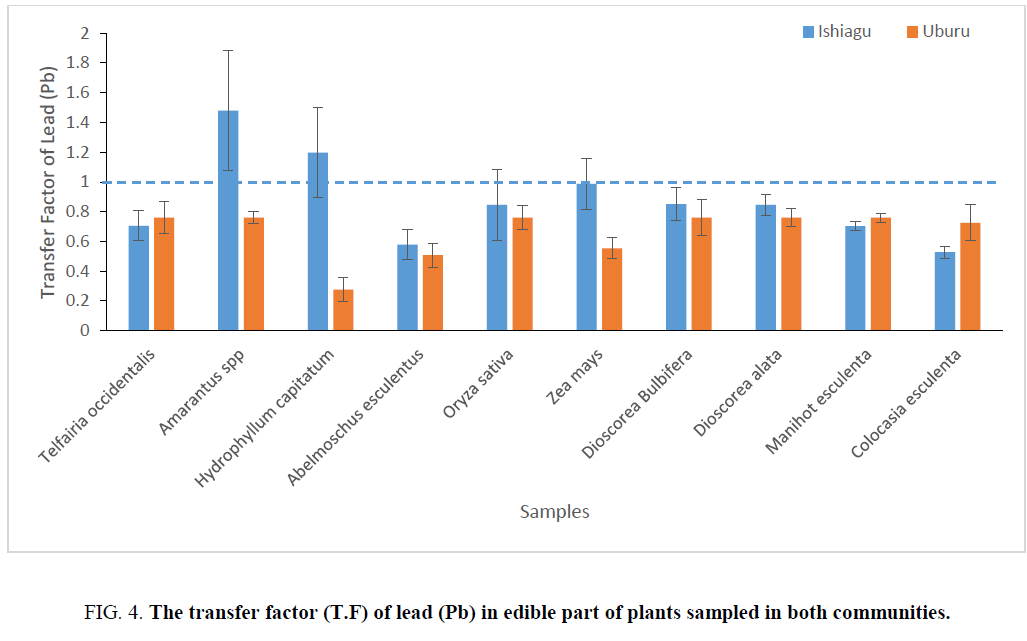
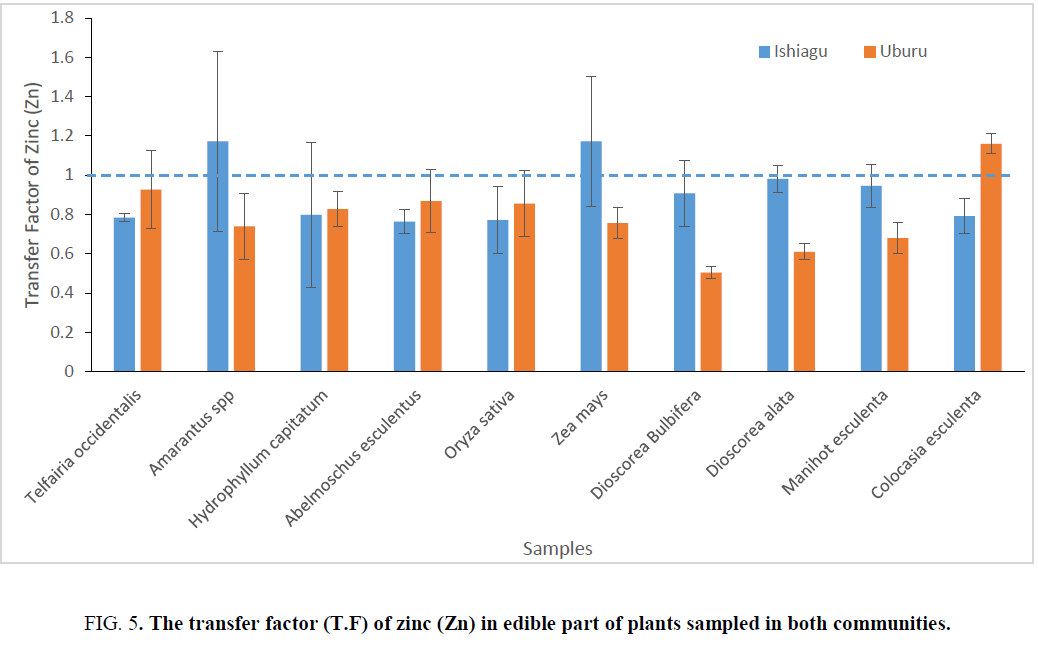
Amarantus spp exhibited highest transfer factor of 1.479 ± 0.40 and 1.172 ± 0.46 for lead and zinc respectively in Ishiagucommunity. Due to the closeness in the concentration of lead in all the sampled plants in Uburu with the exception of H. capitatum, A. esculentus, and Z. mays, the transfer value in the other plants were almost the same.
The transfer factor (T.F) of lead and zinc in different plants part in Ishiagu, indicates the level of transfer of different heavy metals from soil to vegetable which is one of the key component of human exposure to metals in food chain [31]. The highest transfer factor for lead obtain was obtained for Amarantus spp in Ishiagu. All the vegetables sampled with the exception of Amarantus spp and H. capitatum gave a T.F>1 for lead in Ishiagu, while Amarantus spp and Z. mays gave the highest T.F forzinc in Ishiagu. With the exception of these two vegetables, all the other plants sampled had a T.F that is less than 1 for zinc in Ishiagu. In Uburu, Colocasia esculenta and H. capitatum showed the highest T.F for zinc with their values greater than 1.
All the vegetable sampled for T. F of lead showed a T. F less than 1 with H. capitatum having the least value as can be seen in Figure 4 and 5. The differences in T. Fs values indicated that each metal has different phytotoxic effect on different vegetable. Baker [36] and Zu et al. [37] reported that T. Fs higher than 1.0 were determined in metal accumulator species whereas T.F was typically lower than 1.0 in metal excluder species. T.F higher than 1.0 indicates an efficient ability to transport metal from root to leaf, most likely due to efficient metal transporter systems [38], and probably sequestration of metals in leaf vacuoles and apoplast [39].
Figure 4: The transfer factor (T.F) of lead (Pb) in edible part of plants sampled in both communities.
Figure 5: The transfer factor (T.F) of zinc (Zn) in edible part of plants sampled in both communities.
Bioaccumulation factor of lead and zinc in edible plant parts
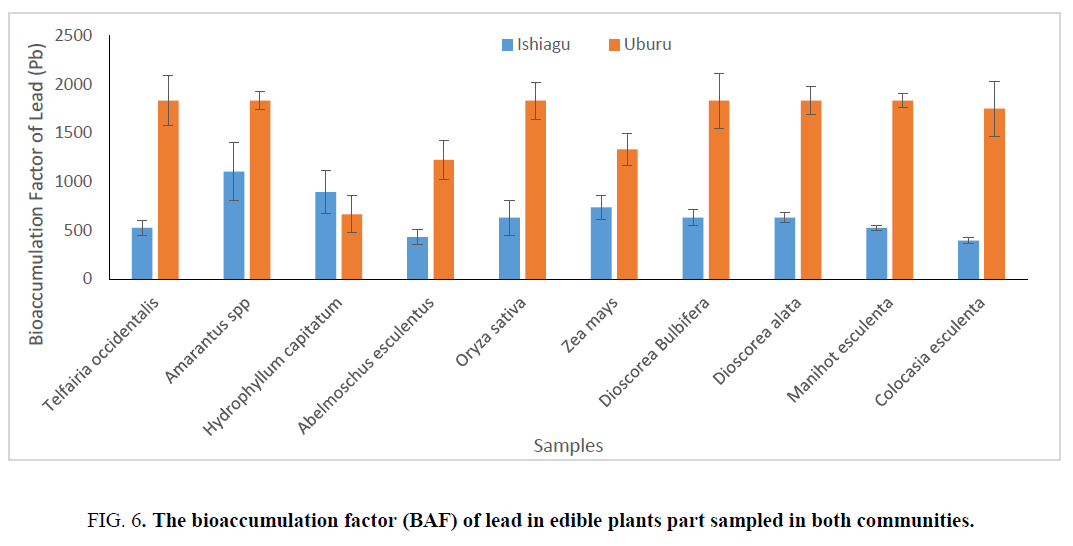
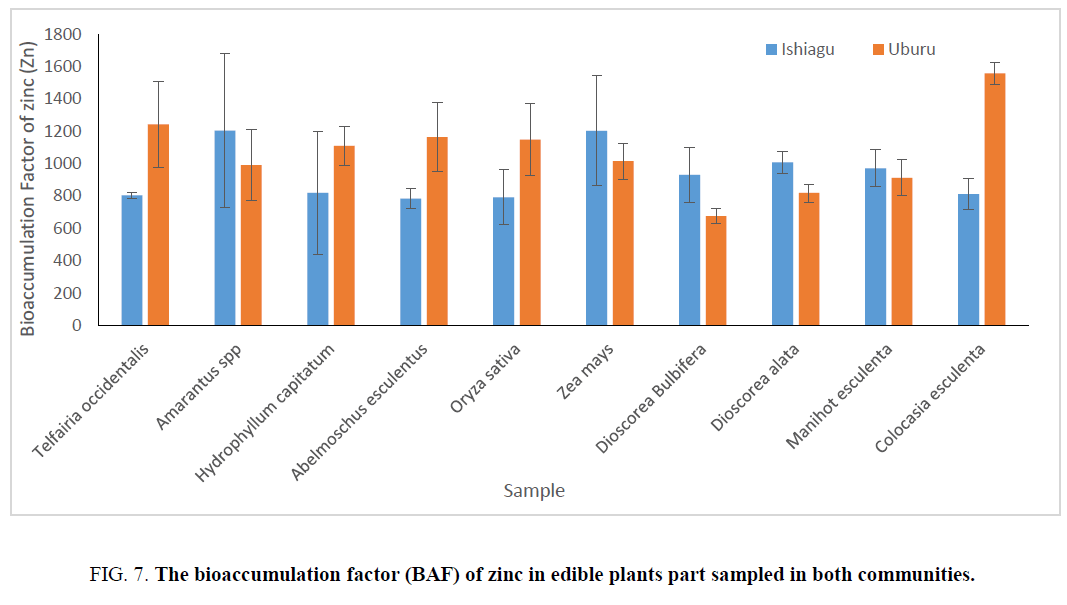
On determining the bioaccumulation index (BAF), which measures the accumulation from water sources also showed that Amarantus spp exhibited the highest bioaccumulation factor of 1105.265 ± 297.73 and 1204.87 ± 475.17 for lead and zincrespectively for samples from Ishiagu, while the bioaccumulation factor of A. esculentus (431.58 ± 74.43) and C. esculenta (394.735 ± 29.77) for lead in Ishiagu were found to be the lowest. it was also shown that zinc showed higher bioaccumulation factor in all the sampled material with the exception of A. esculentus (784 ± 62.22) for samples from Ishiagu.
For sample from Uburu, H. capitatum show the lowest bioaccumulation, while the bioaccumulation factors were approximately the same in Oriza sativa, Amarantus spp etc. The bioaccumulation of zinc in plant where lower than that of lead showing than plants have a higher tendency to accumulate lead more than zinc. Although the concentrations of zinc were higher than lead in water. The bioaccumulation factor of zinc in Ishiagu showed that Amarantus spp and Z. mays have the highest bioaccumulation factor (Figure 6 and 7). On comparing the plants sampled, it was observed that vegetable and cereals have the highest accumulation of heavy metal and they are normally used for phyto-remediation processes.
Figure 6: The bioaccumulation factor (BAF) of lead in edible plants part sampled in both communities.
Figure 7: The bioaccumulation factor (BAF) of zinc in edible plants part sampled in both communities.
Determination of the absorbed lead and zinc amounts
According to Hart et al. [32], the pattern of consumption of African leafy vegetables in rural areas shows the average consumption of vegetable to be 61.5 g day-1. The Table 3 shows the amount of lead and zinc that could be absorbed into the hemoglobin of an adult individual living in these rural areas. The results show that 85.54 µg and 52.77 µg day-1 of lead could be absorbed by individual living in Ishiagu and Uburu respectively.
| Ishiagu | Uburu | |||
|---|---|---|---|---|
| Mean lead concentration | Mean Zinc concentration | Mean lead concentration | Mean Zinc concentration | |
| Amount consumed per day through the consumption of vegetables (mg kg-1) | 0.86 | 13.88 | 0.53 | 9.74 |
| Amount absorbed into the blood (mg kg-1) |
0.086 | ND | 0.053 | ND |
| Amount that enter the plasma per day (µg day-1) |
0.864 | ND | 0.053 | ND |
| Amount that enter the hemoglobin per day (µg day-1) | 85.54 | ND | 52.77 | ND |
Table 3: Shows the result of the calculated absorbed lead and zinc.
The average intake of lead in food per day through the consumption of studied vegetables was calculated to be about 86.92µg day-1 for Ishiagu excluding water, air and other food stuff taken by individuals living in the area. About 10% of ingested lead is absorbed into the blood [33,40], with 85.9 µg day-1 of lead been absorbed into the blood and 85.05 μg binds to the hemoglobin, because according to Saeed et al., [41], 99% of the lead absorbed in the blood get attached the heamoglobin. The total lead burden is found in the plasma per day was calculated to be 0.86 µg (1%). This situation notwithstanding, it is known that bioaccumulation of small doses of this metal over time can constitute a serious health hazard [42,43].
According to Ziegler et al., [44] and Laidlaw et al., [45], Children are more vulnerable to lead toxicity because they absorbed about 50% of lead ingested from food, water and contaminated dust. The consumption of 85.9 µg of lead per day is relatively high although compounds such as vitamin C (a known free-radical scavenger) have been shown to have some chelation capacity [46] which may be contained in fruits and vegetables. Vitamin E (which has a protective action in membrane stability) helps to prevent membrane lipoproteins from oxidative damage caused by lead [47]. Lead can alter Red Blood Cell (RBC) membrane flexibility and increases RBC fragility leading to increased risk for hemolysis [48,49], zinc (which is known to compete with lead binding by metallothionein-like transport protein in the gastrointestinal tract) can also influences both tissue accumulation of lead and susceptibility to lead toxicity [50].
Vegetables are not the only source of lead to the populace, in other words, the amount lead taken in might be higher than 85.9 µg day-1. Cereals, tubers and water which the people drink contribute to the increasing levels of lead. The amount of zinc consumed via the consumption of vegetable was calculated as 13.7 mg day-1. The value of Recommended Dietary Allowance of zinc for Male and female is 11 mg day-1 and 8 mg day-1 respectively [51], this shows that the zinc concentration is within the normal range. Intakes of 150 mg to 450 mg of zinc per day are known to produce toxicity which can lower copper status, altered iron function, reduced immune function and reduced levels of high-density lipoproteins (the good cholesterol) [52-54]. Zinc toxicity also shows symptoms like tachycardia, vascular shock, dyspeptic nausea, vomiting and diarrhea, pancreatic is and damage of hepatic parenchyma [55]. Vegetables that growing on zinc contaminated soils can also cause serious health risk to consumers due to accumulate of high concentrations of zinc in plants. The maximum zinc tolerance for human health has been established for edible parts of crops according to WHO [56] for Zinc in vegetables is 100 µg g-1.
Risk assessment
Lead is toxic to both animals and plants, although plants usually show ability to accumulate large amounts of lead (Phytoaccumulation) without visible changes in their appearance or yield. In some plants, lead accumulation can be higher than the threshold of maximum level permissible for human [57], thus its contamination of vegetables in Ishiagu and Uburu communities. Although the maximum permissible limit of lead (Pb) has been established for edible plant parts according to the WHO standards is 0.3 µg g-1 WHO [56]. The result in Table 3 showed that there are higher concentrations of lead and zinc vegetables in Ishiagu when compared to that from Uburu, this could be attributed to anthropogenic activity (mining of lead) going on presently in Ishiagu. While the concentrations of lead in fruited pumpkin is higher in Uburu as when compared with that from Ishiagu which might be as a result of the localization of the heavy metal in the environment Table 4.
| Variables | Ishiagu | Uburu | ||
| Lead (mg Kg-1 day-1) | Zinc (mg Kg-1 day-1) | Lead (mg Kg-1 day-1) | Zinc (mg Kg-1 day-1) | |
| Daily Intake of Metals (DIM) | 0.0012 | 0.0197 | 0.0008 | 0.0138 |
| Health Risk Index (HRI) | 0.0041 | 0.0002 | 0.0025 | 0.00014 |
Table 4: Shows the Daily Intake of Metals (DIM) and Health Risk Index of lead and zinc in both Ishiagu and Uburu
In health risk determination of any pollutant, it is very important to estimate the level of exposure, by detecting the routes of exposure to the target organisms [58]. There are different pathways and sources of exposure to humans of which the food chain is the most important pathway. The daily intake of metals was estimated according to the average vegetable consumption for the inhabitants of Ishiagu and Uburu which was calculated in Table 4. The DIM values for lead and zinc were high when based on the consumption of vegetables grown in the sampled area.
The Health Risk Index (HRI) of lead and zinc where found to be less than one (1) which according to IRIS [34] declares the exposed population safe. It is also worthy to note that vegetables are not the only source of pollution of these metals. In other words, the pollution and the effect of these metals could be higher than the calculated results when all other sources of pollution such as the concentration of these metals in water and air are put into consideration.
Conclusions
Mining and quarrying of rocks in Ishiagu have been shown in this study to increase the levels of lead and zinc in the environment. These also correlate to the increase of these metal in the vegetable cultivated along the mining sites. The results have shown that the concentration of lead and zinc in both communities were higher than the permissible limits due to the natural deposits of the metal in the soil. But the mining and quarrying activities in Ishiagu might be held responsible for the increase concentration of these metal in the food chain. Since accumulation of metal is time dependent (i.e. depends on the age of the plants) one could suggest that early harvest of the plant could help to reduce that amount of metals absorbed by the plants. The inhabitants of both communities should be encouraged to take diets rich in vitamin C and E since they help in chelating the metals and maintain membrane stability respectively. The monitoring of the environment should also be a regular process as to establish when mining or quarrying should be terminated so as to save the environment from degradation.
References
- Chibuike GU, Obiora SC. Heavy metal polluted soils: Effect on plants and bioremediation methods. Appl Environ Soil Sci. 2014;1-12.
- Tchounwou PB, Yedjou CG, Patlolla AK, et al. Heavy metal toxicity and the environment. EXS. 2012;101:133-64.
- Sharma B, Singh S, Siddiqi NJ. Biomedical implications of heavy metals induced imbalances in redox systems. Biomed Res Int. 2014:640754.
- Zenz C. Lead and its compounds. In: Occupational medicine: Principles and practical applications. Yearbook Medical Publishers, Chicago. 1988. p. 531-39.
- Koichiro M, Krantz SB. Inhibition of heme synthesis induces apoptosis in human erythoid progenitor cells. J Cell Physiol 2005;163:38-50.
- Hoffman DJ, Heinz GH, Audet DJ. Phosphorus amendment reduces hematological effects of lead in mallards ingesting contaminated sediments. Arch Environ Contam Toxicol 2006;50(30):421-8.
- Browing E. Toxicity of industrial metals. 2nd ed. Butterworths, London:. 1969.
- Galdes A, Vallee BL. Categories of zinc metalloenzymes. Metal Ions in Biological Sys 1983;15:1-54.
- O’Dell BL. History and status of zinc in nutrition. Federation Proc 1984;43:2821-2.
- Fisher NS, Jones GJ. Effects of copper and zinc on growth, morphology and metabolism of Asterionella japonica (Cleve). J Exp Mar Biol Ecol. 1981;51(1):37-56
- Stauber JL, Florence TM. Mechanism of toxicity of zinc to the marine diatom Nitzschia closterium. Marine Biology 1990;105(3):519-24
- Clancey NP, Murphy MC. Zinc-induced hemolytic anemia in a dog caused by ingestion of a game-playing die. Can Vet J. 2012;53(4):383-6
- Brink MF, Becker DE, Terrill SW et al. Zinc Toxicity in the weanling pig. J Animal Sci. 1959;18(2):836-842.
- Dudka S, Miller WP. Accumulation of potentially toxic elements in plants and their transfer to human food chain. J Environ Sci Health B. 1999;34(4):681-708.
- Amir S, Hafidi M, Merlina G, et al. Sequential extraction of heavy metals during composting of sewage sludge. Chemosphere. 2005;59(6): 801-10.
- Azco?n, R, Ambrosano E, Charest C. Nutrient acquisition in mycorrhizal lettuce plants under different phosphorus and nitrogen concentration. Plant Sci. 2003;165(2003):1137-45.
- Tangahu BV, Abdullah SRS, Basri H, et al. A review on heavy metals (As, Pb, and Hg) uptake by plants through phytoremediation. Int J Chem Eng. 2011;1-31.
- Muchuweti M, Birkett JW, Chinyanga E, et al. Heavy metal content of vegetables irrigated with mixtures of wastewater and sewage sludge in Zimbabwe: implications for human health. Agriculture. Ecosystems Environ 2006;112:41-8.
- Rattan RK, Datta SP, Chhonkar PK, et al. Long-term impact of irrigation with sewage effluents on heavy metal content in soils, crops and groundwater: a case study. Agric Ecosystems Environ. 2005;109(3-4):310-22.
- Basta NT, Ryan JA, Chaney RL. Trace element chemistry in residual - treated soil: Key concepts and metal bioavailability. J Environ Quality 2005;34(1):49-63.
- Vousta D, Grimanis A, Samara C. Trace elements in vegetables grown in industrial areas in relation to soil and air particulate matter. Environ Pollut. 1996;94(3):325-35.
- Arai S. Global view on functional foods: Asian perspectives. Brit J Nutr. 2002;88(2):S139 - S43.
- Al-Jassir MS, Shaker A, Khaliq MA. Deposition of heavy metals on green leafy vegetables sold on roadsides of Riyadh City, Saudi Arabea. Bull Environ Contam Toxicol 2005;75(5):1020-7.
- Ma HW, Hung ML, Chen PC. A systemic health risk assessment for the chromium cycle in Taiwan. Environ Int. 2007;33(2):206-18.
- Adams WJ, Chapman PM. Assessing the hazard of metals and inorganic metal substances in aquatic and terrestrial systems. New York: CRC Press; 2003.
- McCammon SL. The organization for economic cooperation and development: challenges for risk assessment. Environ Biosafety Res. 2006;5:239-43.
- Gaugitsch H. The impact of the OECD on the development of national/international risk/safety assessment frameworks. Environ Biosafety Res. 2006;5:219-22.
- National Research Council (NRC). Risk Assessment in the Federal Government: Managing the Process. Washington, DC: National Academy Press; 1983. p. 19-29.
- Adrian WJ. A comparison of a wet pressure digestion method with other commonly used wet and dry- ashing methods. Analyst. 1973;98:213-6.
- Sinha P, Dube BK, Sriastava P, et al. Alteration in uptake and translocation of essential nutrients in cabbage by excess lead. Chemosphere. 2006;65:651-6.
- Lokeshwari H, Chandrappa GT. Impact of heavy metals contamination of Bellandar Lake on soil and cultivated vegetation. Curr Sci. 200691:622-27.
- Hart AD, Ajubuike CU, Barimalaa IS, et al. Vegetable consumption pattern of households in selected areas of the old Rivers State of Nigeria. Afr J Food Agric Nutr Dev. 2005;5:1-19.
- Markowitz M. Lead poisoning. Paediatr Rev. 2000;21:327-35.
- Khan S, Farooq R, Shahbaz S, Khan MA, et al. Health risk assessment of heavy metals for population via consumption of vegetables. World Appl Sci J. 6:1602-6.
- Oje OA, Uzoegwu PN, Onwurah INE et al. Environmental Pollution Levels of Lead and Zinc in Ishiagu and Uburu Communities of Ebonyi State, Nigeria. Bull Environ Contam Toxicol. 2010;85:313-7.
- Baker AJM. Accumulators and excluders - strategies in the response of plants to heavy metals. J Plant Nutr. 1981;3(1-4):643-54.
- Zu YQ, Li Y, Chen JJ, et al. Hyperaccumulation of Pb, Zn and Cd in herbaceous grown on lead-zinc mining area in Yunnan. China. Environ Int. 2005;31:755-62.
- Zhao FJ, Hamon RE, Lombi E, et al. Characteristics of cadmium uptake in two contrasting Eco types of the hyperaccumulator Thlaspicae rulescens. J Exp Bot 2002;53:535-43.
- Lasat MM, Pence NS, Garvin DF, et al. Molecular physiology of zinc transport in the Zn hyperaccumulator Thlaspicae rulescens. J Exp Bot. 2000;51:71-9.
- Wang N, Chen C, Nie X, et al. Blood lead level and its association with body mass index and obesity in China - Results from SPECT-China study. Scientific Reports. 2015;5:18299.
- Saeed S, Hasan S, Kuldeep K, et al. Lead poisoning: A persistent health hazard-general and oral aspects. Biomed Pharmacol J 2017;10(1).
- Pickering KT, Owen LA. Water Resources and Pollution. In: An Introduction to Global Environmental Issues. 2nd ed. London: Psychology Press, New York; 1997. 187-207 p.
- Govind P, Madhuri S. Heavy metals causing toxicity in animals and fishes. Res J Animal Veterinary and Fishery Sci. 2014;2(2):17-23.
- Ziegler EE, Edwards BB, Jensen RL. Absorption and retention of lead by infants. Pediatr Res. 1978;12(1):29-34.
- Laidlaw MAS, Filippelli GM, Brown S, et al. Case studies and evidence-based approaches to addressing urban soil lead contamination, Appl Geochem. 2017;83:14-30.
- Dalley JW, Gupta PK, Hung CT. A physiological pharmacokinetic model describing the disposition of lead in the absence and presence of L-ascorbic acid in rats. Toxicol Lett 1990;50:337-48.
- Packer L, Witt EH, Tritschler HJ. Alpha- lipoic acid as a biological antioxidant. Free Radic Biol Med. 1995;19(2):227-50.
- Levander OA, Morris VC, Ferretti RJ. Filterability of erythrocytes from vitamin E-defcient lead-poisoned rats. J Nutr. 1977;107(3):363-72.
- Rabinowitz MB. Toxicokinetics of bone lead. Environ Health Prespect. 1991;91:33-37.
- Peraza MA, Fierro FA, Barber DS, et al. Effects of micronutrients on metal toxicity. Environ Health Perspect. 1998;106(S1):203-16.
- Mohammed MI, Ahmad UM. Mineral elements content of some coarse grains used as staple food in Kano metropolis, Nigeria. Bayero J Pure Appl Sci. 2014;7:85-9.
- Jayant DD, Mohini MJ, Purushottam AG. Zinc: The trace element of major importance in human nutrition and health. Int J Med Sci Public Health. 2013;2:1-6
- Barone A, Ebesh O, Harper RG. Placental copper transport in rats: Effects of elevated dietary zinc on fetal copper, iron and metallothionien. J Nutr. 1998;128:1037- 41.
- Gyorffy EJ, Chan H. Copper deficiency and mycrocytic anemia resulting from prolonged ingestion of over-the-counter zinc. Am J Gastroenterol 1992;87:1054-55.
- Salgueiro MJ, Zubillaga M, Lysionek A, et al. Zinc as an essential micronutrient: A review. Nutr Res. 2000;20:737-55.
- WHO. Food additives and contaminants. Joint FAO/WHO Food Standards Program 2001; ALINORM 01/12A:1-289. 2001.
- Wierzbicka M. How lead loses its toxicity to plants. Acta Soc Bot Pol. 1995;64:81-90.
- Monu A, Bala K, Shweta R. Heavy metal accumulation in vegetables irrigated with water from different sources. Food Chem. 2008;111:811-15.
