Original Article
, Volume: 16( 14)Determination of Cetylpyridinium Chloride Employing a Sensitive Fluorescent Probe
Jian-Hong X, Lin S, Li-Ming D*, Cai-Ping C*‡, Hao W and Yin-Xia C
School of Chemistry and Material Science, Shanxi Normal University, PR China
- *Correspondence:
- Li-Ming D*, School of Chemistry and Material Science, Shanxi Normal University, Linfen Shanxi, P.R. China 041004, *E-mail: lmd2004@163.com;
- Cai-Ping C*‡, School of Chemistry and Material Science, Shanxi Normal University, Linfen Shanxi, P.R. China 041004, ‡E-mail: Sxsdsjz@163.com
Received: June 27, 2016; Accepted: July 06, 2016; Published: July 09, 2016
Citation: Jian-Hong X, Lin S, Li-Ming D, et al. Determination of Cetylpyridinium Chloride Employing a Sensitive Fluorescent Probe. Anal Chem Ind J. 2016;16(14):107.
Abstract
The fluorescence quenching of cucurbit[7]uril-palmatine(CB[7]-PAL) complexes by cetylpyridinium chloride (CPC) has been studied in aqueous solutions. The results show that the rate of the fluorescence quenching was proportional to the concentration of CPC. A fluorescent probe method of simply, accurately and high sensitivity was developed for the determination of CPC in pharmaceutical preparations and human urine through the supramolecular complex formation with CB[7]. The linear range of the method was from 0.019 μg mL−1 to 3.556 μg mL−1, with a detection limit of 0.007 μg mL−1. Molecular modelling of the interaction between CPC and CB[7] was established and was also confirmed by 1 H NMR. This paper also discusses the mechanism of fluorescence for the indicator probes. This shows that the proposed method has the potential for therapeutic monitoring, pharmacokinetics and clinical applications.
Keywords
Cetylpyridinium chloride; Fluorescence probe; Cucurbit[7]uril; Palmatin
Introduction
Cetylpyridinium chloride (CPC, Scheme 1), also known as Sixteen alkyl pyridine chloride, is a nitrogenous cationic surface-acting agent. It is widely used in industrial and commercial formulations, including disinfectants, textile softeners, cosmetics and pharmaceuticals [1], and hence its accurate determinations are demanded. Some methods, such as screen-printed ion selective electrodes [2], spectrophotometric estimation [3,4], thin-layer chromatography [5,6], gas chromatography [7,8], high-performance liquid chromatography [9,10], reversed-phase high performance liquid chromatography [11], potentiometry [12,13], capillary electrophoresis [14], PVC Matrix membrane sensor for potentiometric [15] and hydrophilic interaction chromatography [16] were developed for the determination of CPC. However, the reported liquid chromatographic and gas chromatography generally require a complicated extraction process, time consuming operation steps, complicated and expensive equipment and labor-intensive sample preparation procedures. Though easy to operate, the capillary electrophoresis method was limited because of the low sensitivity in pharmaceutical samples. Therefore, a high sensitive, convenient and rapid method is of urgent need for the detection of CPC.

Scheme 1: Structure of cucurbit[7]uril (CB [7]), palmatine (PAL ) and Cetylpyridinium Chlorideloride (CPC).
Cucurbit[n]urils (CB[n], n=5-8, 10) are a family of cyclic host molecules comprised of n glycoluril units bridged by 2 n methylene groups (Scheme 1). Symmetrical CB[n] hosts possess hydrophobic cavities and restrictive polar portals lined with ureido carbonyl groups [17]. Over the past few decades, the cucurbit[n]uril family of molecular containers has emerged as a premier platform for basic and applied studies of molecular recognition in aqueous solutions [18,19]. CB[n] and their derivatives have increasingly attracted attention because of their hydrogen bonding, ion-dipole interactions, and dipole-dipole interactions with a wide range of guest molecules [20,21]. The CB[7] host has been of particular interest in recent years because of its superior solubility in aqueous solutions compared with the other CB[n] members and because of its remarkable ability to form host-guest complexes with organic compounds and cations [22-24].
Herein, we employ palmatine (PAL) as signal probes for the fluorescence detection of CPC in biological fluid samples (Scheme 1). When CPC was added to an aqueous solution of CB[7], there was no distinct fluorescence change. However, a dramatic increase in fluorescence intensity was observed when PAL was added to the CB[7] solution. As such, when CPC was mixed with CB[7]-PAL complexes, a significant decrease of fluorescence intensity can be observed. Moreover, the designed method was successfully applied for the detection of CPC in pharmaceutical preparations and showed promise for use in various practical scenarios.
Experimental
Instrumentation
The fluorescence measurements were performed on a Cary Eclipse spectrofluorometer (America). The slit widths of both excitation and emission monochromators were set to 5 nm. The fluorescence spectra were recorded at a scan rate of 1200 nm min−1. All measurements were performed using a standard 10 mm path-length quartz cell at 25.0°C ± 0.5°C. Absorption spectra were measured on a U-3010 UV-visible spectrophotometer (Hitachi, Japan). 1H NMR spectra were obtained using a Bruker AV-600 MHz spectrometer (Switzerland) in D2O buffered with DCl (0.10 mol L−1). Molecular modeling calculations were optimized at the B3LYP/6-31 G(d) level of density functional theory with the Gaussian 09 program.
Materials and reagents
Balmatine (PAL) was obtained from the Chinese National Institute for the Control of Pharmaceutical and Biological Products (Beijing). Cetylpyridinium Chlorideloride (CPC) was purchased from Aladdin. Xipiluan buccal Tablets was purchased from Shandong New Time Pharmaceutical Co., Ltd, CB[7] was prepared and characterized according to a reported procedure [25,26]. CB[7] stock solutions of 1.0 mmol L−1 were prepared by dissolving CB[7] in a 100 mL volumetric flask with double distilled water. All of the stock standard solutions were stable for several weeks at room temperature. Britton-Robinson buffer solutions were prepared using 0.01 mol L−1 boric acid, acetic acid and phosphoric acid, and the pH values were adjusted using 0.05 mol L−1 sodium hydroxide or hydrochloric acid. All other chemicals were of analytical grade, and double distilled water was used throughout the procedure.
Spectral measurement procedure
The fluorescence measurements of PAL and the complexes were carried out using excitation wavelengths of 345 nm. in the absence or presence of CPC or a sample. In a 10 mL colorimetric flask, 0.8 mL of 0.1 mmol L−1CB[7] solution, 0.8 mL of 0.1 mmol L−1 probe molecular solution (PAL), followed by 1.0 mL of 0.1 mol L−1 Britton-Robinson buffer solutions, and a given concentration of CPC standard solution or sample solution were sequentially added. The mixture was diluted to the volume with doubly distilled water and shaken for 15 min at room temperature.
Analysis of CPC in pharmaceutical preparations
The fluorescent probe method was also applied in the determination of CPC in pharmaceutical preparations. A certain number of Tablets were placed in agate mortar and ground into powder. An equivalent of 100 mg of the tested drug was accurately weighed from the powder, placed inside a 100 mL volumetric flask, dissolved in fresh double distilled water and vibrated thoroughly for 10 min. The first 10 mL of the filtrate was discarded, and 10 mL of the continuation sample solution was diluted to 100 times its volume with water. Further dilutions were performed to obtain the sample solutions using the same testing methods as described in the experimental procedure.
Analysis of CPC in human urine
The fluorescent probe method was applied in the determination of CPC in human urine samples. Urine samples were handled according to a previous protocol [27]. Briefly, each urine sample (10.0 mL) was placed into a centrifuge tube, spiked with 1.0 mL drug stock solution and then centrifuged at 4000 rpm for 10 min. The clear supernatant of the spiked urine sample was extracted by solid phase extraction (SPE) using 001 × 7 strong-acid cation exchange resin. The procedure was as follows: 1 mL of the spiked urine sample was transferred into the SPE cartridge (with the resin height being 1 cm and the diameter 1 cm). After allowing the sample to pass through to waste under gravity, the resin was washed with 1 mL of 1% sodium hydroxide solution and 2 mL double distilled water (amino acids can be removed). The filtrate was discarded. Finally, the analyte was eluted into a colorimetric flask with 4 mL of methanol/water (1:1, v/v), and then the general procedure was followed.
Results and Discussion
Optimization of experimental conditions
Influence of temperature and reaction time: The effect of temperature on the ΔF of the CB[7]-PAL complexes with CPC was investigated in a temperature range of 10°C to 80°C. All formed complexes were stable up to 40°C, and the results are presented in Figure 1. At temperatures above 40°C, the fluorescence intensity greatly decreased because of the dissociation of the complexes at high temperatures. Based on these findings, all further measurements were performed at room temperature. In addition, ΔF reached a maximum within 15 min (Figure 2). The reagents were stable for at least 5 h. Hence, the standard reaction conditions were set to room temperature for 15 min.

Figure 1: Influence of temperature on the fluorescence intensity.

Figure 2: Fluorescence spectra of CB[7] in the presence of PAL in aqueous solution.
Effect of probe concentration on the fluorescence intensity of the complexes
In this paper, PAL served as fluorescent probe. Thus, the selection of the probe concentration was crucial. If the selected probe concentration is too low, the sensitivity of the probe is likewise low. On the other hand, too high a concentration may not be beneficial for establishing the optimum detection limit of the analyte. The effect of concentration on the fluorescence intensity of the complexes was investigated. The concentration of PAL was varied from 1.0 μmol L−1 to 10.0 μmol L−1 (Figure 3). The fluorescence intensity of the complexes was gradually enhanced with increasing PAL concentration until the maximum inclusion equilibrium at CB[7] saturation. Taking everything into consideration, PAL and CB[7] concentrations were 8.0 μmol L−1.

Figure 3: Influence of time on the fluorescence intensity.
Influence of pH
The pH was studied over a pH range of 1.0 to 12.0. The results indicate that the fluorescence dramatically decreased with any increase above pH=9. The results are presented in Figure 4. The reason is that the stability of the CB[7]-PAL complex significantly decreases in the presence of a buffer solution with alkali cations. This is in accord with the previous finding that alkali cations are readily coordinated to the carbonyl-fringed portals of CB[7] thereby hindering the confinement of an organic guest [28]. The binding of sodium cations decreases the rate constant of the organic guest ingression. Our results show that the presence of sodium salts in the buffer solution lessens not only the equilibrium constants of PAL binding to CB[7] but also the fluorescence quantum yields. Therefore, Britton-Robinson buffer solutions was used to adjust the acidity of the system in these experiments. Hence, using Britton-Robinson buffer solutions, the pH was adjusted to 2.0, which was the desired pH for all of the subsequent experiments.

Figure 4: Influence of pH on fluorescence intensity.
Effect of CPC on the formation of CB[7]–PAL complex
In acidic aqueous solutions, PAL showed weak fluorescence emission, while CPC exhibited a weak native fluorescence. In the presence of CB[7], the fluorescence emission did not show an obvious change. However, a dramatic increase in fluorescence intensity was observed upon the addition of CB[7] to PAL solutions (Figure 5). Obvious fluorescence quenching can be observed when adding CPC to the CB[7]-PAL complex gradually in aqueous solution (Figure 6). With the increased concentration of CPC, the fluorescence intensity of the CB[7]-PAL decreased gradually, which is presumably due to rivalry between CPC and PAL molecules to occupy the CB[7] cavity. As a result, PAL was squeezed gradually out of the CB[7] cavity by CPC, forming a new complex of CB[7]-CPC. The fluorescence intensity of the CB[7]-PAL decreased because the complex was dismantled by CPC for competition. Moreover, absorption spectra were taken with a UV-visible spectrophotometer. A blue shift was observed in the UV absorption bands of CB[7]-PAL when CPC was added into CB[7]- PAL at 345 nm (Figure 7). The phenomenon also indicated that PAL was squeezed out of the CB[7] cavity by CPC, and the structure of PAL changed from the conjugate plane rigid structure to original dissociative structure, which cannot emit fluorescence.

Figure 5: Fluorescence spectra of PAL in the presence of CB[7] in aqueous solution with λex/λem = 345/495 nm.

Figure 6: Fluorescence spectra of CB[7]–PAL system in the presence of CPC in aqueous solution with λex/λem=345/495 nm.

Figure 7: Absorption spectra of 10.0 μmol L−1 PAL and 10.0 μmol L−1 CB[7] aqueous solution in the absence and presence of CPC. pH=2.0.
Calibration graph and sensitivity
Aqueous solutions of PAL exhibit very weak fluorescence emission. However, significant increases in fluorescence intensity were observed when CB[7] was added to the alkaloid solutions [29]. The dramatic quenching of the fluorescence intensities of the PAL-CB[7] complexes was observed with the addition of CPC. The fluorescence spectra of the complexes in the presence of different concentrations of CPC are given. The fluorescence intensity decreases with an increase in CPC, while the fluorescence intensities of PAL-CB[7] linearly decreased and then reached minimum values at 30.4 μg mL−1 CPC. The linear ranges were 0.019 μg mL−1 to 3.556 μg mL−1. The linear regression equations were ΔF=141.39C+42.89 (C denotes the concentration of CPC in μg mL−1) with correlation coefficients of 0.9993 and detection limits of 0.007 μg mL−1. The proposed method proved to have a higher sensitivity and selectivity than the other spectrofluorometric methods for the detection of CPC that have been reported in the literature, as presented in Table 1.
| Detection technique | Linear range (μg mL-1) | LOD (μg mL-1) | Application | Reference |
|---|---|---|---|---|
| SPEsa | 0.36-3580 | 3.58 × 10⁻² | pharmaceutical preparations | [1] |
| HPLCb | 0.5-32 | 0.5 | apple | [2] |
| HPLCb | 3-200 | 3.0 | chicken carcasses | [3] |
| RP-HPLCc | 5-2000 | 0.033 | Xipiluan buccal tablets | [4] |
| PVC-MMSPd | 0.5-350 | 0.03.58 | commercial detergents | [5] |
| HILICe | 0.25-50 | 0.125 | chicken meat | [6] |
| PAL-CB[7] | 0.019-3.556 | 0.007 | plasma and urine samples | This work |
Table 1. Comparison with other proposed methods for the determination of CPC.
Apparent association constant and stoichiometry
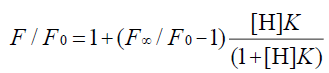
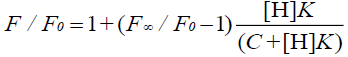
In the 1:1 host-guest inclusion complex (H-G), the fluorescence intensity of the guest (G) was increased with the addition of the non-fluorescent host (H). The change in fluorescence relies on the concentration of H [30,31], and the equation is as follows:
 (1)
(1)
where F is the fluorescence intensity at each H concentration tested, F0 represents the fluorescence intensity of G when H is absent, F∞ is the increase in fluorescence intensity when G is complexed completely, and K was used to express the equilibrium association constant for the 1:1 complexation.
 (2)
(2)
 (3)
(3)
The double reciprocal plot of 1/(F-F0) versus 1/[H] can be used to verify the 1:1 complexation (and thus, the usability of Eq. 1). The 1:1 complexation’s plot is linear, while the higher-order complexes’ plot is nonlinear.
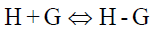
The equilibrium reaction between CB[7] and PAL is as follows:
 (4)
(4)
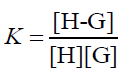
The equilibrium association constant is defined as follows:
 (5)
(5)
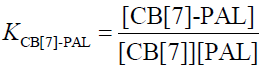
In the function, the added CB[7] is the reason for the fluorescence enhancement of PAL. The tests were performed several times and showed a best fit to Eq. 1 when λex/λem is 345/495 nm in an aqueous solution, giving an average value of KCB[7]-PAL=4.26 × 10⁴ L mol−1 [32].
In the interaction between CB[7] and CPC, the equilibrium equation is as follows:
 (6)
(6)
The equilibrium association constant is defined as follows:
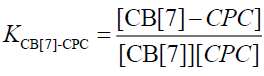 (7)
(7)
Eq. 4 and 6 coexist in the solution when CPC was added to the aqueous CB[7]-PAL system. Hence, the following equilibrium equation was obtained by merging Eq. 4 with Eq. 6:
 (8)
(8)
The equilibrium association constant is defined as follows:
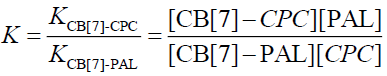 (9)
(9)
Wagner et al. [33] have researched Eq. 1 and have reported that it applies to the host or the guest being measured. In addition, Eq. 10 applies to the measurement of the fluorescence quenching, as opposed to the fluorescence enhancement [34], and C is the concentration of the PAL probe. In this experiment, the CB[7]-PAL was regarded as the H (host). Consequently, Eq. 1 was also the best choice for the fluorescence quenching of the H (CB[7]-PAL) with the addition of G (CPC). Eq. 1 can be used to determine the equilibrium association constant, K (Eq. 9), from the fluorescence titration data of F/F0 at a fixed CB[7]-PAL concentration as a function of CPC concentration.
 (10)
(10)
The fluorescence quenching of the CB[7]-PAL complex with the addition of CPC is shown in Figure 8. The inset shows the linear double reciprocal plot (r=0.999), indicating the formation of a 1:1 host-guest inclusion complex between CPC and CB[7]. The solid line shows the best fit of the data to Eq. 1. Four such trials were performed, yielding an average value of KPAL-CB[7]-CPC=(2.67 ± 0.13) L mol−1. The association constant value of KCB[7]-CPC (Eq. 7) can be calculated according to Eq. 9 and yields KCB[7]-CPC=(1.14 ± 0.17) × 105 L mol−1. The value is large, indicating very strong host-guest interactions with excellent size and shape matches. And the binding constant (K) for these complexes was determined to be KCB[7]-PAL=4.26 × 10⁴ L mol−1. Hence, CPC’s ability to bind with CB[7] is stronger than it is with PAL. Consequently, considering the thermodynamic factor only, CPC molecules easily squeezed PAL molecules out of the CB[7] cavity leading to the fluorescence quenching.

Figure 8: Fluorescence quenching of the CB[7]-PAL system as a function of added CPC with λex/λem=345/495 nm; the solid line shows the best fit of the data to Eq. 1. The inset shows the linear double reciprocal plot indicating 1:1 complexation.
The response mechanism of the host-guest complexation
PAL itself exhibits a very weak fluorescence emission in an aqueous solution. However, its fluorescence intensity is greatly enhanced when it enters the hydrophobic cavity of CB[7]. The fluorescence enhancement may be due to the formation of an inclusion complex between CB[7] and PAL [35] that showed a good linear relationship between ΔF and CCPC, indicating the existence of a 1:1 complex. The binding constant (K) for these complexes were determined to be (1.14 ± 0.17) × 105 L mol−1. According to the above results, the interaction of CB[7] with CPC formed an inclusion complex, which decreased the amount of formed PAL-CB[7], thus decreasing the fluorescence intensity of the complex. However, it was difficult to obtain the K value for this complex using the same method as for the complexes because of the negligible change of fluorescence intensity upon the addition of CB[7] to the CPC solution. When CPC was added to the complex solution, it competed with PAL to occupy the CB[7] cavity (Figure 9). The KCB[7]-CPC value was larger than KCB[7]-PAL, which indicated a stronger ability to bind with CB[7], and the PAL in the CB[7] cavity was displaced by CPC. As a result, the fluorescent intensity of the CB[7]-PAL complex weakened.

Figure 9: The competition diagram for the CB[7] cavity between CPC and PAL.
1H NMR
The formation of the CB[7]-CPC inclusion complex could be confirmed by 1H NMR spectroscopy (Figure 10). Compared with the proton resonance of the unbound CPC molecule (Figure 10b), the resonance of protons H15, H16, H17, H18, H19, H20 and H21 of the bound CPC in the 1H NMR spectrum of the CB[7]-CPC complex experienced a progressively up-field shift (Figure 10c), indicating that CB[7] selectively bonded to the protonated phenyl because of cooperative hydrophobic and ion-dipole interactions and the well-matched size and morphology in an acidic aqueous solution. These findings indicated that the substituted phenyl of the CPC molecule were encapsulated in the CB[7] cavity. The aforementioned discussion was consistent with this.

Figure 10: 1H NMR spectra (600 MHz) of CB[7] (a), CPC (b), CB[7]–CPC complex (c).
Theoretical calculation
Molecular modeling calculations were optimized at the B3LYP/6-31G(d) level of density functional theory [36-38] using the Gaussian 09 program. The results confirmed that the partial inclusion of CPC was in the hydrophobic cavity of CB[7] (Figure 11). It can be seen by molecular simulations that the phenyl was protonated in the acidic solution, giving the cationic form of CPC. The calculations indicated that, in the energy-minimized structure, the phenyl of the molecule was located inside the host. Thus, CPC can force out PAL from the CB[7] hydrophobic cavity because of the stronger combining capacity, demolishing the original fluorescence system, the fluorescence intensity of PAL decreased.

Figure 11: Energy-minimized structure of the CB[7]-TCH complex in the ground state using CPK (Corey-Pauling-Koltun) and sticks exact molecular model for the rendering of atoms. CPK: TCH; sticks: CB[7].
Effect of interfering substances
Prior to the application of the proposed fluorescence method in the drug analysis of human urine samples, the effects of commonly used drug excipients and common ingredients in human urine on the determination of CPC were examined. The criterion for interference was fixed at a ± 5% variation in the average fluorescence intensity calculated for the established level of CPC. As shown in Table 2, the results did not yield any interference for the common ingredients in the injections and urine samples. However, certain components in urine samples, such as cysteine, alanine, phenylalanine and valine, could change the fluorescence intensity to a certain degree. Hence, they should be separated prior to the determination. Accordingly, the separation of CPC from the interfering substances could be achieved through an extraction method with an organic solvent, such as dichloromethane.
| Tolerance ratio | Interference |
|---|---|
| 3000 | Starch, glucose, sucrose, lactose, sorbitol, mannitol, hexane diacid, boracic acid |
| 2000 | Methyl cellulose |
| 1500 | Gelatin, glycin |
| 1000 | Sodium hydroxymethyl cellulose, tryptophan |
| 500 | Sodium carboxymethyl cellulose |
| 100 | Na+, K+, NH4+ |
| 40 | Ca2+, Mg2+, Fe2+, Zn2+ |
| 5 | Cetirizine dihydrochloride, chlorphenamine maleate, ketotifen |
| 3 | Loratadine, promethazine hydrochloride |
| 0.3 | Alanine, cysteine, cystine, phenylalanine, valine |
Table 2. Effect of interference (tolerance error ± 5.0%).
Application of the method
Analysis of CPC in pharmaceutical preparations: The application of the proposed fluorescent probe method to the analysis of CPC in pharmaceutical preparations was performed and proved feasible. The results are presented in Table 3. The relative standard deviation obtained from the proposed method was less than 2.0%. Moreover, to check the validity of the proposed method, the standard addition method was applied by adding CPC to previously analyzed injections. The recovery (Table 3) of the drug was calculated by comparing the concentration obtained from the mixtures with that of the pure drug. In T-tests and F-tests, no significant differences were found between the calculated and theoretical values (95% confidence) of both the proposed and reference methods, indicating a similar precision and accuracy between the values.
| Sample | Lable claim(mg/tablet) | Added (mg mL-1) | Total found (mg mL-1) | Recovery (%) ± RSDb |
|---|---|---|---|---|
| 1 | 2.00 | 0.10 | 2.07 | 98.57 ± 0.22 |
| 2 | 2.00 | 0.20 | 2.22 | 100.90 ± 0.73 |
| 3 | 2.00 | 0.50 | 2.43 | 97.20 ± 0.45 |
| 4 | 2.00 | 1.00 | 2.91 | 97.00 ± 0.82 |
| 5 | 2.00 | 2.00 | 4.05 | 101.25± 0.53 |
Table 3. Determination of CPC in pharmaceutical formulationa (n=5, t0.05,4=2.64).
This method could be employed to monitor the time dependent concentration of CPC in the human urine of healthy volunteers after the oral administration of the CPC medication. The volunteers were pre-medicated with 30 mg of CPC, and the urine was collected over 72 h at various times. The concentration of CPC in the urine increased with the metabolic time from 0 h to 4 h, and reached a maximum in a period of 4.0 h to 4.5 h. Subsequently, the concentration of CPC in the urine decreased. The result indicated that this method was promising as a cost-effective, sensitive, and selective technique for study of the pharmacokinetics of CPC. Because of the high sensitivity, good selectivity and stability shown in the proposed fluorescent method, the method was applied to the determination of CPC in spiked samples of human urine. The results are presented in Table 4. The standard deviations obtained from the proposed method were less than 2.0%. The recoveries examined with the standard addition method were in the range of 97.45 ± 1.43 to 102.2 ± 0.85.
| Sampling time after oral (h) | Concentration of the drug in the urine (μg mL-1) | Amount added (μgmL-1) | Amount added (μg mL-1) | Recovery (%) ± SDa | ||
|---|---|---|---|---|---|---|
| Subject A | Subject B | Subject C | Subject A | Subject A | Subject A | |
| 1 | 4.52 | 5.32 | 5.79 | 5.00 | 9.53 | 100.1 ± 1.02 |
| 4 | 30.3 | 31.1 | 29.8 | 30.00 | 59.8 | 99.17 ± 1.36 |
| 12 | 16.2 | 15.3 | 14.9 | 15.00 | 31.3 | 100.3 ± 0.39 |
| 24 | 11.6 | 10.4 | 10.7 | 10.00 | 21.4 | 99.07 ± 0.74 |
| 36 | 7.23 | 6.87 | 6.36 | 7.00 | 14.0 | 98.4 ± 0.63 |
| 48 | 4.14 | 3.35 | 2.15 | 4.00 | 8.19 | 100.6 ± 0.92 |
| 60 | 1.21 | 1.13 | 1.02 | 2.00 | 3.28 | 102.2 ± 0.85 |
| 72 | 0.611 | 0.432 | 0.412 | 1.00 | 1.57 | 97.45 ± 1.43 |
Table 4. Determination of CPC in spiked urine (n=5, p=95%).
Conclusions
This work presents a novel, simple, rapid, accurate and sensitive fluorescent probe method for the determination of CPC through the supramolecular interaction of CB[7] with CPC and PAL and their fluorescence characterization. The formation of a PAL-CB[7] complex greatly enhances the fluorescence emission of PAL because of its strong coplanar and rigid character. The CPC-CB[7] complex possesses a higher binding constant than the PAL-CB[7] complex; thus, the PAL in the CB[7] cavity can be replaced by CPC to decrease the fluorescence emission of PAL-CB[7]. Based on the competitive mode, the fluorescence method for the determination of CPC shows high sensitivity and good selectivity, and was successfully applied to the analysis of CPC in pharmaceutical preparations and biological fluids. The CB[7]-based fluorescence method provides a robust tool for monitoring metabolism of the drug in pharmaceutical treatments.
Acknowledgements
This work was supported by the National Natural Science Foundation of China (No. 81402895). Helpful suggestions by anonymous referees are also gratefully acknowledged.
References
- MaduniÄ-CaciÄ D,Sak-Bosnar M,GaloviÄ O,et al.Determinationofcationicsurfactantsinpharmaceuticaldisinfectantsusinganewsensitive potentiometric sensor. Talanta. 2008;76(2):259-64.
- Mohamed GG, Ali TA, El-Shahat MF, et al. Potentiometric determination of cetylpyridinium chloride using a new type of screen-printed ion selective electrodes. Anal Chim Acta. 2010;673(1):79-87.
- Schep LJ, Jones DS, Shepherd MG, et al.Primary interactions of three quaternary ammonium compounds with blastospores of Candida albicans (MEN strain). Int J Pharm. 1995;12(5):649-52.
- Benamor M, Aguersif N, Draa MT. Spectrophotometric determination of cetylpyridinium chloride in pharmaceutical products. J Pharm Biomed Anal. 2001;26(1):151-4.
- Rasmussen HT, Pinto AM, deMouth MW, et al.High temperature gas chromatography of trimethylsilyl derivatives of alcohol ethoxylates and ethoxysulfates. J High Resol Chromatogr. 1994;17(8):593-96.
- Paesen J, Quintens I, Thoithi G, et al.Quantitative analysis of quaternary ammonium antiseptics using thin-layer densitometry. JChromatogr A. 1994;677(2):377-84.
- Taylor RB, Toasaksiri S, Reid RG. Determination of antibacterial quaternary ammonium compounds in lozenges by capillary electrophoresis. J Chromatogr A. 1998;798(1-2):335-43.
- Herrero-Martínez JM, Simó-Alfonso EF, Mongay-Fernández C, et al. Determination of cationic surfactants by capillary zone electrophoresis and micellar electrokinetic chromatography with deoxycholate micelles in the presence of large organic solvent concentrations. J Chromatogr A. 2000;895(1-2):227-35.
- Rodríguez-Morales S, Zhou X, Salari H, et al. Liquid chromatography determination of residue levels on apples treated with cetylpyridinium chloride. J Chromatogr A. 2005;1062(2):285-9.
- Zhou X, Handie A, Salari H, et al. High-performance liquid chromatography determination of residue levels on chicken carcasses treated with cetylpyridinium chloride. J Chromatogr B Biomed Sci Appl. 1999;728(2):273-7.
- Wang J, Lu J, Zhang L, et al. Determination of cetylpyridinium chloride and tetracaine hydrochloride in buccal tablets by RP-HPLC. J Pharm Biomed Anal. 2003;32(2):381-6.
- Campanella L, Aiello L, Colapicchioni C, et al.New ion-selective polymeric membranes for cationic surfactant analysis. Analusis. 1996;24(9-10):387-91.
- Egorov VV, Repin VA, Kaputskii VE.Determination of cationic surface-active antiseptics by ion-selective electrodes. J Anal Chem. 1996;51(10):986-8.
- Heinig K, Vogt C, Werner G.Determination of cationic surfactants by capillary electrophoresis. J Anal Chem. 1997;358(4):500-5.
- Mostafa GA. PVC matrix membrane sensor for potentiometric determination of cetylpyridinium chloride. Anal Sci. 2001;17(9):1043-7.
- Morioka H, Nozaki YJ, Kabayama K, et al. J Liq Chromatogr Related Technol. 2014;37,538.
- Wang R, Macartney DH. Cucurbit [7] uril stabilization of a diarylmethane carbocation in aqueous solution. Tetrahedron Lett. 2008;49(2):311-4.
- Moghaddam S, Yang C, Rekharsky M, et al. New ultrahigh affinity host-guest complexes of cucurbit[7]uril with bicyclo[2.2.2]octane and adamantane guests: thermodynamic analysis and evaluation of M2 affinity calculations. J Am Chem Soc. 2011;133(10):3570-81.
- Cao L, Åšekutor M, Zavalij PY, et al. Cucurbit[7]uril⋅guest pair with an attomolar dissociation constant. Angew Chem Int Ed Engl. 2014;53(4):988-93.
- Hart SL, Haines RI, Decken A.Isolation of the trans-I and trans-II isomers of CuII(Cyclam) via complexation with the macrocyclic host cucurbit[8]uril. Inorg Chim Acta. 2009;362(11):4145-51.
- Lu L-B, Yu D-H, Zhang Y-Q, et al. Supramolecular assemblies based on some new methyl-substituted cucurbit[5]urils through hydrogen bonding. J Mol Struct. 2008;885(1-3):70-75.
- Zhou Y, Yang J, Liu M, et al. A novel fluorometric determination of melamine using cucurbit[7]uril. J Lumin. 2010;130(5):817-820.
- Miskolczy Z, Biczók L, Görner H. Tautomerization of lumichrome promoted by supramolecular complex formation with cucurbit [7] uril. J Photochem Photobiol AChem. 2009;207(1):47-51.
- Wei F, Feng YQ. Rapid determination of aristolochic acid I and II in medicinal plants with high sensitivity by cucurbit[7]uril-modifier capillary zone electrophoresis. Talanta. 2008;74(4):619-24.
- Kim J, Jung IS, Kim SY, et al. New Cucurbituril Homologues: Syntheses, Isolation, Characterization, and X-ray Crystal Structures of Cucurbit[n]uril (n = 5, 7, and 8). J Am Chem Soc. 2000;122(3):540-1.
- Day A, Arnold AP, Blanch RJ. Controlling factors in the synthesis of cucurbituril and its homologues. J Org Chem. 2001;66(24):8094-100.
- Chang YX, Qiu YQ, Du LM, et al. Determination of ranitidine, nizatidine, and cimetidine by a sensitive fluorescent probe. Analyst. 2011;136(20):4168-73.
- Megyesi M, Biczók L, Jablonkai I. Highly sensitive fluorescence response to inclusion complex formation of berberine alkaloid with cucurbit [7] uril. J Phys Chem C. 2008;112(9):3410-6.
- Shi L, Xie JH, Du LM, et al. Determination of phenformin hydrochloride employing a sensitive fluorescent probe. Spectrochim Acta A Mol Biomol Spectrosc. 2016;162:98-104.
- Nigam S, Durocher G.Spectral and Photophysical Studies of Inclusion Complexes of Some Neutral 3H-Indoles and Their Cations and Anions with β-Cyclodextrin. J Phys Chem. 1996;100(17):7135-42.
- de la Peña AM, Salanas F, Gómez M. Absorptiometric and spectrofluorimetric study of the inclusion complexes of 2-naphthyloxyacetic acid and 1-naphthylacetic acid with β-cyclodextrin in aqueous solution. J Inclus Phenom Mol RecognitChem. 1993;15(2):131-43.
- Li C, Li J, Jia X. Selective binding and highly sensitive fluorescentsensorofpalmatineanddehydrocorydalinealkaloids by cucurbit[7]uril.Org Biomol Chem. 2009;7(13):2699-703.
- Wagner BD, Boland PG, Lagona J, et al. A cucurbit[6]uril analogue: host properties monitored by fluorescence spectroscopy. J Phys Chem B. 2005;109(16):7686-91.
- Li CF, Du LM, Wu WY, et al. Supramolecular interaction of cucurbit[n]urils and coptisine by spectrofluorimetry and its analytical application. Talanta. 2010;80(5):1939-44.
- Wagner BD, Fitzpatrick SJ, McManus GJ.Fluorescence suppression of 7-methoxycoumarin upon inclusion into cyclodextrins. J Incl Phenom Macrocyclic Chem. 2003;47(3-4):187-92.
- Vassilev P, Louwerse MJ, Baerends EJ. Hydroxyl radical and hydroxide ion in liquid water: a comparative electron density functional theory study. J Phys Chem B. 2005;109(49):23605-10.
- Becke AD. Density-functional exchange-energy approximation with correct asymptotic behavior. Phys Rev A Gen Phys. 1988;38(6):3098-100.
- Becke AD.A multicenter numerical integration Scheme for polyatomic molecules. J Chem Phys. 1988;88(4):2547-53.