Original Article
, Volume: 12( 9)Adsorption of Pb Ions onto Natural and Modified Egyptian Rice Husk: Kinetic and Isotherm Equilibrium Studies
- *Corresponding Author:
- Ammar NS, Water Pollution Research Department, National Research Centre, El-Behooth Street, Dokki, Giza 12622, Egypt, Tel: +002 0128 455 7301; E-mail: nabilaammar@yahoo.com
Received Date: September 05, 2016; Accepted Date: September 19, 2016; Published Date: September 27, 2016
Citation: El-Shafey OI, Ammar NS, El-Shafey SE et al. Adsorption of Pb Ions onto Natural and Modified Egyptian Rice Husk: Kinetic and Isotherm Equilibrium Studies. Environ Sci Ind J. 2016;12(9):113.
Abstract
Getting rid of Pb(II) from wastewater by several low-cost abundant adsorbents was studied. The natural rice husk (RH), that modified with oxalic acid (RH-H+) and sodium hydroxide (RH-OH-), were used at various adsorbent/metal ion ratios. The impact of pH, contact time, adsorbent dose and initial Pb(II) concentration parameters were studied. The results showed that equilibrium time was obtained at 60 min. Three kinetic models were applied to the kinetic adsorption data; pseudo-first order model, pseudo-second order and intraparticle diffusion models. The obtained data are resembled the pseudo-second order kinetic as shown by their correlation coefficient, 0.998, 0.995 and 0.998 for RH, RH-H+ and RH-OH- respectively. The equilibrium adsorption data obey Langmuir and Freundlich isotherm models with maximum adsorption capacities of 10.78 mg/g, 12.5 mg/g and 51.54 mg/g for RH, RH-H+ and RH-OH- respectively. From the Dubinin-Radushkevich (D-R) isotherm model, the value of sorption energy obtained shows that the mechanism of reaction is physical adsorption. The surface adsorption process is verified as a surface phenomenon by performing X-ray diffraction (XRD) analysis.
Keywords
Rice husk; Adsorption; Heavy metal ions; Regeneration; Kinetic; Isotherm models
Introduction
The environmental pollution is one of the most important issues facing humanity. In the past few years, it was increased and reached alarming levels for living creatures [1]. Water pollution due to toxic heavy metals is a major cause of concern. The presence of Lead can cause damage of central nervous system, the kidney, the reproductive system and liver. The toxic symptoms are insomnia, anemia, headache, irritability, muscles weakness, and renal damages [2]. Such heavy metals can be removed by physical and chemical treatment processes from raw sewage as co-precipitation for organic compounds, sedimenta-tion with suspended solids and activated sludge flocs beside microbiological processes [3]. The rice husk (RH) is a porous, bulky, light material, and a byproduct of the rice milling industry. It contains silica (95.81%), lignin (22%), hemicelluloses (20%), and cellulose (42%), rendering it suitable for metallic cation fixation [4]. For increasing the adsorption efficiency of bioadsorbents, rice husk can be modified acidic or basic by using various kinds of treating agents like tartaric acid and NaOH [5,6]. The purpose of this research is determination the potential of unmodified and modified rice husk as sorbents for removing Pb(II) from aqueous solution.
Materials and Methods
Materials
Collection and preparation of adsorbents (RH, RH-H+ and RH-OH-): Rice husk was gained from Egypt rice mill, washed several times with water to remove the dirt, then was soaked in 2.0 mol/L of nitric acid for one hour. Finally, it was rinsed with distilled water for 2-3 times and oven dried at 105°C for 2 h.
Rice husk can be modified with oxalic acid by mixing with a 0.5 mol/l solution of oxalic acid in a ratio of 1:12 (rice husk/acid, w/v) and magnetically stirred for 30 min [7]. Also, it can be modified with sodium hydroxide by soaking 20 g of rice husk in 6% w/v solution of sodium hydroxide at 60°C for 2 h in a paraffin bath, then washing with distilled water until neutral pH. The treated husks were dried at 105°C in an oven overnight [8].
Preparation of Pb(II) solutions: Lead nitrate [Pb(NO3)2] of analytical grade from Merck was used in the preparation of the stock standard solution (1,000 mg/L). The pH of the aqueous solution of metal ions as prepared was 5 5 ± 0.1.
Experiments
pH determination: In fitted glass bottle, 0.2 g of ground adsorbent was mixed with distilled water (25 ml) and boiled for 30 min, cooled, measured the pH using a digital pH meter (HANNA, Model pH20).
The point of zero charge (PZC) determination: Boiling 200 mL of deionized water in Erlenmeyer flask for 20 min to obtain CO2-free water, and then adding 0.5 g of the sample to each 20 mL of CO2-free water. The rubber stoppered flask was left for 3 days at room temperature and pH was measured.
The mineralogical compositions of RH, RH-H+ , RH-OH- were determined by X-Ray powder diffraction patterns. The oxygen containing functional groups presented in these samples were characterized. The mineral composition of RH was determined by ICPOES technique as studied previously [4]. From Table 1, it was found that the most elemental composition of RH is silica, i.e., SiO2 (95.81%).
| Component | Wt% | Component | Wt% |
|---|---|---|---|
| K2O | 2.15 | Al2O3 | 0.12 |
| Na2O | 2.32 | ZnO | 0.02 |
| CaO | 1.11 | Mn2O3 | 0.07 |
| MgO | 0.26 | Fe2O3 | 0.11 |
| CuO | 0.02 | Cr2O3 | 0.01 |
| SiO2 | 95.81 |
Table 1: Elemental composition of RH by ICPOES.
Adsorption experiments
Comparing the removal efficiency of RHA, MRH-H+ and MRH-OH-: To assess the adsorbing ability of RH, RH-H+ and RH-OH- for metal ions, the metal uptake capacities were studied by the batch adsorption experiment. The batch adsorption experiment was conducted by contacting the samples with the Pb(II) in a glass bottles at room temperature.
The percentage of Pb(II) removed by RH, RH-H+ and RH-OH was determined using the following equation:
Removal (%) = [(C0-Cf)/C0] × 100 (1)
Where: C0 and Cf are the initial and final concentration (mg/L) of metal ions in solution, respectively.
Adsorption of Pb(II): A series of experiments were conducted to determine the effects of pH, sorbent dosage, contact time, and initial ions concentration of Pb(II). Also, the sorption kinetic and isotherms models of RH, RH-H+ and RH-OH- for Pb(II) removal were studied. Each experiment was proceeding in a mechanical shaker at 120 rpm, then filtered through filter paper (no. 42) and the metal ions concentration was calculated. The metal concentrations of all samples were determined according to standard method using an atomic absorption spectrometer using Varian Spectra (220) [9].
Results and Discussions
Physicochemical characteristics of RH, RH-H+ and RH-OH-
It is known that the point of zero charge (PZC) and the pH of the medium for adsorbents give a good indication about the surface oxygen complexes and the electronic surface charges of adsorbents.
The physicochemical characteristics for the prepared adsorbents from rice husk are recorded in Table 2. From Table 2, the chemical treatment of rice husk using NaOH and oxalic acid had a significant effect on the physicochemical properties of adsorbent where, pH of both RH-H+ (4.37) and RH-OH- (4.22) is higher than the PZC of them (4.05 and 4.08) while, for RH (5.8) is lower than the PZC (5.98). Consequently, RH-H+ and RH-OH- were more effective for removing Pb ions than RH [10].
| Parameter | RH | RH-H+ | RH-OH- |
|---|---|---|---|
| Color | Buff | Faint brown | Reddish -brown |
| Slurry pH | 5.8 | 4.37 | 4.22 |
| PZC | 5.98 | 4.05 | 4.08 |
| Moisture content | 6.1 | 4.4 | 5.8 |
Table 2:Physical properties of RH, RH-H+ and RH-OH-.
Figure 1 shows XRD for RH-H+ before and after adsorption process. The analysis specifies that two broad peaks are located around 20≈17°C to 35°C proved to be amorphous, this peak was observed by [11] and its intensity increased when the sample was treated with HCl. After binding with Lead ions, RH-H+ recorded some increase in the degree of crystallinity and the intensity of RH was smaller than that after modification. This transformation in crystallinity may be due to bind of some groups with Pb(II) [12].

Figure 1: The X- ray diffraction pattern of RH-H+ (1) before and (2) after adsorption process.
Fourier transformation infrared spectra is a benefit tool to identify function groups of molecules and describe the behavior between the adsorbate and the active groups on the surface of adsorbent. FTIR for RH, RH-H+ and RH-OH- recorded the appearance of three bands around 3467 cm-1, 1637 cm-1 and 1081 cm-1 as shown in Figure 2. The broad bands around 3467 cm-1 indicated the presence of bonded surface OH group and chemisorbed water [13]. The peak band around 1637 cm-1 is due to the existence of stretching vibration of carboxyl groups on the edges of layer planes and the siloxane peak at 1080 cm-1 indicated the formation of Si-O-Si and also confirm the lignin structure of the rice husk [14].

Figure 2: FTIR- spectra for (1) RH, (2) RH-H+ and (3) RH-OH- before adsorption process.
Figure 2 also indicated that the modification of rice husk led to an increase in intensity of peaks with the position changing of some peaks after modifications assigned to the formation of free groups on the surface where, the intensity of peak around 1637 cm-1 increased from 6.62253 to 17.109 and 9.863 for RH, RH-H+ and RH-OH- respectively. Also, the intensity of peak around 3467 cm-1 increased from 0.6744 (RH) to 3.53747 (RH-H+ ) and 3.6748 (RH-OH-). Finally, the intensity of peak around 1081 cm-1 increased from 12.1895 (RH) to 35.855 and 14.1418 for RH-H+ and RH-OH- respectively. These interpretations show that modified rice husks have more free hydroxyl and carboxyl groups than unmodified rice husk [7].
Fourier transform infrared (FTIR) spectra of RH, RH-H+ and RH-OH- after binding with Pb(II) recorded the appearance of the same bands around 3467.38 cm-1, 3465.46 cm-1, 1637 cm-1 and 1081 cm-1 with slightly shifting as shown in Figure 3. For raw rice husk, the broad bands around 3467.38 cm-1 is shifted slightly to 3465.46 cm-1 and 3415.31 cm-1 to 3417.24 cm-1, the peak band around 1617.98 cm-1 is shifted slightly to 1619.91 cm-1. Also, the peak at 1081.87 cm-1 is shifted slightly to 1083.80 cm-1. For modified rice husk (RH+ ), the broad bands around 3477.03 cm-1 is shifted slightly to 3473.17 cm-1, the peak band around 1617.98 cm-1 is shifted slightly to 1619.91 cm-1. While, the peak at 1108.87 cm-1 is divided into two beaks and shifted slightly to 1105.01 cm-1 and 1049.09. For modified rice husk (RH-), the broad bands around 3477.03 cm-1 is shifted slightly to 3475.1 cm-1 and the peak at 1108.87 cm-1 is shifted slightly to 1106.94 cm-1. This shift in wave number match to a change in bonding energy of the functional groups, indicating that the bonding pattern of these functional groups changes after biosorption. Therefore, this result confirmed the involvement of these groups in binding of Pb(II) ions with (RH), (RH-H+ ) and (RH-OH-).

Figure 3: FTIR- spectra for (1) RH, (2) RH-H+ and (3) RH-OH- before adsorption process.
Comparing the removal efficiency of RHA, MRH-H+ and MRH-OH-
The metal uptake capacities of lead ion onto RH, RH-H+ and RH-OH-were tested by shaking 50 mg Pb(II)/L with 1 g adsorbent /100 ml at pH 5.5 ± 0.1 for 2 h. The results showed that the removal efficiencies are 20%, 94% and 95.5% for RH, RH-H+ and RH-OH- respectively. Our results are Consistent with several authors [15,16] who reported that RH treatment with NaOH greatly enhanced the sorption due to its ability for dissolving biomass and destroying metal binding sites.
Sorption of Pb(II) ions
Effect of pH: The influence of pH on the adsorption of Pb(II) onto RH, RH-H+ and RH-OH- were performed by soaking 50 mg Pb(II)/L, adsorbent dose (1 g/100 ml) for 120 min at pH varying from 2-5.5. Figure 4 shows the effect of pH on the adsorption of Pb(II) by the RH, RH-H+ and RH-OH-. It is clear that the highly uptake for Pb(II) on RH occurred at pH 2 then decreased as pH increased to 5.5. This reduction in adsorbed amount of Pb(II) may be ascribed to the increase in the surface repulsion forces between functional groups of RH and Pb(II) [6]. While, for both RH-H+ and RH-OH-, the lower amounts of Pb(II) were adsorbed onto them at pH 2, and then increased sharply as pH reached to 5.5. Where, at pH 2, surface active sites may become positively charged giving a chance for increasing the competition between H+ and Pb(II) for the available adsorption sites. At pH 5, the competition decreased and enhanced the adsorption of Pb(II) through electrostatic force attraction. In addition, the formation of some free surface groups such as –OH, C=O, –HN– (as pointed out in FTIR spectra) during treatment of RH enhance sorption sites available for binding.

Figure 4: Influence of pH on the adsorbed amount of Pb(II) onto all investigated adsorbents (C0=50 mg/L; adsorbent dose=0.1 g; contact time=2 h).
Effect of Contact Time
The effect of contact time (5 min to 120 min) on the removal efficiency of Pb(II) by HA, HA-H+ and HA-OH- is shown in Figure 5. The results indicate that the adsorbed amount of Pb(II) onto RH, RH-H+ and RH-OH- increases with time and the equilibrium achieved within 60 min followed by a stability process. The elimination in the beginning may be attributed to the prompt connection of Pb(II) to the surface of the adsorbent, to the increase in number of active available sites and to the increase in driving force of the concentration gradient between adsorbate in solution and adsorbate-adsorbent interaction [10].

Figure 5: Influence of contact time on adsorption of Pb(II) onto all investigated adsorbents (C0=50 mg/L; pH=2, 5 and 5 for RH, RH-H+ and RH-OH- respectively).
Kinetic Models
The kinetics modeling assists to foretell the optimum conditions for the adsorption process; where, it is dependent on the physical and/or chemical characteristics of both the sorbent and sorbate [17]. The controlling mechanism was examined using the following three kinetic models.
Pseudo-first-order kinetic model
The pseudo-first order kinetic equation is:
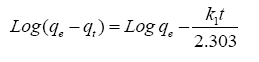 (2)
(2)
From plotting log (qe-qt) vs. t ( Figure 6), no satisfactory straight lines were obtained, indicating that the sorption process does not follow the pseudo-first order kinetic for RH, RH-H+ and RH-OH-. Where, it was found that the calculated values of qe don't fit with the experimental data. Also, the correlation coefficients R2 for RH, RH-H+ and RH-OH- don’t approach the unity.

Figure 6: Pseudo-first-order kinetics for Pb(II) adsorption onto RH, RH-H+ and RH-OH- at optimum conditions.
Pseudo-second-order kinetic model
The pseudo-second-order equation is [18]:
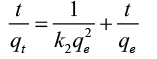 (3)
(3)
Plotting t/qt vs. t. gives straight lines ( Figure 7) which were obtained with high values of R2 close to unity. Also, it was found that the calculated values of qe fit well with the experimental data. The parameters of pseudo-first order and pseudo-second order are recorded in Table 3. These confirm that the pseudo-second-order adsorption mechanism is predominant for adsorption of Pb(II) by RH, RH-H+ and RH-OH-.

Figure 7: Pseudo-second-order kinetics for Pb(II) adsorption onto (a) RH, (b) RH-H+ and (c) RH-OH- at optimum conditions.
| RH | RH-H+ | RH-OH- | |
|---|---|---|---|
| qe Exp. | 0.018 | 0.061 | 0.062 |
| Pseudo-first-order kinetics | |||
| qe (meq/g) | 0.0011 | 0.013 | 0.067 |
| k1 (min-1) | 0.053 | 0.03 | 0.11 |
| R2 | 0.8823 | 0.776 | 0.985 |
| Pseudo-second-order kinetics | |||
| qecal (meq/g) | 0.019 | 0.062 | 0.064 |
| k2 (g/mg min) | 8.7 | 7.6 | 3.3 |
| R2 | 0.998 | 0.995 | 0.998 |
| Intraparticle diffusion model | |||
| Ci | 0.86 | 4.89 | 3.213 |
| kid (mg g-1 min-1/2) | 0.11 | 0.1465 | 0.3496 |
| R2 | 0.759 | 0.8612 | 0.6968 |
Table 3: Kinetic model constants and correlation coefficients for adsorption of Pb(II) onto RH, RH-H+ and RH-OH-at different initial concentrations.
Intraparticle kinetic model
To identify, if the intraparticle diffusion is the rate-determining step for sorption, Qt were plotted against the square root of time [19].
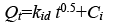 (4)
(4)
Where Ci is the intercept and kid is the intraparticle diffusion constant (g.mg-1.min-0.5). The intercept value identifies the boundary layer thickness; the larger the intercept, the greater the thickness of the boundary layer.
Figure 8 shows that the line does not pass through the origin and this deviation from the origin is due to the difference in the mass transfer rates of the initial and final adsorption stages. The values of kid are listed in Table 3 showing that the modification of RH with NaOH led to an increase in kid from 0.11 to 0.3496 i.e., a nearly 2.15-fold increase. Also, kid value for modification of HA with oxalic acid increased by 1.2 fold. Therefore, the sorption process obeys the pseudo second-order kinetic, which agreed with chemisorption as the rate-limiting mechanism through exchange of electron between sorbent and sorbate [18].

Effect of sorbent dosage
To investigate the optimum adsorbent dose on Pb(II)uptake using different adsorbent doses (0.3, 0.7, 1.0 and 1.3 g) of RH, RHH+ and RH-OH- at the optimum conditions for them. From Figure 9, the removal percent of Pb(II) increases with increasing the amount of adsorbent where, the optimum dose was 1.3, 0.3 and 1.0 g for RH, RH-H+ and RH-OH- respectively. This may be assign to different mechanisms of ion-exchange and adsorption process. The diffusion was faster through the large pores then slow down via smaller diameter channels [20].

Figure 9: Influence of adsorbent amount on adsorption of Pb(II)onto all investigated adsorbents (C0=50 mg/L; pH=2, 5 and 5; contact time=30, 60 and 90 min for RH, RH-H+ and RH-OH- respectively).
Effect of initial Pb (II) concentration
Effect of lead ions concentration were investigated using different Pb(II) concentration (50 mgL-1 to 200 mgL-1) at the optimum conditions of RH, RH-H+ and RH-OH-. From plotting the initial Pb(II) concentration vs. removal %, Figure 10 exhibits that removal % decreased from 64% to 40%, 90% to 65%, and 97.2% to 61% with the increase in Pb(II) concentration from 50 mg/L to 200 mg/L for RH, RH-H+ and RH-OH- respectively. This finding attributed to as the number of Pb(II) per unit volume increased, the saturation and rapid consumption of the binding sites on the adsorbents take place [21].

Figure 10: Influence of initial concentration of Pb(II) on adsorption of pb(II) onto all investigated adsorbents (C0=50mg/L; pH=2, 5 and 5; contact time=30, 60 and 90 min for RH, RH-H+ and RH-OH- respectively).
Isotherm Models
Three isotherm models: Langmuir, Freundlich, and Dubinin-Radushkevich, are studied to decide the most appropriate correlations for the equilibrium data.
Langmuir isotherm model
Langmuir assumes occurrence monolayer adsorption onto homogeneous adsorbent surface [22]. The linear form of the model is:
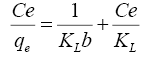 (5)
(5)
The free energy of adsorption can be calculated as follow:
 (6)
(6)
From the data, plots between Ce/qe vs. Ce (Ce is the equilibrium concentration of metal in solution (mg/L), qe is the amount of metal ions adsorbed per unit mass onto adsorbate (mg/g). Figure 11 shows the monolayer adsorption capacities of the adsorbents (Q mg/g) are increased in the order: RH (10.77 mg/g) <RH-H+ (12.48 mg/g) <RH-OH- (51.54 mg/g). Langmuir isotherm model experimental data indicates the homogeneous nature of adsorbent surface, i.e., each Pb(II)/adsorbent surface adsorption site has equal adsorption activation energy. The results exhibit the formation of monolayer of Pb(II) at the outer surface of the hereby treated rice husk adsorbents. The values of KL are found to be 5.63, 12.59 and 21.86 L/g for RH, RH-H+ and RH-OH- respectively, where the higher KL (the sorption monolayer capacity) value is the higher Qm value (Table 4). The values of RL, for the uptake of Pb(II) molecules on the hereby obtained low-cost adsorbents, are found to be in the range 0.42 to 0.16, i.e., 0<RL<1, confirming that the adsorption of Pb(II) was highly favorable onto the prepared adsorbents. Moreover, adsorption of Pb(II) onto the hereby adsorbents exhibits negative values of free energy (ΔG=-8.098 to -5.677) which indicates the feasibility and spontaneous nature of physical adsorption processes and confirmed good affinity of treated these adsorbents for the uptake of Pb(II).

Figure 11: Langmuir isotherm model for Pb(II) adsorption onto RH, RH-H+ and RH-OH- at optimum conditions.
| Parameters | RH | RH-H+ | RH-OH-- |
|---|---|---|---|
| Langmuir | |||
| Qm(mg/g) | 10.77 | 12.48 | 51.54 |
| KL(L/mg) | 5.63 | 12.59 | 21.86 |
| RL | 0.42 | 0.16 | 0.25 |
| ∆G°(J/K/mol) | -8.098 | -7.045 | -5.677 |
| R2 | 0.94 | 0.97 | 0.98 |
| Freundlich | |||
| Kf (mg/g)/(L/mg)1/n | 0.828 | 7.85 | 4.36 |
| 1/n | 0.498 | 0.3998 | 0.206 |
| R2 | 0.92 | 0.922 | 0.999 |
| D-R | |||
| qm (mg/g) | 2.26 × 10⁻⁴ | 7.93 × 10⁻⁴ | 9.55 × 10
|
| β (mol2/J2) | 0.4762 × 10⁻⁸ | 0.347 × 10⁻⁸ | 0.1657 × 10⁻⁸ |
| E (KJ/mol) × 10-3 | 10.25 | 12.04 | 17.37 |
| R2 | 0.9 | 0.937 | 0.996 |
Table 4:The parameters of Langmuir, Freundlich and D-R isotherms for Pb(II) adsorption onto RH, RH-H+ and RH-OH-.
Freundlich isotherm model
Freundlich isotherm assumes reversible multilayer adsorption on heterogeneous surface with different energy sites, linear form for Freundlich model is [23]:
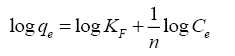 (7)
(7)
From plots between log qe (the concentration of metal ion adsorbed in mg/g) against log Ce (the equilibrium concentration of metal in solution in mg/L) ( Figure 12). Kf and 1/n (the Freundlich constants related to adsorption capacity and adsorption intensity) can be calculated from the intercept and slope and the value of 1/n was found to be less than one (Table 4). It was found that the adsorption data have been described well by both the Langmuir and Freundlich models.

Figure 12: Freundlich isotherm model for Pb(II) adsorption onto RH, RH-H+ and RH-OH- at optimum conditions.
The Dubinin- Radushkevich (D–R) isotherm model
The linear form of D-R equation can be written as follow [24]:
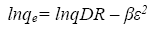 (8)
(8)
A plot of lnqe versus ε2 values ( Figure 13), the values of qDR and β were obtained from the intercept and slope, respectively. The sorption energy Ea (kJ.mol-1) can be obtained from the following relationship:

Figure 13: D-R isotherm model for Pb(II) adsorption onto RH, RH-H+ and RH-OH- at optimum conditions.
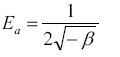 (9)
(9)
The values of adsorption energy supply notification about the adsorption mechanism [25]. The adsorption energy value obtained for RH and RH-H+ is 10.25 and 12.04, suggesting that the adsorption mechanism may be in the beginning is ion exchange then reach at equilibrium with week Vander Waals interaction. While, the adsorption energy for RH-OH- is 17.37 kJ.mol-1 this indicated that the mechanism of Pb(II) adsorption is strong chemical in nature, and the adsorption process is endothermic. Thus, the acidic and alkaline treatments caused a remarkable increase in the adsorption capacity of rice husk confirming the amenability of treatment in removing Pb(II) from wastewater.
Regeneration of Adsorbents
The renovation of adsorbents in water purification process is one of the important factors as it controls the economy of water treatment technology. To examine the recycling of RH, RH-H+ and RH-OH-, the adsorption-desorption cycle was conducted one time at the optimum conditions. According to experiments, after the sorption of Pb(II) by RH, RH-H+ and RH-OH-, the adsorbents were removed from the solution through filtration and were eluted by 0.1 M HCl. The obtained results exhibit that, the removal efficiency for Pb(II) is changed from 64%, 90% and 97% into 60%, 82% and 90% for RH, RH-H+ and RH-OHrespectively. This mean that RH, RH-H+ and RH-OH- can be reused more than one cycle with high efficiency [26].
Conclusions
In this study, we found out
1. The natural RH has low uptake capacity for Pb(II). While the acidic-alkali pretreatment makes it good scavenger for Lead removal from aqueous solutions.
2. The FTIR spectra showed appearance differences in intensities of the observed peaks and formation of free groups on the surface during acidic and alkali modification of rice husk.
3. Adsorption of Pb(II) was influenced by contact time, initial Pb(II) concentration, solution pH, and adsorbent dose parameters.
4. The adsorption kinetic data revealed that adsorption process fitted well with pseudo-second order.
5. The adsorption isotherm data could be well fitted by both Langmuir and Freundlich isotherm models and confirmed that the process was spontaneous and endothermic.
Acknowledgments
I would like to express my deep thanks to the central laboratory, National Research Centre for its technical support.
References
- Renge VC, Khedkr SV, Shraddha VP. Removal of Heavy Metals from Wastewater Using Low Cost Adsorbents: A Review. Sci RevChemCommun. 2012;2(4):580-4.
- Naseem R, Tahir SS. Removal of Pb(II) from aqueous solution by using bentonite as an adsorbent.Water Res. 2001;35(16):3982-6.
- Kulbat E, Olańczuk-Neyman K, Quant B, et al. Heavy Metals Removal in the Mechanical-Biological Wastewater Treatment Plant “Wschód” in Gdańsk. Pol J Environ Stud. 2003;12(5):635-41.
- Elbana AU. Removal of some organic and inorganic pollutents using activated carbons developed from rice husks. Egypt: Mansoura University; 2012.
- Wong KK, Lee CK, Low KS, et al. Removal of Cu and Pb by tartaric acid modified rice husk from aqueous solutions. Chemosphere. 2003;50(1):23-88.
- Kumar U, Bandyopadhyay M. Sorption of cadmium from aqueous solution using pretreated rice husk. Bioresour Technol. 2006;97(1):104-9.
- Weihua Z, Hongjuan B, Ke L, et al. Use of Oxalic Acid-modified Rice Husk for the Adsorption of Neutral Red from Aqueous Solutions. AdsorptSci Technol. 2010;28(7):641-56.
- Ndazi SB, Nyahumwa C, Tesha J. Chemical and thermal stability of rice husks against alkali treatment. Bioresources. 2008;3(4):1267-77.
- Eugene WR, Rodger BB, Andrew DE, et al. Standard Methods for the Examination of Water & Wastewater. 22nd ed. Washington: American Public Health Association (APHA), American Water Works Association (AWWA) & Water Environment Federation (WEF), USA; 2012.
- Fathy NA, El-Shafey OI, Khalil LB. Effectiveness of Alkali-Acid Treatment in Enhancement the Adsorption Capacity for Rice Straw:The Removal of Methylene Blue Dye. IntScholarResNoticePhysChem. 2013;1-15.
- Krishnarao RV, Subrahmanyam J, Kumar TJ. Studies on the formation of black particles in rice husk silica ash. J Eur Ceram Soc. 2001;21(1):99-104.
- Kennedy LJ, Vijaya JJ, Sekaran G. Effect of Two-Stage Process on the Preparation and Characterization of Porous Carbon Composite from Rice Husk by Phosphoric Acid Activation. IndEngChem Res. 2004;43(8):1832-8.
- Stuart B. Modern Infrared Spectroscopy. Chichester: Wiley, UK; 1996.
- Daifullah AAM, Girgis BS, Gad HMH. Utilization of agro-residues (rice husk) in small waste water treatment plants. MaterLett. 2003;57(11):1723-31.
- Low KS, Lee CK, Lie SC. Sorption of cadmium and lead from aqueous solution by spent grain. Process Biochem. 2000;36(1-2):59-64.
- Xie J, Chang HL, Kilbane J. Removal and recovery of metal ions from wastewater using biosorbents and chemically modified biosorbents. Bioresour Technol. 1996;57(2):127-36.
- Santhi T, Manonmani S, Smitha T. Removal of malachite green from aqueous solution by activated carbon prepared from the epicarp of RicinusCommunis by adsorption. J Hazard Mater. 2010;179(1-3):178-86.
- HoYS, McKay G. Sorption of dye from aqueous solution by peat.ChemEng J. 1998;70(2):115-24.
- Patil S, Deshmukh V, Renukdas S, et al. Kinetics of Adsorption of Crystal Violet from Aqueous Solutions Using Different Natural Materials. IntJ Environ Sci. 2011;1(6):1116.
- Ismail AI, El-Shafey OI, Amr MH, et al. Pumice Characteristics and their Utilization on the Synthesis of Mesoporous Minerals and on the Removal of Heavy Metals.Int Scholar Res Notice. 2014;1-9.
- Ammar NS, Ismail AIM, El-Shafey OI. Engineering behavior influence of basaltic rocks on the adsorption of heavy metal ions. DesalinationWater Treatment. 2016;57(11):5089-99.
- Langmuir I. The adsorption of gases on plane surfaces of glass, mica and platinum. J Am Chem Soc. 1918;40:1361-1403.
- Freundlich HMF. Uber die adsorption in Losungen (Over the adsorption in solutions). J Phys Chem. 1906;57:385-70.
- Dubinin MM, Radushkevich LV. Equation of the characteristics curveof activated charcoal. ChemZent. 1947;1:875-90.
- El-Shafey OI, Fathy NA, El-Nabarawy TA. Sorption of Ammonium Ions onto Natural and Modified Egyptian Kaolinites. KineticEquilibrStud. 2014;1-12.
- Wartelle LH, Marshall WE. Citric acid modified agricultural by-products as copper ion adsorbents. Adv Environ Res. 2000;4(1):1-7.

