Research
, Volume: 19( 1)Water Quality Assessment and Management Survey in Lathyani Village (Una), Himachal Pradesh (India)-A Case Study
- *Correspondence:
- Kalyani Supriya
Department of Environmental Science,
Himachal Pradesh University,
Shimla,
Himachal Pradesh,
Tel: 9459412161;
E-mail: charu.chandel93@gmail.com
Received date: April 08, 2023, Manuscript No. TSES-23-94857; Editor assigned date: April 10, 2023, PreQC No. TSES-23-94857 (PQ); Reviewed date: April 24, 2023, QC No. TSES-23-94857; Revised date: June 27, 2023, Manuscript No. TSES-23-94857 (R); Published date: July 04, 2023, DOI: 10.37532/0974-7451.2023.19(1).267
Citation: Thakur N, Supriya K, Thakur S. Water Quality Assessment and Management Survey in Lathyani Village (Una), Himachal Pradesh (India)-A Case Study. Environ Sci Ind J. 2023;19(1):267.
Abstract
The current study focused on the existing status of wells water by determining the physio-chemical water quality parameters like pH, turbidity, EC, TDS, DO, calcium, magnesium, chlorides, fluorides, nitrates and phosphates in selected study area. A survey has been also conducted to know about perspectives and awareness among local people on wells water quality in study area. The study findings revealed that all the selected parameters for well water quality analysis were within the permissible limits. The results showed that WQI rated under good water quality category and responses from local people in survey was satisfactory.
Keywords
Wells water; Physio-chemical parameters; WQI; Quality; Turbidity
Introduction
The storage of ground water globally is crudely equivalent to the total amount of fresh water deposited in the snow and ice pack, counting North and South poles, but with increasing population and changing living standards day by day, the burden on water resources is growing and per capita the accessibility of water resource is decreasing tremendously. In rural and many urban areas of rising countries, safe and adequate drinking water is a critical problem [1]. In rural areas groundwater is a dependable and finite source of water [2]. For example, in India for the rural regions, the availability of water is mainly from ground resources, which comprise of wells, bore well, hand pump, spring and pond etc. and for the urban areas, water is supplied from various sources, counting both groundwater and surface water sources. The surface water resources contain water stream, river and lake while the ground water sources for urban areas comprise hand pump, bore well and ponds [3]. Globally, the sources of ground water are important for people and to use the groundwater, a bore or well is excavated into the ground to a convinced deepness. The proper management of ground water sources related phenomena for the intelligent usage is the sustainable use of groundwater. These days increasing urbanization, industrialization and unnecessary use of fertilizers, pesticides in the field deteriorating the water both qualitatively and quantitatively and diminishing the aquatic fauna. Occasionally, the natural processes occurred in the environment like numerous hydrological, biological, sedimentation, meteorological, etc. may the reason of undesirable compounds deposition, which disproportion the water chemistry (surface and ground).
Therefore, the constant changes in the variation of groundwater quality to excessive range, origins the usage of this water to be destructive. The water quality is described by its chemical, physical and biological characteristics. For the appropriate usage of this resources and adopting appropriate water treatment, an investigation on water quality analysis has been carried out in selected study area of Himachal Pradesh, India where the groundwater is a primary source for drinking, domestic and agricultural use.
Materials and Methods
Study area description
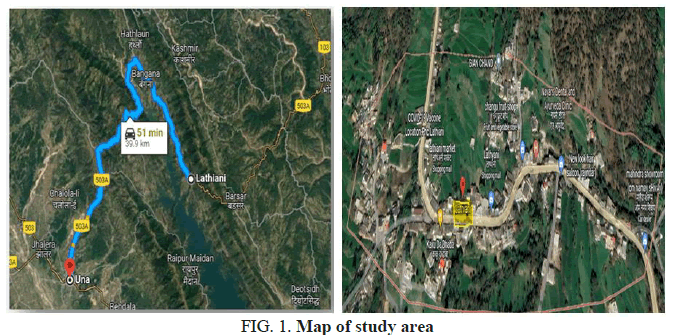
Lathyani is a beautiful village that lies between latitude 31º 28’ 48” N and longitude 76º 16’ 48” E. It comes under Bangana Tehsil in Una district of Himachal Pradesh state, India (Figure 1). The study area situated 40 km away from district headquarters Bangana. The total geographical area of village is 57.56 hectares. The study area has a total population of 484 peoples, out of which male population is 250 while female population is 234. The literacy rate of Lathyani village is 82.64% out of which 87.20% males and 77.78% females are literate. The climate of study area is tropical to temperate in nature, as the terrain varies from plains to high hills. Temperature varies from minimum of 4°C in winter to maximum of 46°C in summer. The annual average rainfall in the area is around 1040 mm, with about 55 average rainy days [4].
Data collection and analysis
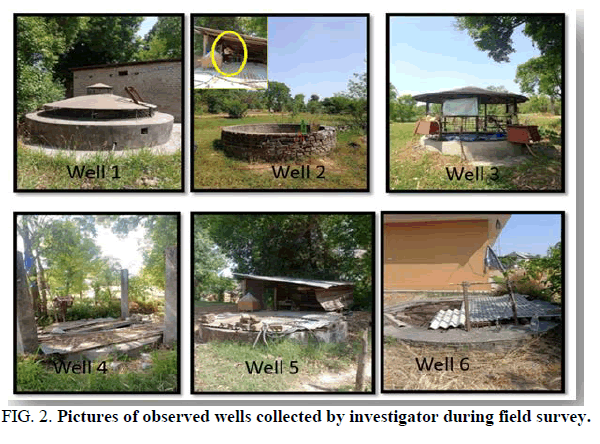
Water sampling: A systematic random sampling method has been used that directly influences the validity of the investigation findings. In present investigation, total eighteen water samples (six samples per month) were collected from six different sampling points (wells) in selected area and analysed for 11 physiochemical water quality parameters (pH, turbidity, TDS, conductivity, Cl-, NO3-, Ca, Mg, DO, phosphate and fluoride) for period of three month (April-June), 2022 (Figure 2). The water samples have been collected from wells varying in depth from100 m-300 m and the method followed for the analyses of wells water quality parameters shown in Tables 1 and 2. In the present investigation, standard methods for the examination of groundwater, 21st edition published by American Public Health Association (APHA) was used for determining parameters. To get a comprehensive picture of overall quality of wells water in selected study area, the Water Quality Index (WQI) has been calculated for the 11 parameters (pH, turbidity, TDS, conductivity, Cl-, NO3-, Ca, Mg, DO, phosphate and fluoride) (Table 1) [5].
| WQI value | Rating of water quality |
|---|---|
| 0-25 | Excellent water quality |
| 26-50 | Good water quality |
| 51-75 | Medium water quality |
| 76-100 | Bad water quality |
| >100 | Very bad water quality |
TABLE 1. Water quality Scale with reference to WQI.
| Sr. no. | Parameter | Unit | Method used | Instrument used |
|---|---|---|---|---|
| 1 | pH | - | Electrochemical method | pH meter |
| 2 | TDS | mg/L | Gravimetric method | Hot air oven |
| 3 | Electrical conductivity | µS/cm | Electromagnetic induction method | Conductivity meter |
| 4 | Turbidity | NTU | Nephelometry | Turbidity meter |
| 5 | Calcium and magnesium | mg/L | Titration method | - |
| 6 | Chloride | mg/L | Titration method | - |
| 7 | Phosphate | mg/L | Stannous chloride method | UV spectrophotometer |
| 8 | Nitrate | mg/L | UV spectrophotometric screening method | UV spectrophotometer |
| 9 | Fluoride | mg/L | SPADNS method | UV spectrophotometer |
| 10 | DO | mg/L | Titration method | - |
TABLE 2. Experiment methods and instrument used for determination of selected water quality parameters.
Survey: In the present investigation, based on a semi structured questionnaire a field survey has been conducted to gather the information through online (via Google form) and offline mode (in-person interviews, informal talks and group meetings) for respondents who lived in selected study area. The survey has been chosen 103 respondents where they divided into nine age groups i.e. group I (18-24), group II (24-30) and group III (30-36), group IV (36-42), group V (42-48), group VI (48-54), group VII (54-60), group VIII (60 and above). In the survey questionnaire there were total 35 questions including six to eight questions ondemographic information like age, gender, occupation, income, family type etc. and other overall questions related to wells waterquality and its management. The respondents were informed about the purpose of the survey before moving on to the interviewsand group discussions. The data collected during the investigation has been calculated by using SPSS software.
Results and Discussion
Physio-chemical water quality
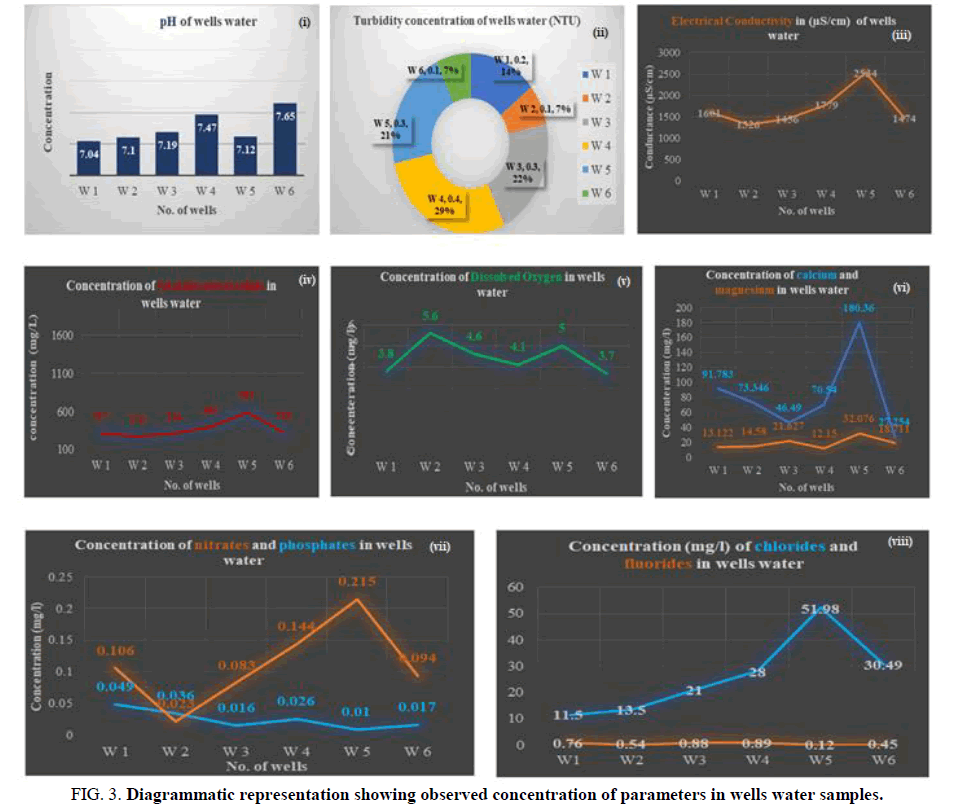
The data presented in Figure 3 (i) showed that well no. 1 has the lowest pH (7.04) whereas well no. 6 has the highest pH (7.65). The observed turbidity Figure 3 (ii) of well no. 6 and well no. 2 has the lowest concentration (0.1 NTU) whereas well no. 4 has the highest turbidity (0.4 NTU). The data in Figure 3 (iii) showed that well no. 2 has lowest conductance (1326 μS) whereas, well no. 5 has highest conductance (2534 μS) both of which are within the (IS 10500) BIS allowed limits. The present study revealed that well no. 2 has the lowest TDS (276 mg/L) and well no. 5 has the highest TDS (593 mg/L) Figure 3(iv). The data presented in Figure 3(v) shows that well no.1 has minimum dissolved oxygen (3.8 mg/L) whereas well no. 2 has maximum concentration of dissolved oxygen (5.6 mg/L). It has been observed that well no. 6 has minimum concentration of calcium (27.254 mg/L) and well no. 5 has maximum concentration (180.36 mg/L) whereas, concentration of magnesium for well no. 4 has found to be minimum (12.15 mg/L) and maximum for well no. 5 (32.076 mg/L) Figure 3 (vi). It has been found that well no. 2 has minimum nitrate concentration (0.08 mg/L) and well no. 5 has maximum concentration (5.20 mg/L). The data presented in Figure 3 (vii) shows that well no. 5 has minimum phosphate concentration (0.0145 mg/L) and well no. 1 has maximum concentration (0.0710 mg/L). The data presented in Figure 3 (viii) shows that well no. 1 has minimum chloride concentration (11.50 mg/L) and well no. 5 has maximum chloride concentration (51.98 mg/L) whereas, chloride concentration detected for well no. 1 has minimum (11.50 mg/L) and has maximum (51.98 mg/L) for well no. 5. Thus, the wells water samples for parameters like pH, turbidity, electrical conductivity, total dissolved solids, dissolved oxygen, calcium, magnesium, nitrates, phosphates, chlorides and fluorides were detected all within the permissible range as prescribed for drinking water by the BIS (IS 10500) (2012). In the present investigation, the calculated WQI of wells has been found to be 27.712 which rated under good water quality category (Figure 3).
FIG 3: Diagrammatic representation showing observed concentration of parameters in wells water samples.
Perceptions of local people on wells water quality
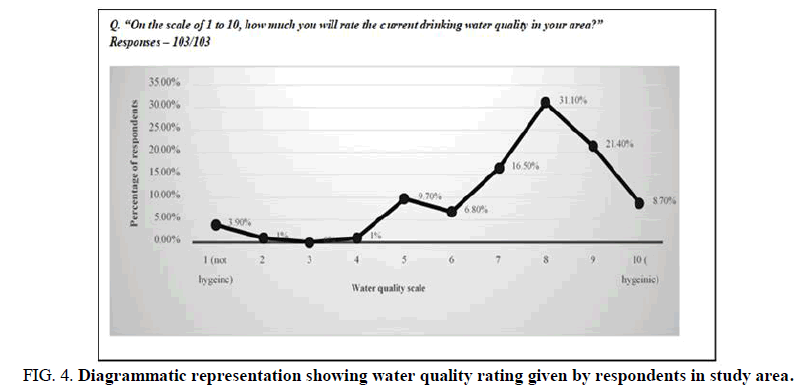
In the present study, a household survey for local people has also conducted to know about the perceptions regarding the wells water quality and their management in selected area. According to survey reports, out of 103 respondents, maximum section (25%) of participants in the survey were from age of 30-42 years and were mostly female (56%) and around (44%) male respondents who interviewed during the survey (Table 3 and Figure 4).
| Questions | Responses of respondents (frequency) | Percentage | Mean and standard deviation |
|---|---|---|---|
| Q. What type of well in your area? | |||
|
54 | 52.4 | Mean=51.5 S.D.=3.535534 |
|
49 | 47.6 | |
| Q. What is approx. depth of well in your area? | 100 | 100% | M=16.6666 S.D.=11.4134 |
|
18 | 17.5 | |
|
26 | 25.2 | |
|
33 | 32.0 | |
|
9 | 8.7 | |
|
12 | 11.7 | |
|
2 | 1.9 | |
| Q. Are the wells caged/covered? | 103 | 100 | M=34.3333 S.D.=34.53018 |
|
74 | 71.8 | |
|
18 | 17.5 | |
|
11 | 10.7 | |
| Q. Is the water quality of wells checked time to time? | 103 | 100% | M=34.3333 S.D.=14.64013 |
|
32 | 31.1% | |
|
50 | 48.5% | |
|
21 | 20.4% | |
| Q. What is the frequency of cleaning well in your area? | 103 | 100% | M=20.6 S.D.=6.80441 |
|
21 | 20.4% | |
|
19 | 18.4% | |
|
26 | 25.2% | |
|
10 | 9.7% | |
|
27 | 26.2% | |
| Q. How does the water smell? | 103 | 100 | M=25.75 S.D.=36.9808 |
|
81 | 79.6 | |
|
5 | 4.85 | |
|
5 | 4.85 | |
|
12 | 10.7 | |
| Q. How does the water look like? | 103 | 100 | M= 25.75 S.D.=33.7478 |
|
76 | 73.8 | |
|
14 | 14.6 | |
|
4 | 3.8 | |
|
9 | 7.8% | |
| Q. Do you pay any fee/charges for maintenance of the well in your area? | 103 | 100% | M=34.3333 S.D.=29.5177 |
|
35 | 34% | |
|
50 | 48.5% | |
|
18 | 17.5% | |
| Q. Have you heard about different water quality parameters/WQI (Water Quality Index)? | M=34.3333 S.D.=27.0246 |
||
|
65 | 63.1 | |
|
24 | 23.3 | |
|
14 | 13.6 | |
| Q. In previous question you said yes then in what way? | |||
|
18 | 18.4 | M=26 S.D.=7.83308 |
|
6 | 6.1 | |
|
7 | 7.1 | |
|
4 | 4.1 | |
|
13 | 13.3 | |
|
18 | 18.6 | |
|
26 | 25.9 | |
|
6 | 6.5 | |
| Q. Is there any awareness program held in your area regarding water quality/water pollution/water conservation and protection? | M=34.33333 S.D.=21.96208 |
||
|
48 | 46.6 | |
|
46 | 44.7 | |
|
9 | 8.7 | |
| Q. If you said yes in previous question, then by whom? | M=11.625 S.D.=8.07000 |
||
|
12 | 12.8 | |
|
4 | 4.3 | |
|
4 | 4.3 | |
|
12 | 12.9 | |
|
14 | 15.4 | |
|
12 | 12.9 | |
|
6 | 6.5 | |
|
29 | 30.9 | |
| Q. Does any govt. organization fund or any other assets for cleaning and maintenance of the ground water sources/wells in your area? | M=34.3333 S.D.=15.9478 |
||
|
21 | 20.4 | |
|
30 | 29.1 | |
|
52 | 50.5 | |
| Q. Does govt. provide any equipment/kit/tools for cleaning and maintenance of wells? | M=34.3333 S.D.=20.2566 |
||
|
18 | 17.5 | |
|
57 | 55.3 | |
|
28 | 27.2 | |
| Q. Is govt. providing any trained personal for maintenance of wells? | M=34.3333 S.D.=20.2566 |
||
|
19 | 18.4 | |
|
58 | 56.3 | |
|
26 | 25.2 | |
| Q. Overall, do you think hygienic conditions around your wells are maintained? | M=34.33333 S.D.=20.55075 |
||
|
58 | 56.3 | |
|
24 | 23.3 | |
|
21 | 20.4 | |
| Q. On the scale of 1 to 10, how much you will rate the current drinking water quality in your area? | 103 | 100% | M=10.7 S.D.=10.45679 |
|
4 | 3.9% | |
|
1 | 1% | |
|
0 | 0% | |
|
1 | 1% | |
|
10 | 9.7% | |
|
7 | 6.8% | |
|
17 | 16.5% | |
|
32 | 31.1% | |
|
22 | 21.4% | |
|
9 | 8.7% | |
TABLE 3. Tabular representation showing the responses gathered from respondents during field survey.
In the field survey, respondents were asked different questions regarding to wells water quality and few of them discussed here (Table 3). In the present investigation the respondents were asked about the type, coverage and depth of wells. According to the survey findings, it has been revealed that the maximum respondents said there were dug well (52.4%) and minimum respondents said tube well (47.6%) category with calculated mean (51.5) and standard deviation (3.5355). The maximum thirty three respondents (32.0%) reported that the wells in area have around 600 ft. depth whereas there were very few respondents (1.9%) who have not idea about the well’s depth with calculated standard deviation (11.4134). It has been observed that about seventy four (71.8%) respondents said “yes” that the water wells in selected area covered and eighteen (17.5%) respondents said “no” and other eleven (10.7%) respondents have no idea with calculated mean (34.333) and standard deviation (34.53018). The respondents were asked about the cleaning frequency of wells and according to responses it has been found that the maximum respondents were having no idea about this (26.2%) and minimum respondents (9.7%) said that the wells were not clean in last year with calculated mean (20.6) and standard deviation (6.80441). The survey results showed that the maximum respondents (79.6 %) were agreed that there was no smell in wells water whereas, only 4.85 % respondents said there was foul smell in well water with calculated mean (25.75) and standard deviation (36.9808). It has been observed that maximum respondents said that water of wells was clear (73.8%) and very few around 3.8% respondents said that the water of wells was dirty (3.8 %) with calculated mean (25.75) and standard deviation (33.7478). The respondents were asked regarding to maintenance fee and according to findings it has been found that the maximum respondents were agreed that they do not pay fees for maintenance of wells (48.5%) and very few respondents who have no idea about (17.5%) with calculated mean (34.3333) and standard deviation (29.5177). According to present study it has been revealed that about sixty five (63.1%) respondents know about water quality parameters and WQI and twenty four (23.3 %) respondents did not know and fourteen (13.6%) respondents have no idea with calculated mean (34.3333) and standard deviation (27.0246). During the investigation the respondents have questioned on “is there any awareness program held in their area regarding water quality/water pollution/water conservation and protection?” and according to the respondent’s perceptions, most of the (46.6%) participants said “yes” and around 44.7% respondents said “no” and 8.7% respondents have no idea with calculated mean (34.3333) and standard deviation (21.9621). The respondents who have idea about “awareness programmes” were furthur interrogated that where they perceived about it. According to responses, it has been found that there were 12.8% respondents who heard from local groups, 4.3% respondents said civil societies, 12.9% respondents said educational institutes, 15.4% respondents said Mahila mandals who held awareness programme for selective period of time, 12.9% respondents said other govt. organisations carry out awareness programme, 30.9% respondents chose that there were no awareness programme and only very few about 6.5% respondents said all these aove said organisations held awareness programme in area. During investigation period, the respondents were futhur interrogated on “is there any govt. organization fund or any other assets for cleaning and maintenance of the ground water sources/wells in their area?” The survey findings showed that around 50.5% respondents have no idea, 20.4% respondents said “yes” and 29.1% people said “no” with calculated mean (20.6) and standard deviation (16.0717). The respondents were further asked regarding trained personal in study area from government’s side. It has been observed that maximum (56.3%) respondents were disagreed and around 18.4% respondents were agreed with calculated mean (18.83333) and standard deviation (22.78961). In last of the survey questionnaire, the respondents were asked to give water quality rating from 1 (unhygienic) to 10 (hygienic). According to results, it has been observed that mostly people recommended “8” rating on water quality scale (hygienic) with percent with calculated mean (18.83333) and standard deviation (22.78961) [6].
Conclusion
Therefore, it has been concluded from the present study that quality of wells water in selected study area was satisfactory and found to be fit for drinking purpose. Although all the physio chemical parameters were within permissible standard limit and calculated WQI of wells rated under good water quality category. According to survey findings responses of participants towards water quality status of wells and their maintenance was found to be satisfactory.
References
- APHA. Standard methods for the examination of waters and wastes water. Washington DC, 21st edition, United States, 2012;161.
- Supriya K, Chauhan CR, Singh B. Water quality of freshwater pond ecosystem under sub-temperate conditions of Palampur, Himachal Pradesh. Ind J Ecol. 2018;45(4):774-777.
- Supriya K, Aggarwal RK. Impact of land uses on air and water quality-a review. Curr World Environ. 2018;13(1):11-21.
- Supriya K, Chauhan CR, Singh B. Seasonal abundance of cladocerans and their relation to physicochemical parameters of pond ecosystem in Palampur, Kangra (HP). Curr World Environ. 2018;13(3):445-455. [ Google Scholar ]
- Supriya K, Aggarwal RK, Bhardwaj SK. Socioeconomic impacts of land use changes in low hills of Himachal Pradesh. Int J Chem Stud. 2019;7(2):589-595.
- Supriya K, Aggarwal RK. Threat to water resources due to land use change of low hills of North-West Himalayas. Int J Sci Res. 2021;11(5):643-656.
