Review
, Volume: 12( 11)Tide Gauges Show No Sign of Carbon Driven Acceleration of Sea-Level Rise
- *Correspondence:
- Parker A , School of Engineering and Physical Science, James Cook University, Townsville QLD 4811, Australia, E-mail: albert.parker.2014@gmail.com
Received: June 28, 2016; Accepted: November 26, 2016; Published: November 30, 2016
Citation: Parker A. Tide Gauges Show No Sign of Carbon Driven Acceleration of Sea-Level Rise. Environ Sci Ind J. 2016;12(11):124.
Abstract
There are new studies claiming the sea levels have been accelerating over the 20th century where they rose faster than in any of the 27 previous centuries. This acceleration is wrongly linked to the increased carbon dioxide emission. We show how the very scattered and poor quality tide gauge information from the 19th century, and the much more extensive and better quality tide gauge information from the 20th century may suggest slower sea level rises in the 1800s than in the 1900s, but a clear change of slope at the end of the 1800s, and then constant sea level rises all over the 1900s. This change of slope has therefore nothing to do with the increasing carbon dioxide emission.
Keywords
Sea level; Carbon dioxide emission; Ice; Gauges; Acceleration; Oscillations
The Tide Gauges Show No Sign of Acceleration of Sea-level Rise Since the 1900
Kopp [1] suggests an increasing acceleration of sea-level rise. They claim global sea-level rose faster in the 20th century than in any of the 27 previous centuries by about 14 cm. The study compiled a new database including 24 locations around the world of geological sea-level indicators from marshes, coral atolls and archaeological sites that spanned the last 3,000 years. The analysis also picked 66 tide gauges from the last 300 years. The reconstructed global sea-levels were then correlated to reconstructed global temperatures.
Mengela [2] utilizes a similar semi empirical method to produce uncertainty ranges for the sea-level rise by 2100 projected to 28 cm -56 cm, 37 cm -77 cm, and 57 cm -131 cm for the greenhouse gas scenarios RCP26, RCP45 and RCP85. As one of the authors had previously published estimates of up to 2 m sea-level rise by 2100, the latest higher emission estimates are 50% lower. However, these estimates are still excessive, as the tide gauges show no sign of acceleration as sea-levels rose and fell at about the same rate in the first and second halves of the 20th century.
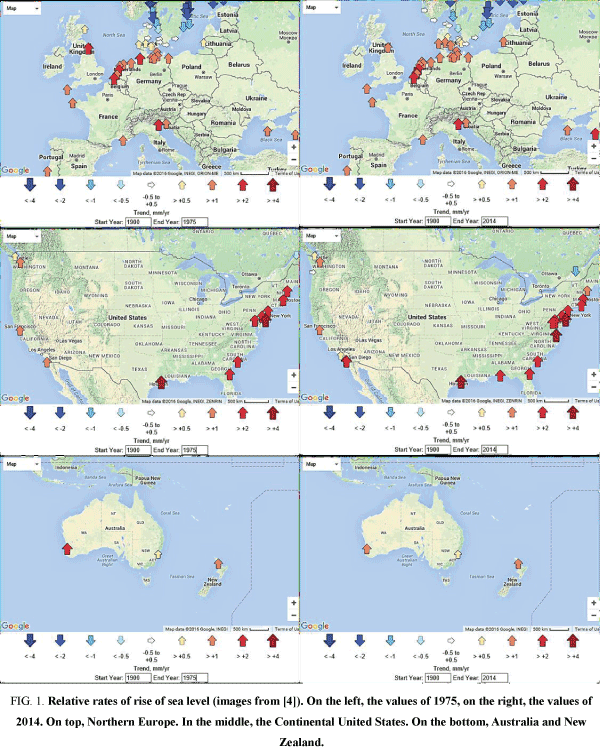
If we consider the latest (23-Feb-2016) relative mean sea-level trends from PSMSL [3], there are listed 722 tide gauges, of naïve average relative rate of rise +1.38 mm/year. However, only 2 of these tide gauges started their recording before the year 1840, and only 72 have their recording started before the year 1900. Most of them are in Northern Europe, some in North America and very few in the southern hemisphere. Using only these most reliable, older, 72 tide gauges, the naïve average relative rate of rise is -0.62 mm/year. This does not mean the sea-level has declined during the 20th century, but simply that there are not enough data to compute any accurate global mean sea-level over the 20th century. It is not helpful to stack tide gauges of unequal length, and sometimes insufficient quality, especially if cherry-picked to enhance an alleged global rise. If the interest is to check any acceleration of the rise of sea-levels over the second part of the 20th century this may be easily done by using the PSMSL online facility, Figure 1 [4].
Figure 1: Relative rates of rise of sea level (images from [4]). On the left, the values of 1975, on the right, the values of 2014. On top, Northern Europe. In the middle, the Continental United States. On the bottom, Australia and New Zealand.
The start date cannot be placed earlier than 1900 and the last update is 2014. As 60-70 years of data are a minimum to infer reliable trends [5-10], it may be interesting to compare the relative rates of rise computed with data up to 1975 and up to 2014. Results computed with the same method in the same locations and considering only the addition of new measurements show there is no apparent sign of acceleration.
A more accurate assessment may be obtained by the analysis of the individual tide gauges. We already did this for the longest tide gauges, and all have small oscillations either positive or negative cancelling each other out in the naïve average [7-10].
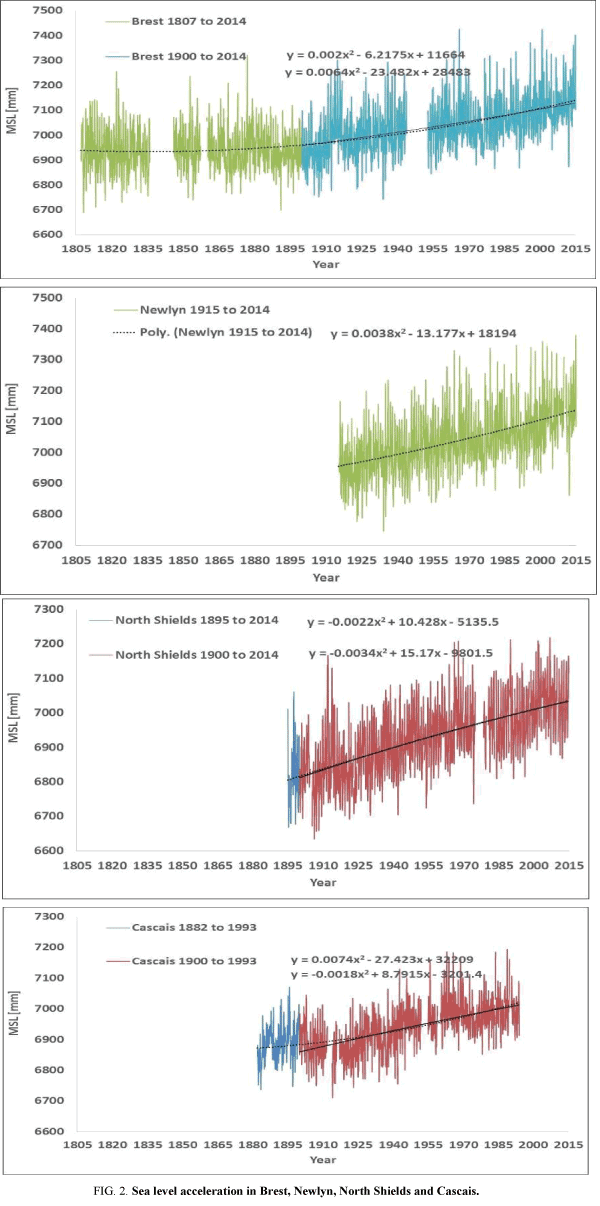
While the very scattered and poor quality tide gauge information from the 19th century may suggest an acceleration since the 1800s, the much more extensive and better quality tide gauge information from the 20th century shows a clear lack of acceleration since 1900. There is a clear change of slope in the sea level rise at the end of the 1800s, and then constant sea level rises all over the 1900s. Figure 2 shows the monthly averaged mean sea levels measured in three long term sample locations, Brest, Cascais, North Shields and Newlyn and their parabolic fitting. Considering the data collected since 1807 in Brest or since 1882 in Cascais, there is a positive acceleration of respectively +0.0128 and +0.0148 mm/y2. However, considering the data collected since 1900, the acceleration reduces to +0.0040 and -0.0036 mm/y2 in Brest and Cascais. In Newlyn, the data since 1915 indicate a sea level acceleration of +0.0076 mm/y2. In North Shields, the data since 1900 indicate a sea level acceleration of -0.0068 mm/y2, and the data since 1895 a sea level acceleration of -0.0044 mm/y2.
The rise of sea-level has therefore not accelerated during the 20th century following the carbon dioxide emission that is conversely exponentially growing. So the modelled rise of 1 m by 2100 linked to the carbon dioxide emission is still implausible.
Conclusion
The sea levels possibly started to rise faster at the end of the 1800s, but then there has been no sign of sea level acceleration that could be coupled to the anthropogenic carbon dioxide emission. It is therefore not correct to link sea level rises by 2100 to the future carbon dioxide emissions as the parameter appears in influent.
References
- Kopp RE (2016) Temperature-driven global sea-level variability in the Common Era. PNAS 113: 1434-1441.
- Mengela M (2016) Future sea-level rise constrained by observations and long-term commitment. PNAS 113: 2597-2602.
- http://www.psmsl.org/products/trends/trends.txt
- http://www.psmsl.org/products/trends/
- Iyengar RN (2009) Monsoon rainfall cycles as depicted in ancient Sanskrit texts. Current Science 97: 444-447.
- Schlesinger ME, Ramankutty N (1994) An oscillation in the global climate system of period 65-70 years. Nature 367: 723-726.
- Parker A (2013) Oscillations of sea-level rise along the Atlantic coast of North America north of Cape Hatteras. Natural Hazards 65: 991-997.
- Parker A (2013) Sea-Level Trends at Locations of the United States With More than 100 Years of Recording. Natural Hazards 65: 1011-1021.
- Parker A, Saad Saleem M, Lawson M (2013) Sea-Level Trend Analysis for Coastal Management. Ocean & Coastal Management 73: 63-81.
- Parker A, Ollier CD (2016) Coastal Planning Should Be Based On Proven Sea-Level Data. Ocean and Coastal Management 124: 1-9.


