Original Article
, Volume: 19( 1) DOI: 10.37532/0974-7419.2019.19(1).140Naked-Eye Chemical Colorimetry for the Rapid Determination of Copper(â ¡), Cadmium(â ¡) and Lead(â ¡) in Chinese Crude Drugs
- *Correspondence:
- Limei L College of Pharmacy, Hunan University of Chinese Medicine, Changsha, 410208, China, Tel: 073188458230; E-Mail: lizasmile@163.com
Received: November 08, 2018; Accepted: November 22, 2018; Published: December 02, 2018
Citation: Limei L, Yan L, Yi C, et al. Naked-Eye Chemical Colorimetry for the Rapid Determination of Copper(Ⅱ), Cadmium(Ⅱ) and Lead(Ⅱ) in Chinese Crude Drugs. Anal Chem Ind J. 2019;19(1):140
Abstract
A naked-eye chemical colorimetry method was developed for the rapid determination of Cu2+, Cd2+ and Pb2+ ions in Chinese crude drugs. Determinations of Cu2+, Cd2+ and Pb2+ were performed using copper reagentï¼Ã‚ˆDDTC, diethyl dithiocarbamateï¼Ã‚‰, cadion (P-nitrophenyl diazonium amino azobenzene) and xylenol orange, respectively, as colorimetric reagents. At pH 6, an orange-red or purple-red complex compound was obtained with the reaction between Pb2+ and xylenol orange; the reaction was linear with the concentration of Pb2+ in the range of 0.2~10.0 mg.L-1, and the detection limit was 0.2 mg.L-1. At pH 10, an orange-red complex compound was obtained with the reaction between Cd2+ and cadion; the reaction was linear with the concentration of Cd2+ in the range of 0.1 ~ 5.0 mg.L-1, and the detection limit was 0.1 mg.L-1. At pH 10, a brown-yellow complex compound was obtained with the reaction between Cu2+ and DDTC; the reaction was linear with the concentration of Cu2+ in the range of 0.5 ~ 10.0 mg.L-1, and the detection limit was 0.5 mg.L-1. The detection limits of Cu2+ and Pb2+ meet the Chinese Pharmacopoeia limit standards for copper and lead levels in Chinese crude drugs, but the detection limit of Cd2+ did not meet the standard, indicating that there is a certain gap compared with the Chinese Pharmacopoeia guideline. In addition, the method was successfully applied to detect trace amounts of Pb2+, Cd2+, and Cu2+ ions in eight types of Chinese crude drugs (a total of 80 batches) with satisfactory results. The tested drugs were Paeoniae radix alba, Glycyrrhizae radix et Rhizoma, Astragalus membranaceus, Salviae miltiorrhizae radix et rhizom, Panacis quinque folii radix, Crataegi fructus and Lonicerae japonicae flos. The results were compared with those using the traditional atomic absorption spectroscopy (AAS) method and showed good agreement.
Keywords
Naked-eye chemical colorimetry; Rapid determination; Cu2; Cd2+; Pb2; Chinese crude drugs
Introduction
Heavy metals typically refer to a class of metal elements with a specific gravity greater than 5. There are approximately 45 heavy metals, such as lead, cadmium, copper, mercury, iron, and chromium that are present as contaminants in traditional Chinese medicine. In recent years, excessive amounts of heavy metals in Chinese medicine have become a popular topic in the international pharmaceutical market, which has not only damaged the reputation of Chinese medicine but also affected the export of Chinese herbs and Chinese patent medicine, causing great economic losses. After the British drug administration issued a warning regarding the risk of toxicity of traditional Chinese medicine, it was reported that the British FDA was planning a total ban on the sale of proprietary Chinese medicines in the UK starting at the beginning of 2014. The United States, Canada, Japan, and other countries have also promulgated a series of regulations on the prohibition of the import of Chinese medicine [1]. Excessive amounts of heavy metals have become a major factor restricting Chinese traditional medicine enterprises into the international market. Therefore, the detection of the levels of heavy and transition metal ion contamination in Chinese herbal medicines has become a significant and pressing issue due to the toxicity of metal ions to human health.
Among various heavy metal ions, copper, cadmium, and lead are three important toxic heavy metal ions. Although copper plays an essential role in many biological processes in humans, exposure to a high level of copper, even for a short period, can cause gastrointestinal disturbance, while long-term exposure can cause liver or kidney damage and even serious neurodegenerative diseases [2-4]. Cadmium is also an extremely toxic and carcinogenic metal, which is usually absorbed into the body from dietary sources and cigarette smoking. A high exposure level of cadmium is associated with increased risks of cardiovascular diseases, cancer mortality, and damage to the liver and kidneys [5]. Lead is one of the most toxic metals associated with damage to humans and the environment because of its non-degradability and accumulation [6]. Even very low levels of lead exposure can cause neurological, reproductive, cardiovascular, and developmental disorders, which introduce particularly serious problems in children, including slowed motor responses, decreased IQs, and hypertension [7]. Lead pollution is a persisting problem and a long-lasting danger to human health and the environment, as the 300 million tons of lead mined to date are still circulating mostly in soil and groundwater [8]. Because of the important roles of Cu2+, Cd2+, and Pb2+ in human health and the environment, the development of a facile and rapid method for the detection of these three metal ions in Chinese crude drugs has attracted a substantial amount of attention.
Currently, China has gradually improved the analysis methods and standards for Chinese herbal medicines and proprietary Chinese medicines for determining and limiting the pesticides and heavy metal residues. However, the research on on-site analysis methods to determine the drug safety and early warning events are insufficient, thus necessitating the further development of sensitive, selective, and reliable analytical techniques for the determination of harmful residues in Chinese medicine. Traditional methods rely on high-performance lab instruments, such as Atomic Absorption Spectrometry (AAS) [9], inductively coupled plasma mass spectrometry (ICP-MS) [10] and other electrochemical and optic methods. However, these traditional detection methods are less practical for rapid analysis because of the requirement of complex processes and expensive instruments. Thus, the need remains for the development of rapid, sensitive, and highly selective Cu2+, Cd2+ and Pb2+ determination methods with relatively low costs. In contrast, the colorimetric determination based on color changes in response to metal ions has been widely used in many fields due to its simple, observable and fast detection [11-14]. To date, some rapid colorimetric methods of heavy metals using a test strip or a test kit have been reported, but these methods are mostly for the on-site detection of heavy metals in environmental water samples or vegetable agricultural products; there are rarely any reports on these methods regarding Chinese herbs [15-17].
In this paper, we report a rapid, highly selective and sensitive method for Cu2+, Cd2+ and Pb2+ determination based on the chemical colorimetric reactions of metal chelate precipitation combined with the characteristics of Chinese medicinal components. The chelate reagent was reacted with stock solutions of Cu2+, Cd2+, and Pb2+ in centrifuge tubes for five minutes, and then, the reaction solutions were transferred using a pipette to the wells of a white spot plate, which was then placed into a photography box to obtain images. The color changes in the well were captured by a cellular phone and then digitized into the standard colorimetric cards. The sample solutions were transferred to a centrifuge tube. Buffered solutions, masking agent solutions, and chromogenic agent solutions were subsequently added and shaken. Clear colors of the complex compound could be observed with the naked eye. After comparing the colors with the standard colorimetric plates, we can easily quantitatively determine the Cu2+, Cd2+ and Pb2+ levels in one to ten minutes simply based on the colorimetric analysis. The method was successfully applied to Chinese crude drugs for detecting Cu2+, Cd2+, and Pb2+. In addition, a variety of methods was analyzed and compared to select the best procedure for the sample pretreatment in our study.
Materials and Methods
Plant materials
The eight types of Chinese herbal medicines used in the experiment were Paeoniae radix alba, Glycyrrhizae radix et Rhizoma, Astragalus membranaceus, Salviae miltiorrhizae radix et rhizoma, Panacis quinque folii radix, Lycii fructus, Crataegi fructus, and Lonicerae japonicae flos. These drugs were collected from different provinces of China, including Anhui, Sichuang, Shangdong, Henan, and Hebei, and were authenticated by Professor Liming Gong of the Department of Pharmacognosy, Hunan University of Chinese Medicine. The samples were powdered to a homogeneous size in a pulverizer and then passed through a 60-mesh sieve.
Apparatus
The T-214 electronic analytical balance used in this study was obtained from Denver Instrument Company (USA). The KQ-500DE ultrasonic cleaner was obtained from Kunshan Ultrasonic Instrument Co., Ltd. (China). The P20-Y-type ultrapure water meter was from Colton Water Co. (China). The LED photography box was purchased from Saijue Electronics Co., Ltd. (China). The DB-XB-type electric board was obtained from Bangxi Instrument Co., Ltd. (Shanghai, China), and the SZ-500A-3-type pure powder machine was purchased from Shanzhu Trade Co., Ltd. (China). The TAS-990 atomic absorption spectrophotometer was obtained from Beijing Purkinje General Instrument Co., Ltd. (Beijing, China).
Chemicals and reagents
Nitrate, lead powder, cadmium powder, copper powder, xylenol orange, cysteine, thiourea, sodium acetate, potassium hydroxide, sodium citrate, perchloric acid, ammonia water, sodium fluoride, potassium sodium tartrate, Ethylene diamine Tetra-Acetic Acid (EDTA), sodium bicarbonate and sodium carbonate were obtained from Sinopharm Chemical Reagent Co. Ltd. (Shanghai, China). Diethyl dithiocarbamate (DDTC, Copper Reagent) was from Jinshan Ting New Chemical Reagent Factory (Shanghai, China). P-nitrophenyl diazonium amino azobenzene (Cadion) was purchased from Tianjin Guangfu Fine Chemical Research Institute Co. Ltd. (Tianjin, China); ethanol was from Anhui Andrew Foods Co. Ltd. (Anhui, China). Nitrate, perchloric acid, ammonia water, lead powder, cadmium powder, and copper powder were guaranteed reagents, and all other reagents were of analytical grade and were used as received without further purification. Deionized water was prepared using the P20-Y-type ultrapure water meter.
Preparation of sample solutions
Chinese herbal medicine (1.0 g powder) was weighed accurately, added to a 50-mL glass flask and soaked with HNO3-HClO4 (4:1, v/v) for 24 h. Then, the glass flask was placed on an electric hot plate for heated digestion; the solution was maintained under a micro-boiling condition, and if the sample solution becomes brown-black, then an appropriate amount of HNO3-HClO4 (4:1, v/v) was added until the digestion solution became colorless or slightly yellow. The solution was then cooled to room temperature. The pH of the solution was adjusted to 5 using strong ammonia water, and then it was filtered through a 0.22-μm organic membrane. The filtrate was transferred to a 10-mL capacity bottle, diluted with deionized water to the calibration line and shaken.
Preparation of the other solutions
Stock solutions of lead, cadmium and copper (1000 mg.L-1) were prepared in a nitrate solution (1:1, v/v). Stock solutions of lead and copper were diluted with deionized water to eight different concentrations (0.1 mg.L-1, 0.2 mg.L-1, 0.5 mg.L-1, 1 mg.L-1, 2 mg.L-1, 5 mg.L-1, 10 mg.L-1 and 100 mg.L-1). Stock solutions of cadmium were diluted with deionized water to eight different concentrations (0.01 mg.L-1, 0.03 mg.L-1, 0.05 mg.L-1, 0.1 mg.L-1, 0.2 mg.L-1, 0.5 mg.L-1, 1 mg.L-1, 5 mg.L-1, 10 mg.L-1 and 100 mg.L-1). Stock solutions were stored at 4℃ in the dark.
The chromogenic agent solutions were xylenol orange (1 mg.mL-1), 0.05% cadion and 0.5% copper reagent. Solutions of xylenol orange (1mg.mL-1) were prepared using 0.1 g of xylenol orange and 100 mL pH 5.5 acetate-sodium acetate buffer solution. The 0.05% cadion solution was prepared using 0.5 g of cadion and 100 mL potassium hydroxide-ethanol solution (0.2 mol.L-1). The 0.5% copper reagent solution was prepared by dissolving 0.5 g of copper reagent in a moderate amount of anhydrous ethanol and then diluting to 100 mL using deionized water.
The masking agent solution of cadmium was prepared by mixing 20.0 g of sodium citrate, 2.0 g of sodium fluoride, 2.0 g of potassium sodium tartrate, 1.0 g of thiourea and 100 mL deionized water. The masking agent solution of lead was prepared by mixing 0.1 g of cysteine, 0.1 g of thiourea and 100 mL sodium acetate (0.2 mol.L-1). The masking agent solution of cadmium was prepared by mixing 20.0g of sodium citrate,5.0 g of EDTA and 100 mL deionized water. Buffer solutions of pH 10 Na2CO3-NaHCO3 (Cu2+ and Cd2+) and pH 5.5 ~ 6 acetate-sodium acetate (Pb2+) were used.
The manufacturing methods of standard colorimetric plates
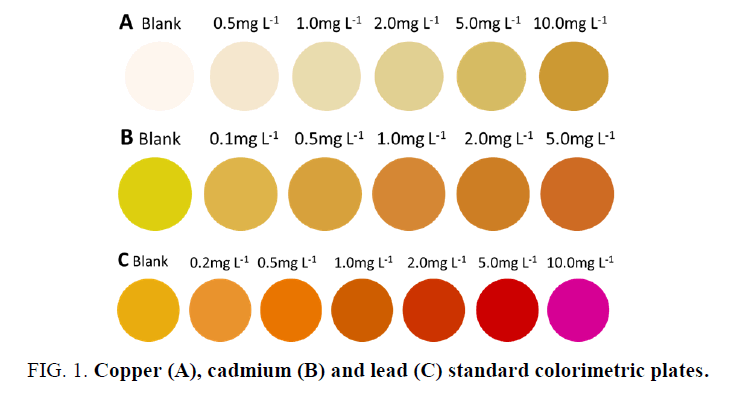
A series of standard concentrations of 1.0 mL Cu2+, Cd2+ and Pb2+ were prepared in 2-mL centrifuge tubes, respectively. The pH was adjusted using 500 μL of a pH 10 Na2CO3-NaHCO3 (Cu2+ and Cd2+) or pH 6 HAc-NaAc (Pb2+) buffered solution followed by the addition of 50 μL of 0.5% copper reagent and cadmium reagent or 100 μL of 1 mg.mL-1 xylenol orange. After reacting for 5 min, 80 μL of the reaction solutions was transferred using a pipette to the wells of a white spot plate, which was then placed in a photography box to obtain images. The images were acquired by a cellular phone. Difference maps were obtained by taking the difference of the average red, green, and blue (RGB) values from the center of each well from the ‘‘before’’ and ‘‘after’’ images. Photoshop CS6 software was used to digitize this color difference to obtain ΔR, ΔG, and ΔB values and to record each color RGB value into the standard colorimetric cards, as shown in FIG. 1.
Procedures of operation
Taking 1mL sample solution for testing in a 2 mL centrifuge tube, 500 μL of a pH 10 Na2CO3-NaHCO3 (Cu2+ and Cd2+) or pH 6 HAc-NaAc (Pb2+) buffered solution was added. Then, 100 μL of the masking agent solution was added followed by the addition of 50 μL xylenol orange (1 mg.mL-1), 100 μL 0.05% cadion and 100 μL 0.5% copper reagent as chromogenic agent solutions. After the reaction was performed at room temperature, the color of the solution was observed and compared with the standard colorimetric plates; then, a judgment was made to determine the concentrations of Cu2+, Cd2+, and Pb2+.
Results and Discussion
The colorimetric response of Cu2+, Cd2+, and Pb2+
In an alkaline environment, Cu2+ reacts with the copper reagent to form a brown and yellow product, and Cd2+ reacts with cadion to form an orange-red product, resulting in a color change in the solution, while the corresponding blank solution is colorless, producing obvious color differences. Under the condition of pH 5~6, an orange-red or rose-red complex compound was obtained with the reaction of Pb2+ and xylenol orange, and the corresponding blank solution was orange-yellow, thus presenting different colors. With the increase in the concentration of Cu2+, Cd2+, and Pb2+, an excellent color gradation was revealed after the reaction. The colorimetric response change between the sample image and the blank image was normally expressed using the Euclidean Distance (ED), which is defined as the following formula:

R, G, and B represent the red, green and blue primary colors, respectively. In this experiment, the color change in the colorimetric response of Cu2+ is mainly caused by the blue (B) channel, and the effect of the other two color channels of red (R) and green (G) is very small; thus, the above formula is simplified to ED=ΔB for optimization of the color reaction conditions. However, in the colorimetric responses of Cd2+ and Pb2+, the red (R) and blue (B) channels showed no significant color change, while the green (G) channel contributed most of the total color change. Therefore, the above formula can be simplified to ED=ΔG and was used for the quantitative analyses throughout this experiment.
Sample pretreatment
The research object is Chinese crude drugs because Chinese herbs contain many pigments and complex chemical components, there are serious interferences in the color reaction. Thus, the pretreatment method of Chinese herbal medicine is very important. Six sample preparation methods [18,19] ultrasonic extraction [20,21], the active carbon enrichment method [22-24], the cotton cellulose xanthate enrichment method [25-27], nano-TiO2 enrichment [28-30], the cloud point extraction method [31-33] and the HNO3-HClO4 digestion method [34,35] were analyzed and compared in this study. The first five methods were unable to exclude the interference of the color reaction in the rapid detection of heavy metals in Chinese medicine; therefore, they were not suitable for the rapid detection of heavy metals in these medicines. The HNO3-HClO4 digestion method is relatively complicated, but it can be prepared to obtain a colorless sample solution; thus, it was chosen as the sample preparation method. This method can exclude the interference of pigment in the results of the color reaction. In addition, in the digestion process of Chinese herbal medicines, the organic compounds are converted to inorganic compounds, thus avoiding the interference between the complex chemical components in Chinese medicine and the chromogenic agents.
The effect of pH
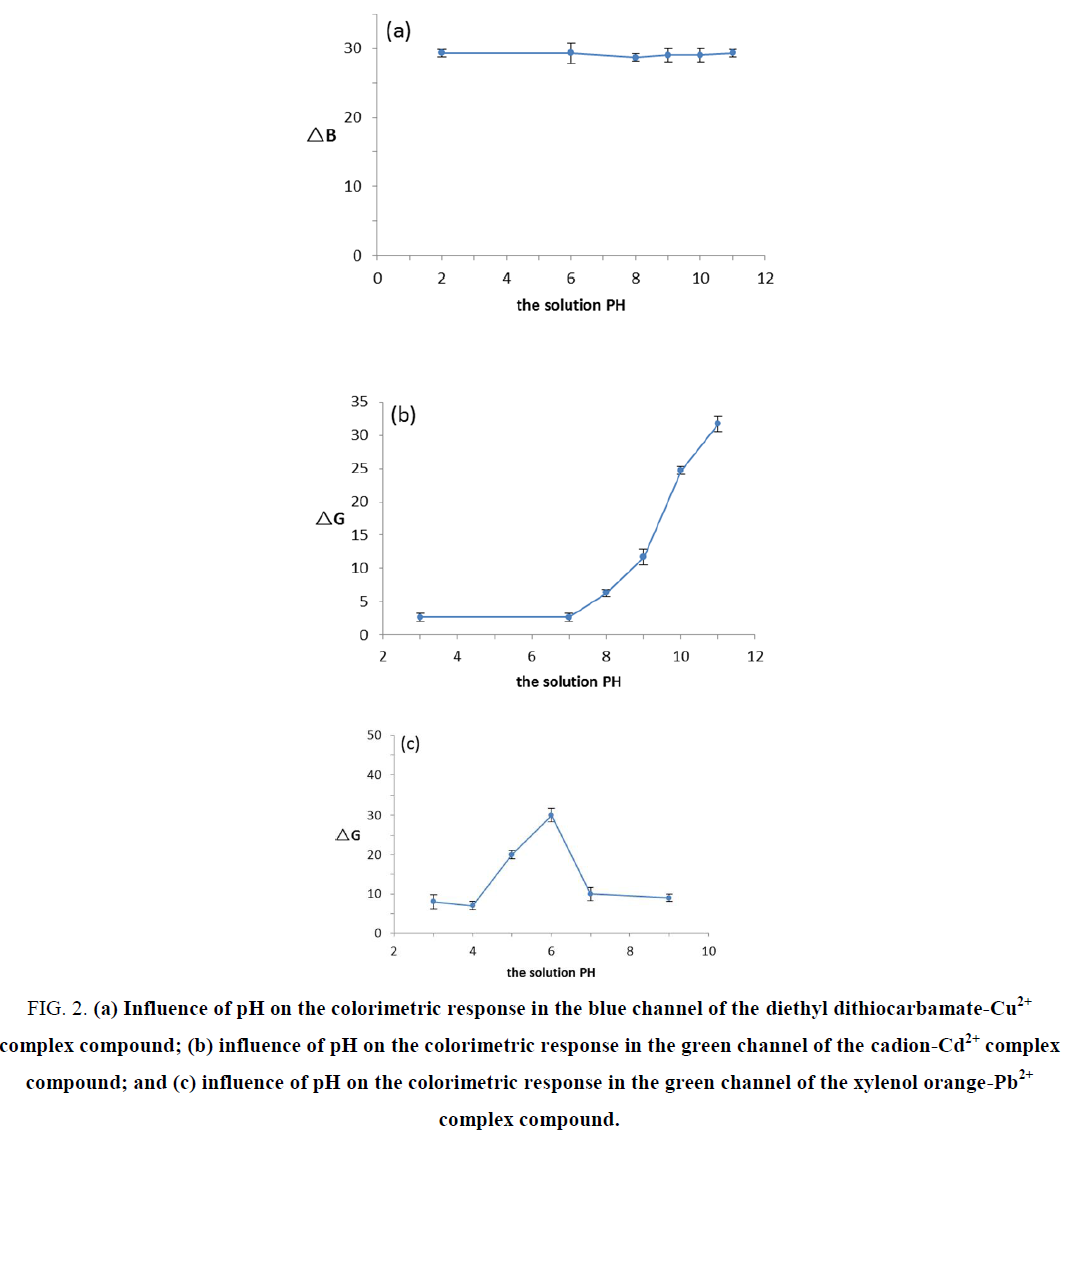
The pH value plays an essential role in colorimetric reactions. Reactions between 1 mg.L-1 copper standard solution and copper reagent were compared under different acid-base conditions at pH 2, 6, 8, 10 and 11. The change in the colorimetric response in the blue channel (ΔB) at various pH values is shown in FIG. 2. No significant effects were found for the colorimetric response of Cu2+ at various pH values. The complex compound formed by Cu2+ and the copper reagent was stable, and considering the later use of masking agents, the pH of the solutions was adjusted to pH 10 for the colorimetric reaction. The reactions between the 1 mg.L-1 cadmium standard solution and cadion were compared under different acid-base conditions at pH 3, 7, 9, 10 and 11. The change in the colorimetric response in the green channel (ΔG) at various pH values is shown in FIG. 2. The results indicate that there were no colorimetric reactions between Cd2+ and cadion under acidic and neutral conditions, while in alkaline solutions, the ΔG values were increased as the pH increased. After the colorimetric reagents were added to the cadmium standard solutions and blank solutions, respectively, the color differences were more pronounced. The alkaline solution is too strong for the metal ions to form a hydroxide precipitate, which reduces the amount of Cd2+ ions available to react with the color reagent, causing the deviation in the color reaction. In this regard, pH 10 was selected as the suitable condition for the color reaction. The reactions between the 1 mg.L-1 lead standard solution and xylenol orange were compared at pH 4, 5, 6, 7 and 9. The change in the colorimetric response in the green channel (ΔG) at various pH values, revealing that the ΔG value was at its maximum at pH 6. The colorimetric response reached its highest level and the most obvious color difference occurred at a pH of approximately 5; these responses decreased as the pH decreased. However, there was no color difference at pH 3, 4, 7 and 9, and the color of the lead standard solution and the blank solution was red at pH 5 and purple-red at pH 9. Therefore, pH 6 was selected as the suitable value for the experiment.
Figure 2. (a) Influence of pH on the colorimetric response in the blue channel of the diethyl dithiocarbamate-Cu2+ complex compound; (b) influence of pH on the colorimetric response in the green channel of the cadion-Cd2+ complex compound; and (c) influence of pH on the colorimetric response in the green channel of the xylenol orange-Pb2+ complex compound.
The volume of chromogenic agents
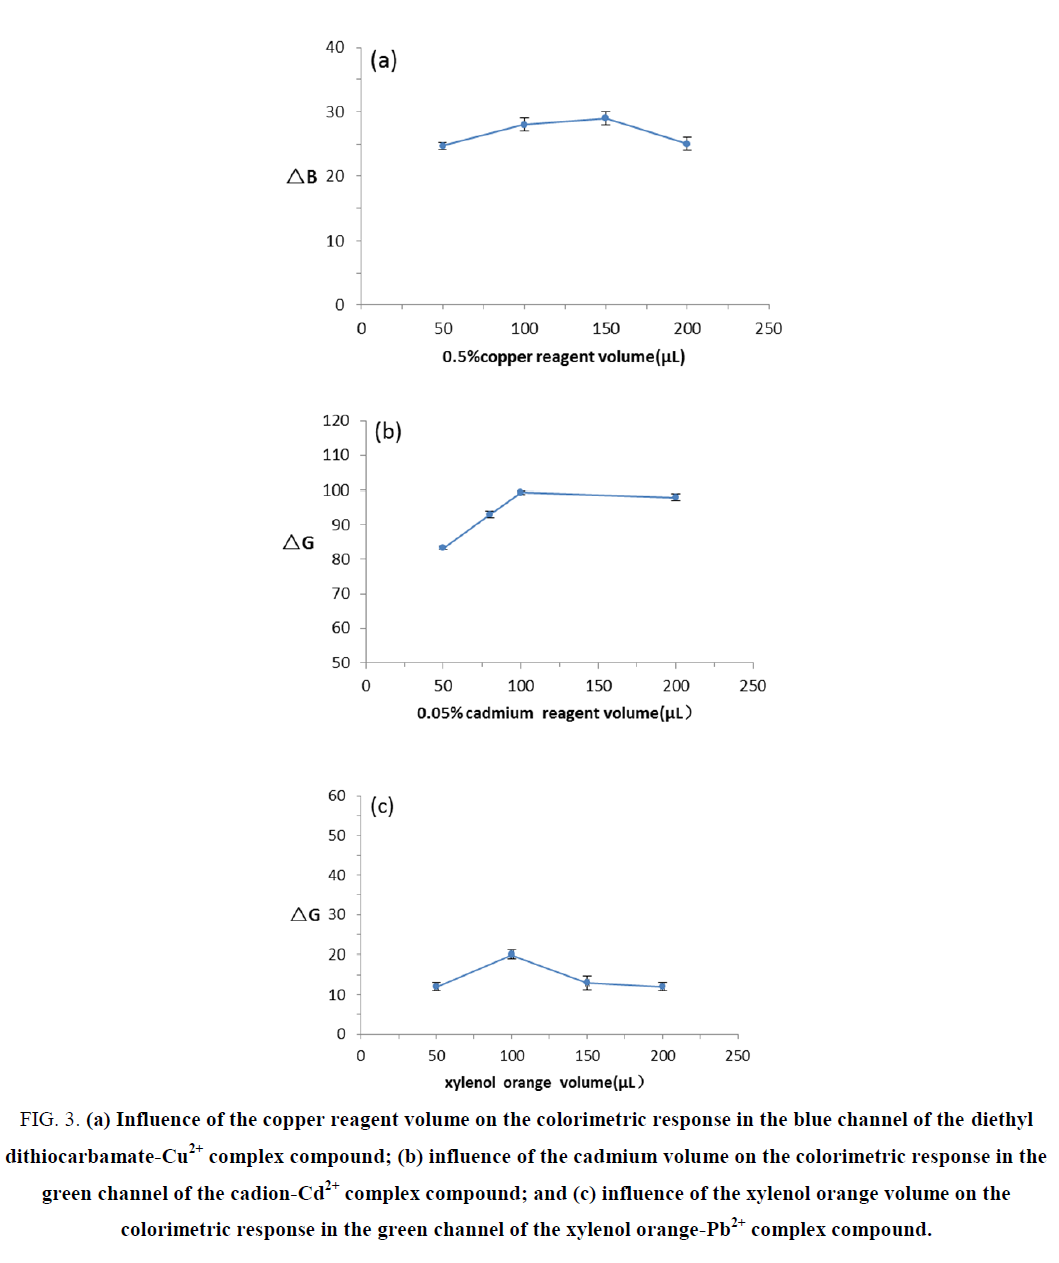
To select an appropriate volume of chromogenic agents, calibration curves were obtained using the plot of colorimetric response against the volume of chromogenic agents from 50 to 200 μL (FIG. 3). The results showed that the volume of chromogenic agents had no significant effects on the reaction between copper standard solutions and copper reagent; thus, 50 μL was selected as an appropriate volume of the 0.5% copper reagent. The colorimetric response was enhanced with increased ΔG values due to the increase in the volume of cadion, and the color differences between cadmium standard solutions and blank solutions became more obvious. The ΔG value was at its maximum when using 100 μL of cadion, which was readily detectable visually. Therefore, 100 μL was selected as an appropriate volume of 0.05% cadion. No obvious changes in the ΔG values were observed with an increased volume of xylenol orange, but the color of the solution gradually deepened; the dark color was not conducive to judgment. Thus, 100 μL was selected as an appropriate volume of xylenol orange.
Figure 3. (a) Influence of the copper reagent volume on the colorimetric response in the blue channel of the diethyl dithiocarbamate-Cu2+ complex compound; (b) influence of the cadmium volume on the colorimetric response in the green channel of the cadion-Cd2+ complex compound; and (c) influence of the xylenol orange volume on the colorimetric response in the green channel of the xylenol orange-Pb2+ complex compound.
The effect of reaction time
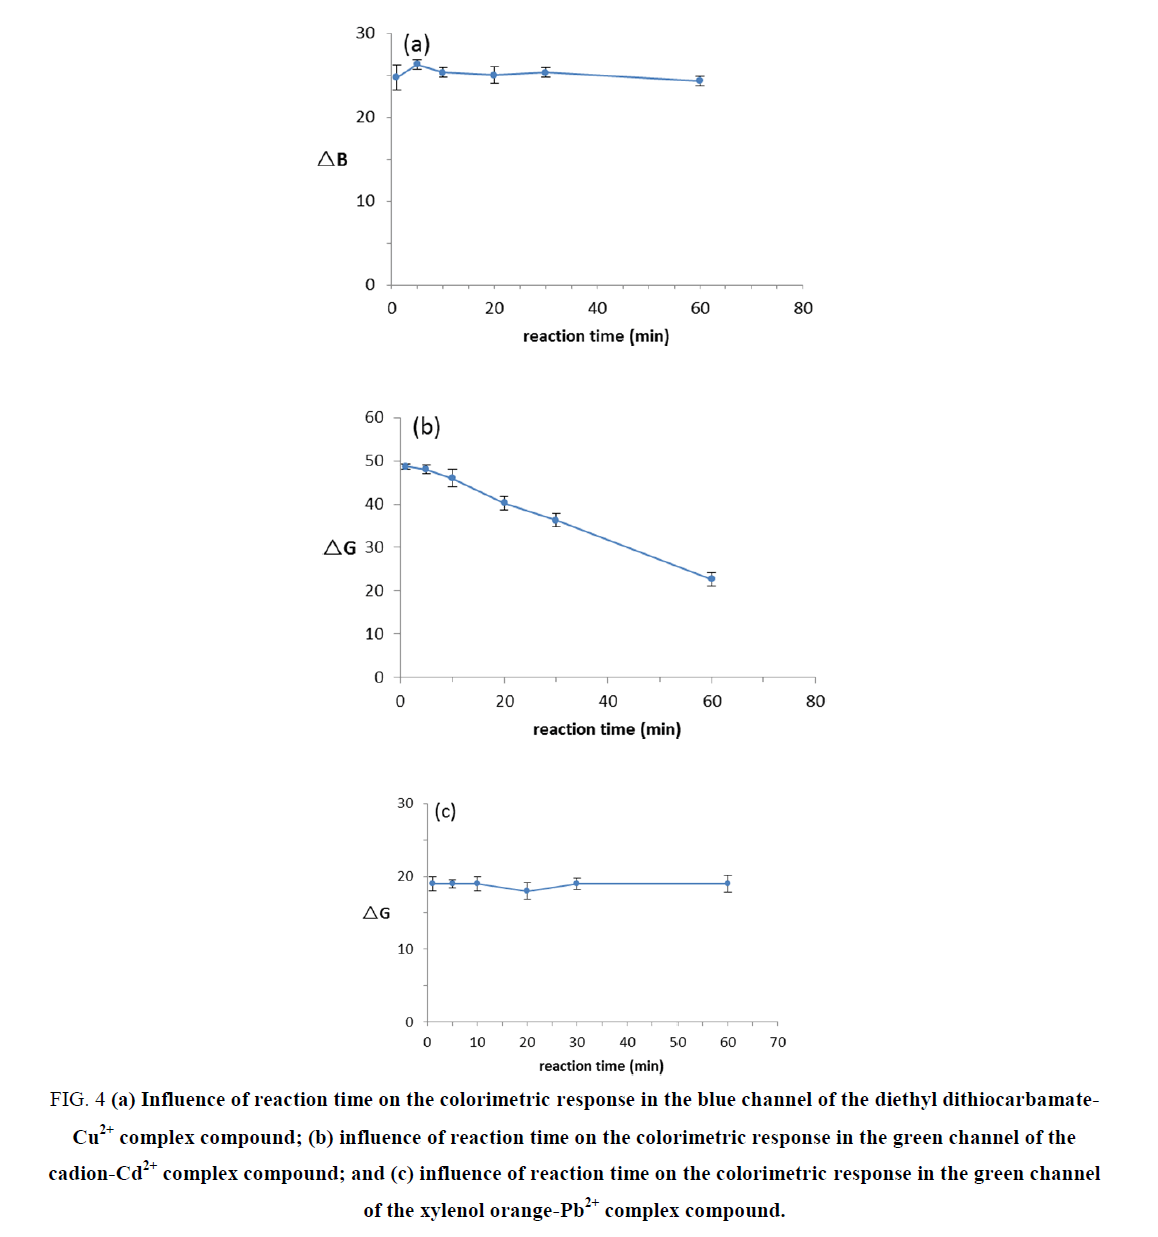
In our experiment, 1 mg.L-1 Cu2+, 1 mg.L-1 Cd2+ and 1 mg.L-1 Pb2+ standard solutions were used to evaluate the effect of reaction duration on the chromogenic results. We obtained images in a photography box at 1 min, 5 min, 10 min, 20 min, 30 min and 60 min of reaction time. The changes in the ΔB or ΔG values for the complex compound colors at different reaction times are displayed in FIG. 4. The results demonstrated that within 60 min, the color of the Cu2+ and Pb2+ solutions did not change, which means that their reaction times have no effect on the chromogenic results. The color of the Cd2+ complex compound was stable within 10 min; however, the color faded gradually, indicating that it is better to observe the Cd2+ complex compound color within 10 min.
Figure 4. (a) Influence of reaction time on the colorimetric response in the blue channel of the diethyl dithiocarbamate-Cu2+ complex compound; (b) influence of reaction time on the colorimetric response in the green channel of the cadion-Cd2+ complex compound; and (c) influence of reaction time on the colorimetric response in the green channel of the xylenol orange-Pb2+ complex compound.
The effect of reaction temperature
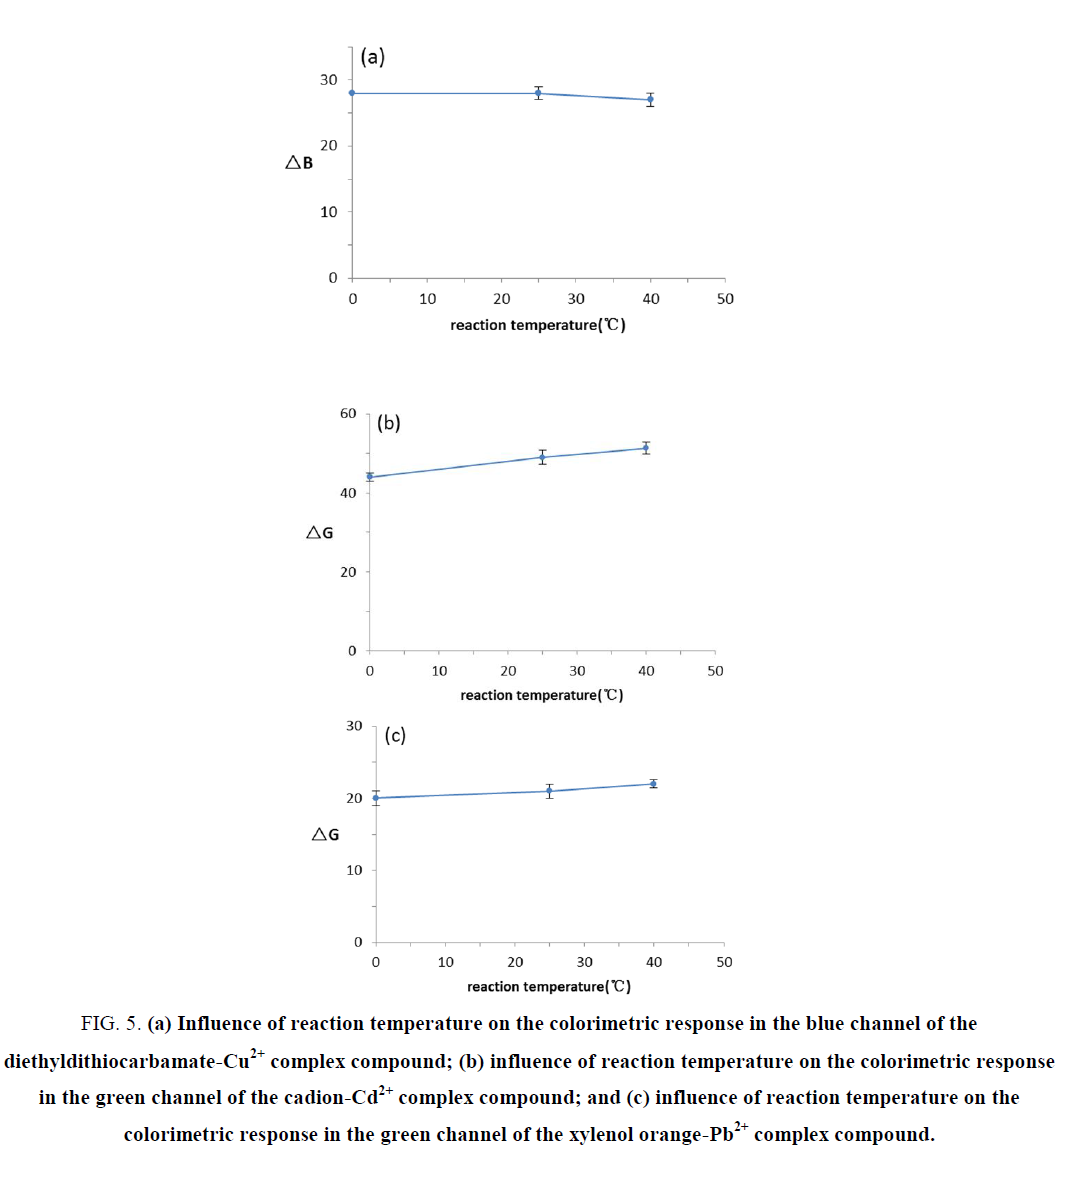
To study the temperature effect on the color reaction results, 1mg.mL-1 copper standard solution, 1mg.mL-1 cadmium standard solution, and 1mg.mL-1 lead standard solution were reacted at temperatures of 25℃, 0℃, and 40℃ for 5 min, respectively, and then, the results were recorded using photography. The changes in the ΔB or ΔG values for the complex compound colors at the different temperatures are displayed in FIG. 5. The results showed that in the range of 0-40℃, different temperatures have no significant effect on Cu2+, Cd2+, and Pb2+ color reactions. Therefore, the reaction could be conducted at room temperature.
Figure 5. (a) Influence of reaction temperature on the colorimetric response in the blue channel of the diethyldithiocarbamate-Cu2+ complex compound; (b) influence of reaction temperature on the colorimetric response in the green channel of the cadion-Cd2+ complex compound; and (c) influence of reaction temperature on the colorimetric response in the green channel of the xylenol orange-Pb2+ complex compound.
Interference of coexisting
Experiments showed when measuring Cu2+ at 0.5 mg.L-1 using EDTA and sodium citrate as a mixed masking agent, the co-existing ions of 1000 mg.L-1 Na+, K+, Mg2+, Al3+ and 100 mg.L-1 Ag+, Ca2+, Ba2+, Zn2+, Ni2+, Cd2+, Pb2+, Hg2+ and 80 mg.L-1 Fe3+ were tolerated, revealing that this method is selective for Cu2+. When measuring Cd2+ at 0.1 mg.L-1 and using sodium citrate, sodium fluoride, potassium sodium tartrate and thiourea as a mixed masking agent, the co-existing ions of 1000 mg.L-1, Na+, K+, Ni2+ and 100 mg.L-1 Ca2+, Ba2, Mg2+, Zn2+, Pb2+, Cu2+, Al3+, Mg2+, Al3+ and 10 mg.L-1 Ag+, Hg2+ were tolerated, which illustrates that this method is selective for Cd2+. When measuring Pb2+ at 0.2 m L-1 and using cysteine and thiourea as a mixed masking agent, the co-existing ions of 1000 mg.L-1 Na+,K+,Ca2+, Ba2+, Mg2+, Hg2+, Ag+ and 10 mg.L-1 Fe3+ and 1 mg.L-1 Zn2+, Ni2+, Al3+, Cu2+, Cd2+ were tolerated. Therefore, this method shows good selectivity for Pb2+.
Method application to Chinese crude drugs
The applicability of the proposed method was evaluated by the determination of Pb2+, Cu2+, and Cd2+ in eighty samples including eight types of Chinese crude drugs. Meanwhile, 1.0 g powder of Paeoniae radix alba was weighed accurately, and different amounts of standard Pb2+, Cu2+, and Cd2+ solutions were added. Sample solutions were treated according to the above procedure. We detected the Cu2+, Pb2+, and Cd2+ concentration by using the proposed method and confirmed them with the AAS result.
From TABLE 1 to TABLE 4, the results showed that when the Pb2+, Cu2+ and Cd2+ concentration of the samples are above the minimum detection limit of the methods, it can be detected, and then by comparing with the standard colorimetric plates, the concentration range of Cu2+, Cd2+ and Pb2+ can be determined. However, if the concentrations of Cu2+, Cd2+, and Pb2+ are greater than the maximum detection limit of the standard colorimetric plates because the color is too deep, then it is difficult to distinguish the color gradation of the solutions, and there is no corresponding standard color as a reference; thus, it is difficult to perform a semi-quantitative detection.
| Sample name | Source | Cu2+ | Cd2+ | Pb2+ | |||
|---|---|---|---|---|---|---|---|
| RDM | AAS | RDM | AAS | RDM | AAS | ||
| Paeoniae radix alba | Anhui | ND | 0.048 | ND | 0.021 | 0~0.2 | 0.257 |
| Glycyrrhizae radix et rhizoma | Neimeng | 0.5~1.0 | 0.685 | ND | 0.018 | 0~0.2 | 0.259 |
| Astragali radix | Gansu | 0~0.5 | 0.355 | ND | 0.015 | 0.2~0.5 | 0.295 |
| Salviae miltiorrhizae radix et rhizoma |
Shandong | 1.0~2.0 | 1.209 | ND | 0.027 | 0.5~1.0 | 0.549 |
| Panacis quinque folii radix | Jilin | 1.0~2.0 | 1.077 | ND | 0.031 | 0.5~1.0 | 0.634 |
| Lonicerae japonicae flos | Heinan | 1.0~2.0 | 1.914 | ND | 0.020 | 0~0.2 | 0.209 |
| Crataegi fructus | Shandong | 0.5~1.0 | 0.470 | ND | 0.019 | ND | 0.115 |
| Lycii fructus | Ningxia | 0.5~1.0 | 0.885 | ND | 0.023 | 0~0.2 | 0.225 |
TABLE 1. Analysis results of Cu2+, Cd2+, and Pb2+ in 8 types of Chinese medicinal herbs (n=3,mg.L-1).
| NO. | Sample (g) | Cu2+ added (mg) | Found(mg.L-1) | |
|---|---|---|---|---|
| RDM | AAS | |||
| 1 | 1.0011 | 0.006 | 0.5~1.0 | 0.627 |
| 2 | 1.0012 | 0.015 | 1.0~2.0 | 1.514 |
| 3 | 1.0011 | 0.030 | 2.0~5.0 | 2.983 |
| 4 | 1.0011 | 0.060 | 5.0~10.0 | 5.896 |
TABLE 2. Analysis results of Cu2+ added to Chinese medicinal herbs.
| NO. | Sample (g) | Cd2+ added (mg) | Found (mg.L-1) | |
|---|---|---|---|---|
| RDM | AAS | |||
| 1 | 1.0010 | 0.002 | 0.1~0.5 | 0.216 |
| 2 | 1.0011 | 0.006 | 0.5~1.0 | 0.603 |
| 3 | 1.0010 | 0.020 | 1.0~5.0 | 1.987 |
TABLE 3. Analysis results of Cd2+ added to Chinese medicinal herbs.
| NO. | Sample (g) | Pb2+ added (mg) | Found (mg.L-1) | |
|---|---|---|---|---|
| RDM | AAS | |||
| 1 | 1.0012 | 0.002 | 0.2~0.5 | 0.391 |
| 2 | 1.0011 | 0.006 | 0.5~1.0 | 0.789 |
| 3 | 1.0010 | 0.015 | 1.0~2.0 | 1.663 |
| 4 | 1.0011 | 0.030 | 2.0~5.0 | 3.147 |
| 5 | 1.0011 | 0.060 | 5.0~10.0 | 5.975 |
TABLE 4. Analysis results of Pb2+ added to Chinese medicinal herbs.
Conclusions
In summary, we successfully created a convenient, sensitive and selective colorimetric method for the rapid discrimination and quantification of Cu2+, Cd2+, and Pb2+ in Chinese crude drugs. To apply the chemical colorimetric method, xylenol orange, cadmium reagent, and copper reagent were used as chromogenic agents to qualitatively and semi-quantitatively detect Cu2+, Cd2+, and Pb2+. The color change could be discriminated clearly by the naked eye, and the color was compared with standard color plates to determine the concentration of the heavy metal ions. For the quantitative determination of Cu2+, Cd2+ and Pb2+, the standard colorimetric plate exhibits a linear range of 0.5-10 mg.L-1, 0.1-5 mg.L-1 and 0.2-10 mg.L-1, respectively. The detection limit of lead is 0.2 mg.L-1, which meets the Chinese Pharmacopoeia guideline for five parts per million allowable lead levels in Chinese crude drugs. The detection limit of cadmium is 0.1 mg.L-1, and there is a certain gap compared with the Chinese Pharmacopoeia limit requirement for three parts per ten million for the cadmium level in Chinese crude drugs. Further research is needed to optimize the method or to enrich the cadmium concentration in the sample solutions. The detection limit of copper is 0.5 mg.L-1, which is well below the Chinese Pharmacopoeia safe-exposure standard for a level of twenty-millionths of copper in Chinese medicinal materials. This method supplies results that can be directly observed with the naked eye without the use of expensive equipment, and the user does not require specialized training. The method is simple and inexpensive and can be used in real-time for on-site rapid detection and monitoring.
In this study, we investigated the effects of different conditions on the colorimetric responses and the optimized conditions. In addition, considering the characteristics of Chinese herbal medicine, six sample pre-treatment methods were analyzed and compared, and the HNO3-HClO4 digestion method was chosen for the pre-processing of Chinese herbal medicines throughout this experiment. Finally, the present method was applied to the detection of Cu2+, Cd2+, and Pb2+ in 80 batches of Chinese crude drugs. Moreover, the accuracy for detecting Cu2+, Cd2+, and Pb2+ in Chinese herbal medicines was compared with the traditional atomic absorption spectroscopy method to verify the results and to demonstrate the feasibility of the method. However, because of the relatively low cadmium level in Chinese herbal medicine, which is below the detection limit of the rapid detection method, this metal concentration is difficult to detect. With the increasing level of scientific research, studies are expected regarding the synthesis of new, highly sensitive chromogenic reagents based on the original coloring agents as well as the development of sample digestion techniques using micro-instruments to provide more development space for the rapid detection method. We hope to realize the on-site rapid detection of heavy metals in Chinese herbal medicines and the effective screening and monitoring of heavy metal contamination in Chinese herbal medicines.
Acknowledgment
This work was supported by the National Science Foundation of China (no. 81503041), the Science research projects of Hunan Provincial Department of Education (no. 17C1213), and the Key projects of Changsha Municipal Science and Technology Bureau (no. K1406030-31).
References
- Liu YQ, China Economic Weekly. 2013:66-67.
- Georgopoulos PG, Roy A, Yonone-Lioy MJ, et al. Environmental copper: its dynamics and human exposure issues. J Toxicol Environ Health Part B. 2001;4:341-94.
- Barnham KJ, Masters CL, Bush AI, Neurodegenerative diseases and oxidative stress. Nat Rev Drug Discovery. 2004;3:205-14.
- Brown DR, Kozlowski H. Biological inorganic and bioinorganic chemistry of neurodegeneration based on prion and Alzheimer diseases. DaltonTrans. 2004:1907-17.
- McFarland CN, Bendell-Young LI, Guglielmo C, et al. Kidney, liver and bone cadmium content in the western sandpiper in relation to migration. J Environ Monit. 2002;4:791-5.
- Meadows-OM. Environmental toxicants: Lead and mercury. J Pediatr Health Care. 2012;26:213-5.
- Meyer PA, Pivetz T, Dignam TA, et al. Brody, surveillance for elevated blood lead levels among children-united States, 1997-2001. MMWR Surveill Summ. 2003;52:1-21.
- Claudio ES, Godwin HA, Magyar JS. Fundamental coordination chemistry, environmental chemistry, and biochemistry of lead (II). Prog Inorg Chem. 2003;51:1.
- Akram S, Najam R, Rizwani GH, et al. Determination of heavy metal contents by atomic absorption spectroscopy (AAS) in some medicinal plants from Pakistani and Malaysian origin. Pak J Pharm Sci. 2015;28:1781-7.
- Chen J, Qiao F, Jin HY, et al. Evaluation of the uncertainty for the determination of heavy metals in Strychni Semen by ICP- MS. Chin J Pharm Anal. 2013;33:2176-86.
- Rakow NA, Suslick KS. A colorimetric sensor array for odour visualization. Nature. 2000;406:710-3.
- Suslick KS, Bailey DP, Ingison CK, et al. Seeing smells: development of an optoelectronic nose. Quim Nova. 2007;30:677.
- Lim SH, Feng L, Kemling JW, et al. An optoelectronic nose for the detection of toxic gases. Nat Chem. 2009;1: 562.
- Feng L, Musto CJ, Suslick KS. A simple and highly sensitive colorimetric detection method for gaseous formaldehyde. J Am Chem Soc. 2010;132:4046.
- Li L, Regan F. Industrial waste water and wastewater. 2013;44:86-89.
- http://caod.oriprobe.com/articles/37222266/xian_huo_hai_chan_pin_zhong_zhong_jin_shu_gong_de_shi_zhi_fa_kuai_s
- Zhu B, Zhou JH, Xue Q, et al. Study on rapid-detection of lead in fresh and lively seafood by test paper. Chinese Journal of health laboratory technology. 2010;20:2417-9.
- Han JH, Zhai P. Review on preparation technology for rapid detection of heavy metal in food. Journal of Anhui Agri Sci. 2014;42:5962-5.
- National Pharmacopoeia Committee, Pharmacopoeia of the People’s Republic of China, Part Ⅰ. 2015.
- Kara D, Fisher A, Hill S. Extraction of trace elements by ultrasound-assisted emulsification from edible oils producing detergentless microemulsions. Food Chemistry. 2015;188:143-8.
- Gu JL, Zhao G, Ma ZL. Food science. 2013;34:168-71.
- Wang AX, Guo LP, Zhang H. On-line preconcentration/fast and sequential determination of Cu, Co, Ni, Cd, and Pb by using activated carbon minicolumn together with Flame Atomic Absorption Spectrometry. Chinese Journal of Analytical Chemistry. 2005;33:385-8.
- http://unsworks.unsw.edu.au/fapi/datastream/unsworks:42263/SOURCE02?view=true
- http://mipdatabase.com/Journals.php?initial=J&fname=JournalofInstrumentalAnalysis
- Lin GX, Jiang XR. Determination of heavy metals in seawater by inductively coupled plasma mass spectrometry and xanthate cotton preconcentration technique. Chinese Journal of Analysis Laboratory. 2014;33:1335-7.
- Li YK, Gao JY. Determination of trace copper by Flame Atomic Absorption Spectrometry with flow injection on-line preconcentration. J Anhui University of technology. 2010;27:160-2.
- Shen J. Inner Mongolia Science Technology and economy. 2013;46.
- Chen ST, Yan YS, Xu WZ, et al. Simultaneous determination of Cr(III) and Cr(VI) by nano-TiO2 pre- separation/enrichment FAAS. Spectroscopy and Spectral Analysis. 2007;27:1018-20.
- Zheng H, Hu LM, Liu JT, et al. Analytical Instrumentation. 2011:34-37.
- Nekouei S, Nekouei F, Ulusoy HI, et al. Desalination and water treatment. 2015;55:1-10.
- Wang M, Li S, Zhou JD, et al. Box-Behnken design optimized cloud point extraction-Atomic Fluorescence Spectrometry for determination of mercury in Chinese medicinal materials. Spectroscopy and Spectral Analysis. 2014;34:2254-8.
- Yang FW, Wang HB, Zhang B. Determination of trace copper in litchi and longan meat by cloud point extraction-Flame Atomic Absorption Spectrometry. Chemical Research and Application. 2011;23:951-4.
- Wen XD, Ye LQ, Deng QW, et al. Investigation of analytical performance for rapidly synergistic cloud point extraction of trace amounts of copper combined with spectrophotometric determination. Spectrochimica Acta Part A Molecular and Biomolecular Spectroscopy. 2011;83:259-64.
- Jiang MY, Li WT, Qu LH, et al. Determination of heavy metal elements in two Chinese herbal medicines. Journal of Yunnan Nationalities University: Natural Sciences Edition. 2015;24:132-5.
- Chen HG, Cao GH, Zhao C, et al. Determination of Pb, Cd, As, Hg, Cu in Periploca forrestii Schltr and evaluation on its quality standard. Journal of Anhui Agri Sci. 2010;38:4071-2.
