Research
, Volume: 17( 1) DOI: 10.37532/environmental-science.2021.17.178How El-Nino/La-Nina & India Ocean Dipole (IDO) Influence on Myanmar Rainfall Distribution (Statistical Analysis Report) (1990-2019)
- *Correspondence:
- Kyaw Than Oo
School of Atmospheric Science, Nanjing University of Information Science and Technology, Yangon, China,
Tel: +95 9954 575 418;
E-Mail: kyawthanoo34@outlook.com
Received: December 08, 2020; Accepted: December 23, 2020; Published: January 28, 2021
Citation: Kyaw Than Oo. How El-Nino/La-Nina & India Ocean Dipole (IDO) Influence on Myanmar Rainfall Distribution (Statistical Analysis Report) (1990-2019), J Environ Sci. 2021; 17(1):178
Abstract
Every agriculture countries essential need to examine the rainfall pattern or it influences. This study examined the relative impacts of Niño and Indian Ocean Dipole (IOD) anomalies events on Myanmar summer monsoon precipitation (June to September) on a sub-regional scale. This study used the Niño3-4 and IOD index data sets for 1990-2019 from UCAR and NOAA. As well as ERA5- Reanalysis Data precipitation data, summer monsoon precipitation data across Myanmar for homogeneous and sub-regional precipitation data sets. The spatial distribution of partial correlations between IOD and summer monsoon rainfall over Myanmar indicates a significant influence on rainfall along the monsoon trough regions, parts of the southwestern coastal regions of Myanmar, and over some parts of Thailand. For the region of rainfall, we take average area (90E-105E and 10N-28N) as Myanmar, and about the time scale, selected summer monsoon season (JJAS) data for every dataset are used. Niño and IOD indexes data are already defined regions but time is collected. For Niño anomaly (El Niño or La Niña) events, selected data are defined as +/- 4 of monthly SST average of Niño3-4 region. The positive and negative phase of IOD is defined as the above paragraph and selected data are defined as +/-4 of monthly two SST anomalies difference. We analyze all dataset the whole statistics analysis base on the following formula from Guidelines on the Calculation of Climate by World Meteorology Organization especially anomalies and correlation analysis. Study the relative influences of the IOD and the Niño anomalies on the summer rainfall of these regions by grid data analysis with Open-Grads climate data display to understand the impacts of the IOD/Niño anomalies on Myanmar monsoon rainfall at a regional scale. If IOD and Niño anomalies are the same values positive or negative, rainfall distribution was randomized distribution. If IOD negative anomaly or negative phase can impact monsoon rainfall over Myanmar. Found Niño can impact positively correlation over Myanmar monsoon rainfall distribution during IOD normal situations with weak correlation. And during IOD normal year rainfall distribution are not enough strong correction with Niño directly and not a correlation with for IOD anomaly year rainfall. We can also found a strong negative correlation (-0.3 to -0.4) with strong regression values (- 0.3 to -0.6) between SST and Myanmar monsoon rainfall distribution. As the results of the 3 variables correlation, IOD and rainfall distribution had a negative correlation and IOD and Niño had a positive correlation. Their turning point is around values of +/- 0.3 and its values indicate a weak positive (negative) linear relationship via a shaky linear rule. The influence of the IOD negative phase on monsoon rainfall over Myanmar is more than that of positive IOD during Niño normal situation.References
Biotechnology Article Blog | Auto Insurance in Illinois Computer Technologies Articles Blog | Car Insurance in Washington and Georgia Blog | Cordblood Journals Electronic Technologies Articles Blog | Dental Care Journals Emerging Technologies Articles Blog | Best Betting Sites in Italy Environmental Technologies Articles Blog | Car Insurance in Texas Medical Technologies Articles Blog | Casino Sites in Italy Micro Technologies Articles Blog - Find Lawyer in Oklahoma Military Technologies Articles Blog - Find Lawyer in South Carolina Nano Technologies Articles Blog | Best Betting Sites in Argentina Nft Technologies ArticlesKeywords
IOD, Niño, Rainfall, Myanmar, Monsoon
List of Acronyms
• ENSO - El Nino-Southern Oscillation
• Niño - Area to define to check the indices to define El Niño and La Niña
• Niño Index - Index to define El Niño and La Niña events
• IOD - India Ocean Dipole
• IOD Index - Index to define positive or negative phase of India Ocean Dipole
• SST - Sea surface temperature
• SSTA - Sea surface temperature anomaly
• IODI - IOD index
• JJAS - Months of monsoon season over Myanmar, June, July, August, September
• AAM - Arithmetic mean
• WDs - Western disturbance
Introduction
Myanmar is situated in South East Asia; between latitudes 9˚32'N - 28º31'N and longitudes 92˚10'E - 101˚11'E [FIG-1]. It occupies a total landmass (about 6 80 000 km2) in the tropical belt of Southeast Asia (Sen Roy and Kaur, 2000). Its economy is heavily dependent on agriculture. It also has an old civilization. Because the annual rainfall of South Asia is more than twice the global average of about 1000 mm and its rich farmland, it has the potential for developing into a regional agriculture goods production [1]. Among the many climate systems, summer monsoon variability is one of the important socially relevant scientific themes that receive a lot of attention because of its complexity and impact on the general population. It’s also impacting on the largely agriculture-based Myanmar economy can be gauged from the fact that rainfall over the Myanmar region during the summer monsoon season that lasts from June to September (JJAS) is 75% of the annual rainfall, based on the data from 1947-1979 [1].

Figure 1:Location of Myanmar Longitude (90-102 E), Latitude (10-28 N).

Figure 2:Spatial variability in average annual rainfall over Myanmar, as influence by various climate driver.
Nino Index
A relatively large section of the South Asian monsoon variability is known to be associated with El Niño Southern Oscillation (ENSO) (Ju and Slingo, 1995). During an El Niño phenomenon, there is an observed increase in Sea Surface Temperature (SST) in the central-eastern equatorial Pacific, shifting the deep convection center from the Maritime continent eastward into the central Pacific. Above process is mostly associated with a reduction in annual rainfall over the western Pacific area and South Asia [2]. That attributed the tendency of negative correlation between South Asian monsoon rainfalls with the eastern Pacific SST anomaly or Niño anomaly process. Niño 3.4 (5N-5S, 170W-120W): The Niño 3.4 anomalies may be thought of as representing the average equatorial SSTs across the Pacific from about the dateline to the South American coast. The Nino 3.4 index typically uses a 5-month running mean, and El Niño or La Niña events are defined when the Nino 3.4 SSTs exceed +/- 0.4C for a period of six months or more [3].
Indian Ocean Dipole Index
The India Ocean Dipole (IOD) is that the ocean counterpart of the Pacific El Niño and La Niña. The term dipole means two “poles” or two areas of differences [4]. India Ocean Dipole may be the SST anomaly (Sea Surface Temperature Anomaly – different from normal) that happens occasionally in the Northern or Equatorial India Ocean Region (IOR). The IOD measures differences in SSTs between the sea (western pole) and also the eastern Indian Ocean Southern parts of Indonesia (eastern pole). Both of the poles are situated within the equatorial region of the India Ocean (i.e., between 10°N and 10°S) but they need a northwest-southeast diagonal orientation thanks to the physical configuration of the North Indian Ocean. India ocean becomes alternately warmer (positive phase) so colder (negative phase) than the eastern part of the ocean. The South Asia monsoon rainfall is influenced by Indian Ocean Dipole (IOD) within which the western ocean becomes alternately warmer so colder than the eastern part of the ocean (positive phase). For monitoring the IOD, climatologists consider sustained values above +0.4°C as typical of a positive IOD, and values below −0.4°C as typical of a negative IOD. (Bureau of Meteorology, Australia)
This paper is an extension of much earlier research on the relative impacts of the IOD and ENSO events on South Asia monsoon rainfall with mainly focus on Myanmar monsoon rainfall. In this paper, using statistical methods such as departure (anomaly), partial correlation, and Lead square (regression) techniques, we examine the impact of these largely on the Myanmar Monsoon rainfall from the sub-regional scale point of view. Apart from the seasonal relationships, we also try to understand these impacts on yearly scales for those highest impact years. Finally, we show lead-partial correlations of the IOD with total seasonal rainfall to demonstrate that IOD events indeed influence the rainfall over Myanmar and IOD is the main tele connection between Monsoon rainfall and ENSO that will see in this study.

Figure 3:Phases of IOD average SW monsoon season SST.
Data and Methods
The SST Nino 3.4 indexes (area-averaged SSTA over 150W - 90W, 5S -5N) data are taken from the website of National Center for Atmospheric Research (US), Climate data Store for the period of 1990 to 2019. While the IOD indexes (the difference of the area-averaged SSTA between the regions 50E-70E, 10S-10N and 90E-110E) are taken from the website of National Oceanic and Atmospheric Administration (US), Earth System Research Laboratories, Physical Sciences Laboratory (ONI). We also use the Gridded data and area average rainfall data taken from ERA5- Reanalysis Data by Climate Data Store, European Centre for Medium-Range Weather Forecasts (ECMWF). And regional average rainfall distribution data are taken from Department of Meteorology and Hydrology, Myanmar.
Time Series Data Collecting
Summer monsoon rainfall characteristics during ENSO and IOD years are analyzed through composites calculated over a 30 year period (from 1st January 1990 to 31st December 2019). After taking the data set, we define region and time scales for the analysis. For the region of rainfall, we take average area (90E-105E and 10N-28N) as Myanmar. About the time scale we used, we only selected summer monsoon season (JJAS) data for every datasets. Niño and IOD indexes data are already defined regions but time is collected. For Niño abnormal (El Niño or La Niña) events, selected data are defined as +/- 4 of monthly SST average of Niño3-4 region (Nino SST Indices (Nino 1+2, 3, 3.4, 4; ONI and TNI) | NCAR - Climate Data Guide, no date)For IOD events, positive and negative phase of IOD is defined as above paragraph and selected data are defined as +/-4 of monthly two SST anomalies difference (Bureau of Meteorology, no date). For the rainfall data, we defined the region as 10N to 25N and 90E to 105E for special average for each year, and then take a data from ERA5 monthly reanalysis total precipitation NetCdf dataset.
Basic Analysis
After collecting and defining the data, we analysis all dataset the whole statistics analysis base on following formula from Guidelines on the Calculation of Climate by World Meteorology Organization (WMO, 2010).
Averaging of 30 years
Analyzing monsoon seasonal average for each 30 years and long-term average for 30 years to calculate the departure or anomaly. For the rainfall data area arithmetic mean (AAM) was performed using the following equation:
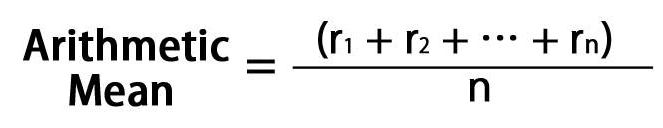
Where r is the point data values or area average data values, n is the length of the sample or the year.
Anomalies of months and monsoon season
Nino and IOD indexes are originally anomalies data but rainfall anomalies data are calculating as follow.
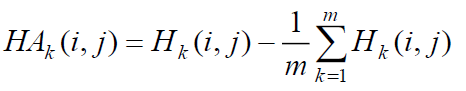
Where, i and j were longitude and latitude respectively, m is the length of the sample an k is the year. (WMO (World Meteorological Organization), 2017)
Deep Analysis
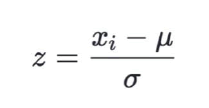
Standardizing: In this analysis, I used 3 variables or indexes SSTA, IODI, and rainfall, those are not same units so we need to provide more information about the magnitude of the anomalies. Thus, I do standardized anomalies that calculated by dividing anomalies by the climatological standard deviation as follows. (WMO, 2010)
Correlation coefficients
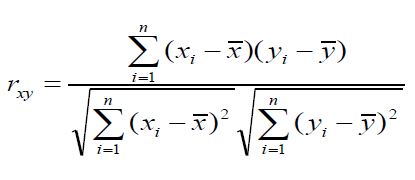
For the most examination of this paper, we performed the cross-correlation of IOD, Niño, and Rainfall anomalies one another. It’s a function wont to examine the connection between two anomalies series, to spot whether two stationary series could also be related, with the identical characteristics of the parametric statistic. For the strength denoted by r, could be a measure of the strength of the straight-line or linear relationship between two variables, and take values between 0 and +\-0.3 indicate a weak positive (negative) linear relationship via a shaky linear rule. The values index between 0.3 and 0.7 (-0.3 and -0.7) shows a moderately positive or negative linear relationship via a fuzzy-firm linear rule [5].
Least Squares (Regression)
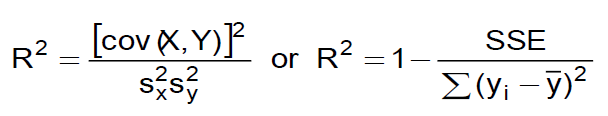
The value of R2, called the coefficient of determination, and denoted R2 is typically interpreted as ‘the percent of variation in one variable explained by the other variable,’ or ‘the percent of variation shared between the two variables.’ Good things to know about R2: [7]. Extensive research has been carried out to identify summer rainfall regions over Myanmar. In the next section, study the relative influences of the IOD and the Niño anomalies on the summer rainfall of these regions mentioned before by grid data analysis with Open- Grads climate data display to understand the impacts of the IOD/Niño anomalies on Myanmar monsoon rainfall at a regional scale. Finally, highlight the Myanmar summer monsoon average rainfall distributing of the highest values years of Niño (normal or abnormal) and IOD (positive or negative) phases years to sign the above analysis results.
Results of Analysis

Figure 4:Monthly rainfall percentage (1990 - 2019).
Starting from the month's May to October Myanmar receives rainfall. According to Myanmar Climate Report (2017), Myanmar’s summer monsoon season or rainy season is experienced in June – September. The seasonal (summer monsoon) total rainfall accounts for about 49% of the whole annual rainfall over Myanmar, based on the ERA5 reanalysis dataset used in this study. Were used all actual and reanalysis data of 1990-2019 for average analysis, anomalies analysis, correlation analysis with regression values with South West Monsoon rainfall intensities, and distribution. And were displayed highlight of rainfall anomalies over IOD Normal years (2002, 2010) and IOD negative and positive phase (2005, 2019).
According to the time series analysis on rainfall anomaly [FIG-5], 22 times of negative anomalies rainfall occurred from 1990 to 2019. These negative anomalies are also the highest values over most of the years with negative or down trending overtimes. After the standardized, all indexes, half of the late years are still down trending [FIG-6].

Figure 5:Standardized anomalies of NINO3-4 SSTA (Red line) and IODMI (Blue line) and Myanmar monsoon rainfall (Green line).

Figure 6:Nino and IOD anomalies events during Monsoon Season (JJAS).
Then collecting Nino abnormal (El Niño or La Nina) events, selected data are defined as +/-4 of monthly SST average of Niño3-4 region. For IOD events, the positive and negative phase of IOD is defined as mention above and selected data are only +/-4 of the IOD index. After collection and calculating, do counter check from the notices of Niño and Abnormal Years by mention above. Due to the result of the collection of these Niño and IOD (positive or negative) years, their distribution is random variation in each year. Some years had positive relations that same positive or negative together and some years had negative relations. But in the years 2001, 2003, and 2014, did not see any anomalies for both, that can assume normal years [FIG.7.]. As a result of the trend forecast, in coming years may be found Negative Niño (La Niña events) and Positive IOD events with weak regression [FIG.8.].

Figure 7:Trend forecast of Niño and IOD anomalies events during Monsoon Season (JJAS).

Figure 8:Correlation (Shaded) and regression (Contour) between IOD anomalies and Niño anomalies.
Before deep analysis of Myanmar monsoon rainfall and IOD or Niño Anomalies, tested the significance of Niño SST with Other SST. As the result, found India Ocean SST is positively correlated (+0.3 to 0.8) with the Niño SST and regression values also stronger (+0.5 to 2.5) [FIG.9.]. Thus, can assume all later analysis results will be reasonable by the scientific view. The following discussion is highlights phase to phase to approve correlation results. These following figures are displaying for seasonal average rainfall distributions over the regions. These years are chosen for highlight because these years are the highest values of each index and close to the present time.

Figure 9:Correlation between IOD vs. Monsoon rainfall over all IOD anomaliesy.
After a significant test of SST, performed a correlation between IOD and Myanmar monsoon rainfall overall IOD anomalies years including Niño anomalies years. Then found a negative correlation but the regression value is a little bit low [FIG.10.]. As a highlight of these phenomena years 2015 and 2016, found rainfall anomalies distribution over the whole of Myanmar are not too strong (+/-2) or averaging nearly normal during both Niño and IOD positive anomaly year 2015. Also, rainfall anomalies distribution is weak (+/-2) or averaging nearly normal during both Niño and IOD negative anomaly year 2016 [FIG.11.]. It shows, if IOD and Niño anomalies are the same values positive or negative, rainfall distribution was randomized distribution.

Figure 10:Annual Monsoon Rainfall anomalies of Niño and IOD anomaly positive year (2015) and Niño and IOD anomalies Negative year (2016).

Figure 11:Correlation between IOD Anomalies vs. Monsoon Rainfall during Niño Normal Years.
For the Nino normal years performed a correlation between IOD and Myanmar monsoon rainfall. Found a negative correlation with a strong regression value [FIG.12.]. As a highlight of these kinds of years 2005 and 2019, found rainfall anomalies distribution is increasing (+3 to 6) over mostly area of Myanmar during the Niño normal and IOD negative anomaly year 2005. Also, rainfall anomalies distribution was decreasing (-3 to -6) over mostly area of Myanmar during the Niño normal and IOD positively anomaly year 2019 [FIG.13.]. It’s showed if IOD negative anomaly or negative phase can impact Myanmar monsoon rainfall distribution directly during

Figure 12:Annual Monsoon Rainfall anomalies of Negative IOD year (2005) Positive IOD year (2019) during the Niño normal situation.

Figure 13:Correlation between IOD Anomalies vs. Monsoon rainfall during NiNo anomalies Years.
Then also, during the IOD normal years, IOD and monsoon rainfall over Myanmar are a slightly positive correlation with moderate regression [FIG.14.]. As the highlight year 2002 positive Niño or El Niño year, rainfall distribution was increasing (+2 to 6) over most parts Myanmar. Also, in the year 2010 negative Niño or La Niña year, rainfall distribution was increasing (-2 to -6) over most parts of Myanmar [FIG.15.].It also shows, Niño can impact positively correlation over Myanmar monsoon rainfall distribution during IOD normal situations. For IOD normal year rainfall distribution are not enough strong correction with Niño directly and not a correlation with for IOD anomaly year rainfall [FIG.16.].

Figure 14:Annual Monsoon Rainfall anomalies of El Nino year (2002) and La Nina year (2010) during IOD normal situation.

Figure 15:Correlation between NiNo and monsoon rainfall during IOD normal and anomalies.

Figure 16:Correlation (Shaded) and Regression (Contour) between SST Anomalies and Myanmar monsoon rainfall Anomalies.
After analyzing 3 variables by phase to phase analysis as above, performed the correlation significant regression tested between SST and Myanmar monsoon rainfall distribution. We can found strong negatively correlation (-0.3 to -0.4) with strong regression values (-0.3 to -0.6) [FIG.17.]So, we can assume IOD are only impacted negatively by Myanmar monsoon rainfall during this 30 years analysis. And overall analysis of these highlight years, some northern parts of Myanmar are deviation like above discussion because this area had an effect by Western Disturbances (WDs) what Cyclonic storms associated with the mid-latitude Subtropical Westerly Jet (SWJ) [8].
As the results of the 3 variables correlation, we can see finalize results in (table-1). IOD and rainfall distribution had a negative correlation and IOD and Niño had a positive correlation. Their turning point is around values of +/-0.3 and its values indicate a weak positive (negative) linear relationship via a shaky linear rule [9].
| Niño | IOD | RF ANO | |
|---|---|---|---|
| Niño | 1 | 0.329918 | 0.062899 |
| IOD | 0.329918 | 1 | -0.3075 |
| RF ANO | 0.062899 | -0.3075 | 1 |
Summary
This paper investigates how much the Niño anomalies mode impact on the IOD and then explores IOD influences on Myanmar monsoon season rainfall (JJAS), activities in these 30 years (1990-2019). As the summarized analysis results, we can found that, if IOD and Niño anomalies are the same values positive or negative, rainfall distribution was randomized distribution. If IOD negative anomaly or negative phase can impact Myanmar monsoon rainfall distribution directly during Niño's normal situations. Then, we can found Niño can impact positively correlation over Myanmar monsoon rainfall distribution during IOD normal situations, and during IOD normal year rainfall distribution are not enough strong correction with Niño directly and not a correlation with for IOD anomaly year rainfall. We can also found a strong negative correlation (-0.3 to -0.4) with strong regression values (-0.3 to -0.6) between SST and Myanmar monsoon rainfall distribution.
As a result of the trend forecast, in the coming years we may be found Negative Niño (La Niña events) and Positive IOD events with weak regression. So, we need further more study to others variable what impact on Myanmar monsoon rainfall to get best climate forecast like Western Disturbances (WDs). But, in view of the recent increasing correlation between IOD SST and Myanmar Monsoon rainfall and it may be worthwhile to examine the possibility of using the IOD SST for the climate prediction of the monsoon rainfall over Myanmar. The present finding has another implication for the climate community for climate prediction [10,11]. To obtain a realistic prediction of the Monsoon rainfall over Myanmar, we need also to study other variables and need to simulation the model also. The present finding, as stated by a well-known physicist in another context, raises a new question, and a new possibility to regard the old problem of the Monsoon rainfall over Myanmar from a new angle, and to make a real advance in the predictability study.
Acknowledgements
The author expresses the special gratitude to Nanjing University of Information Science and Technology, for providing them with the necessary facilities to carry out the study. Special appreciation goes to the Department of Meteorology and Hydrology, Myanmar, NOAA and NCEP/NCAR for the provision of the datasets used in the study.
Competing Interests
The author declares that there is no potential conflict of interest of whatsoever.
References
- Bimal K P and Rashid H. Climatic Hazards in Coastal Bangladesh.2020.
- Dimri, A. P. D. Niyogi A. P. Barros et al. Western Disturbances: A review, Rev. Geophys.2015.225
- Ju, J and Slingo J. ‘The Asian summer monsoon and ENSO’, Quarterly Journal of the Royal Meteorological Society.1995.
- Kurtz, T. E. and Kurtz, T. E. Regression and correlation. Basic statistics.2009.
- Abkowitz, M., and E. Meyer. Technological advancements in hazardous materials evacuation planning. Transportation Research Record. 1996.1522:116-121..
- Trenberth, Kevin. Nino SST Indices (Nino 1+2, 3, 3.4, 4; ONI and TNI) | NCAR - Climate Data Guide. 2020.
- ONI, C. P. C. National Oceanic and Atmospheric Administration (US), Earth System Research Laboratories, Physical Sciences Laboratory. 2020
- Ratner B. The correlation coefficient: Its values range between 1/1, or do they’, J Target Meas Anal Mark. 2009.
- Sen Roy N. and Kaur, S. Climatology of monsoon rains of Myanmar (Burma), Int. J. Climatol 2000. 913
- Trenberth, K. E. The Definition of El Nino, Bull. Am. Meteorol. Soc, 1997. 2771
- Webster, P. J. V. O. Magaña T. N. Palmer J. Shukla R. A. Tomas et. al. Monsoons: processes, predictability, and the prospects for prediction, Journal of Geophysical Research: Oceans, 1998. 48

