Research
, Volume: 18( 2)Comparison of Gridded Rainfall Estimates with Gauge Rainfall during the South-West Monsoon Period in the Wet-Zone of Sri Lanka
- *Correspondence:
- Malinda MillangodaDepartment of Atmospheric Science, Nanjing University of Information Science and Technology, Nanjing, China. Tel:+94774709199; E-mail: malinda_sbm@yahoo.com
Received: 26 January, 2022; Manuscript No. TSES-22-57110; Editor assigned: 31 January, 2022; Pre QC No. TSES-22-57110; Reviewed: 10 January, 2022; QC No. TSES-22-57110; Revised: 15 February, 2022; Manuscript No: TSES-22-57110 (R); Published: 25 February, 2022; DOI: 10.37532/environmental-science.2022.18.212
Citation: Malinda M. Comparison of Gridded Rainfall Estimates with Gauge Rainfall during the South-West Monsoon Period in the Wet-Zone of Sri Lanka. Environ Sci Ind J. 18(02): 212
Abstract
In this day and age, multiple numbers of gridded rainfall estimates are available. These estimates are used in diverse fields of interests including meteorological and climatic studies. Considering, meteorology and climate studies, rainfall estimates are used to monitor hydro meteorological hazards and for agricultural purposes. The most commonly used and the most reliable way of monitoring rainfall are to use rainfall gauges. However, this could be a costly affair considering the equipment, maintenance and training required to run such a rainfall gauge network. Moreover, it is also difficult to cover a large area of land with point rainfall gauges. In this background, estimated gridded rainfall products are used in analysing rainfall which will give a homogenous rainfall dataset which could be easily arranged and used in data analysis and studies. In this comparison, Climate Hazards Group Infrared Precipitation with Station data (CHIRPS), Global Precipitation Climatology Centre (GPCC) and European Centre for Medium Range Weather Forecast (ECMWF) ERA-5 reanalysis data is compared with gauge rainfall data of the gauge network maintained by the Department of Meteorology, Sri Lanka. Multiple statistical parameters such as Correlation Coefficient (CC), Root Mean Square Error (RSME) and bias values were used in determining what source of rainfall estimate data better represents the observed rainfall over Sri Lanka during the south-west monsoon period. This study revealed that GPCC rainfall data of resolution (0.25° x 0.25°) best represents the gauge rainfall data for the selected points.
Keywords
Celosia; Drought stress; DUF538; Gene expression; Real-Time PCR
Introduction
Sri Lanka is a country that is affected by a considerable number of hydro meteorological hazards and disasters, specifically during the south-west monsoon period which is also known as the summer monsoon within the wider meteorological community. In the recent past, with the changes to the climate, extreme events have increased and the severity of these hazards has increased considerably throughout the world [1]. Sri Lanka is mainly an agricultural country with majority of the rural population engaged in it. These two main factors make a study of rainfall over Sri Lanka significant. However, estimating rainfall with reasonable accuracy is difficult due to the variability of rainfall spatially and temporally. Gauge rainfall data provides accurate rainfall amounts with high reliability and accuracy but there are several drawbacks in using these data. The quality of data available is problematic and the gaps in availability of data in both temporal and spatial scales hinder a meaningful analysis to be carried out. The reasons stated above and the lack of homogenous observational data warrants the use of gridded data in studying rainfall patterns. In line with that, data evaluation and comparison are essential since gridded rainfall data is used in most analysis nowadays. This study will compare gridded rainfall data of multiple origins with gauge rainfall data over Sri Lanka during the south-west monsoon period which is the season that receives the highest seasonal amount of rainfall in Sri Lanka.
Sri Lanka is an island in the tropics with tropical and monsoonal weather two main seasonal wind regimes which changes 1800 across the country during the corresponding seasons. This monsoonal weather brings a lot of rain to Sri Lanka and based on the rainfall origin, Sri Lankas climate has been divided into four main seasons. The South-West monsoon period or the summer monsoon is the major contributor to the amount of annual rainfall with a 30% contribution spread across five months from May to September. The onset of the south-west monsoon, ending the two month long first inter-monsoon from March to April, occurs towards the end of May with the average onset date being 25 May. Withdrawal of the south-west monsoon happens towards the end of September which then paves way to the second inter-monsoon during the months of October and November. The north-east monsoon or the winter monsoon period is December to February.
Sri Lanka receives an average rainfall of 1860 mm per year. The rainfall amount varies between 900 mm (southeastern lowland) to 5500 mm (southwestern slopes of the central highland) around the island with varying origins of rainfall such as monsoonal, convectional and weather systems formed in the Bay of Bengal accounting for a higher percentage of the annual rainfall [2,3].
The south-westerly winds which are dominant during the south-west monsoon reduce the effect of the warm weather that prevailed during the first Inter monsoon period. South-west monsoon showers can be experienced at any time of the day and occasionally intermittent showers occur in the southwestern part of the country. Rainfall amount during this season varies from about 100 mm to over 3000 mm. The mid-elevation regions of the western slopes experience the highest amount of rainfall and the rainfall decreases rapidly from these maximum regions towards the higher elevations. The variability towards the south-western coastal area is less rapid, with rain totals ranging from 1000 mm to 1600 mm in the south-western coastal belt during this time. Lowest rainfall amounts are generally recorded from northern and south-eastern regions (FIG. 1).

FIG. 1. Annual accumulated rainfall (mm) of Sri Lanka. Image courtesy Department of Meteorology, Sri Lanka. (website: https://www.meteo.gov.lk)
Data
Department of Meteorology (DoM) observational monthly rainfall data for the period of 1981-2019 derived using gauge rainfall data
DoM maintains a gauge rainfall network of more than 400 rainfall stations directly and indirectly. Some of these rainfall stations report on a daily basis with some reporting daily rainfall data on a monthly basis. The rainfall stations that are directly under the DoM are strictly following the World Meteorological Organization (WMO) guidelines in measurement of rainfall data while the rainfall stations which are indirectly maintained are provided with technical assistance with equipment and training assistance in measuring rainfall according to the WMO guidelines.
Climate hazards group infrared precipitation with station data (chirps) monthly precipitation data for the period of 1981-2019 of spatial resolution of 0.05x0.05 degrees.
The Climate Hazards Group Infrared Precipitation with Stations (CHIRPS) dataset uses novel interpolation techniques with high resolution precipitation estimates which runs for a long period which are based on infrared Cold Cloud Duration (CCD) observations. The algorithm is developed around a 0.05° climatology that includes satellite data to represent areas which does not have a lot of gauge data. Monthly CCD-based precipitation estimates of resolution 0.05° from 1981-present merges station data to generate an initial product and uses a modern interpolating process which incorporates the spatial correlation structure of CCD-estimates to assign interpolation weights [4]. In this study, monthly rainfall data spanning from 1981 to 2019 of resolution 0.05° is used.
Global Precipitation Climatology Centre (GPCC) monthly precipitation data for the period of 1981-2019 of spatial resolutions 0.5° x 0.5° and 0.25° x 0.25°
Global Precipitation Climatology Centre (GPCC) was established in 1989 on the request made by World Meteorological Organization (WMO) based on the increased interest and high demand for long-term precipitation data by national and international level organizations. This program was established by the Deutscher Wetterdienst (National Meteorological Service of Germany) as a contribution by Germany to the World Climate Research Program. GPCC monthly rainfall station data-base is considered to be the largest monthly precipitation station database of the world with data from more than 97,000 different stations with data available in 2.5° x 2.5°, 1.0° x 1.0°, 0.5° x 0.5°, and 0.25° x 0.25° resolutions [5]. Data used in this study is GPCC V.2015 of resolution 0.5° x 0.5°, and 0.25° x 0.25° based on data from 75,000 stations which spans from 1981 to 2019.
European Centre for Medium Range Weather Forecast (ECMWF) era-5 reanalysis monthly total precipitation data for the period of 1981-2019 of spatial resolution 0.25° x 0.25°
Global Precipitation Climatology Centre (GPCC) was established in 1989 on the request made by World Meteorological
Organization (WMO) based on the increased interest and high demand for long-term precipitation data by national and international
level organizations. This program was established by the Deutscher Wetterdienst (National Meteorological Service of Germany) as
a contribution by Germany to the World Climate Research Program. GPCC monthly rainfall station data-base is considered to be the
largest monthly precipitation station database of the world with data from more than 84,800 different stations with data available in
2.5° x 2.5°, 1.0° x 1.0°, 0.5° x 0.5°, and 0.25° x 0.25° resolutions [6]. Data used in this study is GPCC V.2020 of resolution 0.5° x
0.5°, and 0.25° x 0.25° based on data from 123,000 stations which spans from 1981 to 2019.
Methods
The following statistical parameters were used in the comparison.
Correlation Coefficient (CC)
The correlation coefficient (CC) is a measure of linear correlation between two sets of data. It's the ratio of two variables' covariance to the product of their standard deviations; it's effectively a normalized measurement of covariance, with the result always falling between 1 and 1. The metric can only indicate a linear correlation of variables, similar to covariance, and excludes many other types of interaction or association. The CC is calculated using the following equation [7,8].
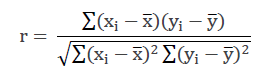
Where,
r=Correlation Coefficient (CC)
xi=values of the x-variable in a sample
x=mean of the values of the x-variable
yi=values of the y-variable in a sample
y= mean of the values of the y-variable
Root Mean Square Error (RMSE)
The Root-Mean-Square Error (RMSE) is a commonly used metric for comparing predicted and observed values (sample or population values) by a model or estimator. RMSE is calculated using the formula below [9,10].
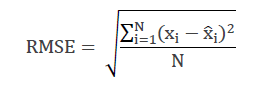
Where,
RMSE = Root Mean Square Error
I=variable i
N=number of data points
x_i=actual observations
x ̂_i=estimated values
Bias
The difference between an estimator's expected value and the true value of the parameter being estimated is known as bias (or bias function) in statistics. In this instance, it is the difference between satellite estimated rainfall and gauge rainfall. The bias of an estimator H is the expected value of the estimator less the value θ being estimated and it can be calculated by the following:
bias=E(H)- θ
Initially, Ratnapura station of Sabaragamuwa province of Sri Lanka which is in the wet-zone of Sri Lanka was used to compare and rank the gridded rainfall estimates of different origins. Then the comparison was extended to cover a further four stations (Katunayaka, Sirikandura, Denagama and Avissawella) which are also in the wet-zone for the top two ranked sources. These stations were selected representing the four administrative districts which are in the wet-zone which has the lowest percentage of missing values covering the period of 1981-2019. Rainfall for each of the locations of the gauge stations were extracted from the gridded rainfall estimates for the comparison.
Results
In the initial comparison, all sources of gridded rainfall data were compared with the observed monthly rainfall of the Ratnapura station which is in the wet-zone of Sri Lanka which receives annual rainfall over 2500 mm for the south-western monsoon period which is from May to September. Firstly, the scatterplots of the observed gauge rainfall and gridded rainfall for GPCC (0.5° x 0.5°), GPCC (0.25° x 0.25°), CHIRPS (0.05° x 0.05°) and ERA-5 (0.25° x 0.25°) for the whole season (May-September) for the period of 1981-2019 was looked into (FIG. 2). This illustrates that GPCC (0.5° x 0.5°) and GPCC (0.25° x 0.25°) estimated rainfall values have been closer to the observed rainfall values in both low and high rainfall values with CHIRPS (0.05° x 0.05°) coming in at third. CHIRPS (0.05° x 0.05°) seem to capture most of the lower rainfall values accurately than higher rainfall values.

FIG. 2. Scatterplots for observed rainfall and (a) GPPC (0.5 x 0.5) (b) GPCC (0.25 x 0.25) (c) CHIRPS (0.05 x 0.05) (d) ERA-5 (0.25 x 0.25) for Ratnapura station of DoM.
Then the Correlation Coefficient (CC), Root Mean Square Error (RSME) and Bias values for Ratnapura station for the months of May to September, which is the southwest monsoon period, for the years between 1981-2019 was investigated (FIG. 3).

FIG. 3. Correlation, RSME and Bias values for Ratnpura station for GPCC (0.5 x 0.5), GPCC (0.25 x 0.25), CHIRPS (0.05 x 0.05) and ERA-5 (0.25 x 0.25).
The following Table shows a summary of CC, RMSE and bias values of the respective datasets. These sources were then ranked based on their performance on CC, RMSE and bias values (Table 1). Then the top two ranked sources were chosen for further evaluation and comparison. Higher CC value, lower RMSE and bias values were deemed to be better representing the observed rainfall. According to the respective ranks on the correlation coefficient, RSME and bias, top ranked source was GPCC (0.25° x 0.25°) followed by CHIRPS (0.05° x 0.05°). Therefore, these two sources were then compared further with additional four stations which are also inside the wet-zone.
Table 1. Correlation, RMSE and Bias values for GPCC (0.5 x 0.5), GPCC (0.25 x 0.25), CHIRPS (0.5 x 0.5) and ERA-5 (0.25 x 0.25) compared with observed rainfall data for Ratnapura station of the DoM.
| Correlation | May | June | July | August | September | MJJAS | Rank |
| GPCC_P5 | 0.72 | 0.75 | 0.85 | 0.86 | 0.71 | 0.78 | 2 |
| GPCC_P25 | 0.81 | 0.73 | 0.9 | 0.89 | 0.82 | 0.85 | 1 |
| CHIRPS_P05 | 0.67 | 0.31 | 0.62 | 0.62 | 0.55 | 0.64 | 4 |
| ERA_P25 | 0.68 | 0.59 | 0.64 | 0.5 | 0.61 | 0.65 | 3 |
| RSME | May | June | July | August | September | MJJAS | Rank |
| GPCC_P5 | 33.58 | 26.34 | 32.9 | 20.98 | 0.56 | 15.06 | 3 |
| GPCC_P25 | 30.91 | 4.88 | 23.99 | 14.34 | 28.2 | 13.86 | 1 |
| CHIRPS_P05 | 30.77 | 21.91 | 3.15 | 5.49 | 8.9 | 13.93 | 2 |
| ERA_P25 | 52.21 | 43.73 | 41.42 | 35.82 | 23.98 | 22.24 | 4 |
| Bias | May | June | July | August | September | MJJAS | Rank |
| GPCC_P5 | 174.1 | 204.4 | 144.2 | 129 | 143 | 158.7 | 3 |
| GPCC_P25 | 82.6 | 79 | 65.7 | 51.9 | 62.6 | 67.5 | 2 |
| CHIRPS_P05 | 9.7 | 60 | 75.1 | 105.9 | 50.6 | 61.3 | 1 |
| ERA_P25 | 354.7 | 315.1 | 209.2 | 221.8 | 295 | 279 | 4 |
In the second stage of the comparison the top two ranked sources GPCC (0.25° x 0.25°) and CHIRPS (0.05° x 0.05°) were compared with observed rainfall data of four further stations in the wet-zone of Sri Lanka namely Katunayaka, Sirikandura, Denagama and Avissawella (FIG. 4).

FIG. 4. Selected rainfall stations for the comparison of model data and actual observations.
In the second stage initially, rainfall of the Katunayake gauge station was considered. The scatterplots of observation against the estimated rainfall of the selected two sources GPCC (0.25° x 0.25°) and CHIRPS (0.05° x 0.05°) shows that GPCC (0.25° x 0.25°) rainfall estimates are closer to the trend line in both the lower and higher values (FIG. 5).

FIG. 5. Scatterplots for observed rainfall and (a) GPCC (0.25 x 0.25) and (b) CHIRPS (0.05 x 0.05) for Katunayaka.
Then the CC, RSME and Bias values were looked into and it is evident that GPCC (0.25° x 0.25°) has outperformed CHIRPS (0.05° x 0.05°) across all months in CC with higher CC, in RSME with lower RSME. Lower bias values were also seen in majority of the months in GPCC (0.25° x 0.25°) with June and July being the only months that had higher bias values compared to CHIRPS (0.05° x 0.05°). However, the bias value was lower in GPCC (0.25° x 0.25°) when the whole May- September period was considered (Table 2).
Table 2. Correlation, RMSE and Bias values for GPCC (0.25 x 0.25) and CHIRPS (0.5 x 0.5) compared with observed rainfall data of Katunayaka station of DoM.
| Correlation | May | June | July | August | September | MJJAS |
|---|---|---|---|---|---|---|
| GPCC_P25 | 0.91 | 0.58 | 0.86 | 0.85 | 0.87 | 0.89 |
| CHIRPS_P05 | 0.65 | 0.44 | 0.52 | 0.55 | 0.66 | 0.72 |
| RSME | May | June | July | August | September | MJJAS |
| GPCC_P25 | 3.75 | 4.61 | 2.2 | 6.02 | 16.86 | 1.68 |
| CHIRPS_P05 | 7.45 | 10.68 | 20.96 | 10.42 | 2.37 | 3.4 |
| Bias | May | June | July | August | September | MJJAS |
| GPCC_P25 | 0.9 | 12.5 | 4.4 | 4.7 | 12.7 | 2.6 |
| CHIRPS_P05 | 18 | 4.7 | 0.9 | 36.9 | 26 | 16.2 |
Similarly, the scatterplot below for Sirikandura also shows a similar picture to the Katunayake station which was considered earlier. GPCC (0.25° x 0.25°) has the rainfall values closer to the trend line compared with CHIRPS (0.05° x 0.05°) (FIG. 6).

FIG. 6. Scatterplots for observed rainfall and (a) GPCC (0.25 x 0.25) and (b) CHIRPS (0.05 x 0.05) for Sirikandura station of DoM.
For this station, the CC values are higher for GPCC (0.25° x 0.25°) across all months. However, overall RSME values are lower in CHIRPS (0.05° x 0.05°) apart from the months of June and July. Bias values are lower across all months in CHIRPS (0.05° x 0.05°) (Table 3).
Table 3. Correlation, RMSE and Bias values for GPCC (0.25 x 0.25) and CHIRPS (0.5 x 0.5) compared with observed rainfall data of Sirikandura station of DoM.
| Correlation | May | June | July | August | September | MJJAS |
|---|---|---|---|---|---|---|
| GPCC_P25 | 0.62 | 0.77 | 0.83 | 0.87 | 0.73 | 0.79 |
| CHIRPS_P05 | 0.4 | 0.5 | 0.47 | 0.63 | 0.7 | 0.67 |
| RSME | May | June | July | August | September | MJJAS |
| GPCC_P25 | 49.19 | 50.21 | 13.65 | 3.25 | 24.74 | 21.99 |
| CHIRPS_P05 | 22.58 | 60.7 | 14.03 | 9 | 2.62 | 10.23 |
| Bias | May | June | July | August | September | MJJAS |
| GPCC_P25 | 172 | 90 | 86.7 | 74 | 142.8 | 116.1 |
| CHIRPS_P05 | 5.3 | 58.6 | 58.7 | 71.8 | 24.6 | 47.6 |
Considering the Dengama station, scatterplot did not show a clear picture on which is better although at lower rainfall values GPCC (0.25° x 0.25°) rainfall estimates seemed like they were closer to actual values (FIG. 2, FIG. 7).

FIG. 7. Scatterplots for observed rainfall and (a) GPCC (0.25 x 0.25) and (b) CHIRPS (0.05 x 0.05) for Denagama station of DoM.
However, looking at the CC, RSME and Bias values, it was clear that GPCC (0.25° x 0.25°) showed higher CC values across all months considered. For RSME and Bias values, GPCC (0.25° x 0.25°) still managed to be lower overall compared to CHIRPS (0.05° x 0.05°) with certain months having marginally superior values compared to GPCC (0.25° x 0.25°) (Table 4).
Table 4. Correlation, RMSE and Bias values for GPCC (0.25 x 0.25) and CHIRPS (0.5 x 0.5) compared with observed rainfall data of Denagama station of DoM
| Correlation | May | June | July | August | September | MJJAS |
|---|---|---|---|---|---|---|
| GPCC_P25 | 0.72 | 0.69 | 0.67 | 0.81 | 0.77 | 0.76 |
| CHIRPS_P05 | 0.71 | 0.32 | 0.5 | 0.65 | 0.77 | 0.68 |
| RSME | May | June | July | August | September | MJJAS |
| GPCC_P25 | 24.92 | 11.52 | 11.2 | 13.85 | 5.27 | 11.14 |
| CHIRPS_P05 | 37.15 | 0.41 | 23.19 | 3.05 | 17.75 | 16.82 |
| Bias | May | June | July | August | September | MJJAS |
| GPCC_P25 | 48.3 | 26.8 | 31.3 | 31.7 | 7.1 | 29 |
| CHIRPS_P05 | 91.2 | 29.6 | 16.9 | 7 | 1.5 | 25.8 |
Finally, Avissawella station was selected and the scatterplots for both rainfall estimates did not show major differences on the outset. However, GPCC (0.25° x 0.25°) seems to have slightly outperformed CHIRPS (0.05° x 0.05°) (FIG. 8)

FIG. 8. Scatterplots for observed rainfall and (a) GPCC (0.25 x 0.25) and (b) CHIRPS (0.05 x 0.05) for Avissawella station of DoM.
Avissawella station which is the outskirts of the Colombo district, has a higher CC value overall for GPCC (0.25° x 0.25°) although the CC values for some months were higher than its competitor. The RSME values and Bias values were also considerably lower in CHIRPS (0.05° x 0.05°) compared to GPCC (0.25° x 0.25°) (Table 5).
Table 5. Correlation, RMSE and Bias values for GPCC (0.25 x 0.25) and CHIRPS (0.5 x 0.5) compared with observed rainfall data of Avissawella station of DoM.
| Correlation | May | June | July | August | September | MJJAS |
|---|---|---|---|---|---|---|
| GPCC_P25 | 0.78 | 0.66 | 0.83 | 0.79 | 0.64 | 0.79 |
| CHIRPS_P05 | 0.79 | 0.36 | 0.67 | 0.71 | 0.69 | 0.74 |
| RSME | May | June | July | August | September | MJJAS |
| GPCC_P25 | 21.33 | 21.6 | 10.82 | 8.94 | 29.45 | 9.53 |
| CHIRPS_P05 | 10.12 | 3.02 | 27.89 | 6.06 | 4.81 | 4.58 |
| Bias | May | June | July | August | September | MJJAS |
| GPCC_P25 | 136.5 | 117.1 | 82 | 67.9 | 110 | 97.5 |
| CHIRPS_P05 | 38.9 | 16.9 | 18.5 | 14.2 | 18.5 | 1.8 |
Finally, all the seasonal values for each of the parameters for GPCC (0.25° x 0.25°) and CHIRPS (0.05° x 0.05°) for each of the rain gauge stations were assigned ranks based on its relative performance with each other and the ranks were averaged for each parameter and the overall rank was calculated (Table 6). Accordingly, it is evident here that GPCC (0.25° x 0.25°) has consistently ranked 1 for CC and it has also got the rank 1 for 3 out of the overall 5 rain gauge stations used in this comparison. However, when it came to Bias values CHIRPS (0.05° x 0.05°) had 4 out of 5 rank 1 positions.
Table 6. Assigned ranks for GPCC and CHIRPS based on its relative performance for CC, RSME and Bias for rain gauge stations in Ratnapura, Katunayaka, Sirikandura, Denagama and Avissawella.
| Ratnapura | Katunayaka | Sirikandura | Denagama | Avissawella | Overall Rank | |
|---|---|---|---|---|---|---|
| CC | ||||||
| GPCC_P25 | 1 | 1 | 1 | 1 | 1 | 1 |
| CHIRPS_P05 | 2 | 2 | 2 | 2 | 2 | 2 |
| RSME | ||||||
| GPCC_P25 | 1 | 1 | 2 | 1 | 2 | 1.4 |
| CHIRPS_P05 | 2 | 2 | 1 | 2 | 1 | 1.6 |
| Bias | ||||||
| GPCC_P25 | 2 | 1 | 2 | 2 | 2 | 1.8 |
| CHIRPS_P05 | 1 | 2 | 1 | 1 | 1 | 1.2 |
Then the overall rank for parameters CC, RSME and Bias were averaged to get a single average of the ranks. GPCC (0.25° x 0.25°) has the lower rank when all the parameters are combined while giving them equal weights (Table 7).
Table 7. Average rank which was computed by averaging the overall ranks for GPCC and CHIRPS.
| Average Rank | |
|---|---|
| GPCC_P25 | 1.4 |
| CHIRPS_P05 | 1.6 |
Summary and Conclusions
This study showed that in the initial comparison, GPCC (0.25° x 0.25°) and CHIRPS (0.05° x 0.05°) were close in representing the actual rainfall values with ranking in the top two spots in CC, RSME and bias values when compared with GPCC (0.5° x 0.5°) and ERA-5 (0.25° x 0.25°). GPCC (0.25° x 0.25°) was ranked top in the CC and RSME segments while CHIRPS (0.05° x 0.05°) topped in the bias values segment. Then in the second stage of the study only GPCC (0.25° x 0.25°) and CHIRPS (0.05° x 0.05°) were only considered with them being the top two performers. In that, further four stations were added to the study and this showed that GPCC (0.25° x 0.25°) outperformed CHIRPS (0.05° x 0.05°) in CC with having a higher correlation value across all months for all stations considered barring one month for one station in the study giving it an overall rank of 1. Even in the RSME segment, GPCC (0.25° x 0.25°) had lower values which gave it rank 1 in most occasions. Considering the stations, GPCC (0.25° x 0.25°) had 3 rank 1 position from 5 which gave it an overall rank of 1.4 compared to 1.6 of CHIRPS (0.05° x 0.05°). Bias values were a bit different with CHIRPS (0.05° x 0.05°) outperformed GPCC (0.25° x 0.25°) with four rank 1 positions compared to 1 which gave it an overall rank of 1.2. However, when all three of the factors were combined, it gave GPCC (0.25° x 0.25°) the average rank of 1.4 compared to 1.6 of CHIRPS (0.05° x 0.05°). This would mean that, considering the wet-zone of Sri Lanka, GPCC (0.25° x 0.25°) has the rainfall estimates that better represents the actual rainfall observations recorded by the Department of Meteorology, Sri Lanka.
Acknowledgements
The author expresses the special gratitude to Nanjing University of Information Science and Technology, for providing the opportunity for this study. Special appreciation goes to the Department of Meteorology, Sri Lanka, NOAA and NCEP/NCAR, ECMWF, Climate Hazards Centre for the provision of the datasets used in the study.
References
- Global facility for disaster reduction and recovery
- Punyawardena BV. Climate of Sri Lanka. In SP Nissanka and UR Sangakkara (Eds.), Proceeding of the global climate change and its impacts on agriculture, forestry and water in the tropics. 2009:7–20.
- Proceeding of the global climate change and its impacts on agriculture, forestry and water in the tropics
- Funk C, Peterson P, Landsfeld M, et al. The climate hazards infrared precipitation with stations-a new environmental record for monitoring extremes. Scientific Data. 2015;2(1):1–21.
- Schneider U, Finger P, Rustemeier E, Ziese M, Becker A. Global Precipitation Analysis Products of the GPCC. 2021.
- Hersbach H, Bell B, Berrisford P, et al. The ERA5 global reanalysis. Quarterly Journal of the Royal Meteorological Society. 2020;146(730):1999–2049.
- Wilks DS. Statistical methods in the atmospheric sciences. (3rdEdition). Academic press. 2011:704.
- Murphy AH. The coefficients of correlation and determination as measures of performance in forecast verification. In Weather and Forecasting. 1995;10(4):681-688.
- Chai T, Draxler RR. Root mean square error (RMSE) or mean absolute error (MAE)?–Arguments against avoiding RMSE in the literature. Geosci Model Dev. 2014;7(3):1247–1250.
- Lashkari A, Salehnia N, Asadi S, et al. Evaluation of different gridded rainfall datasets for rainfed wheat yield prediction in an arid environment. International Journal of Biometeorology. 2018;62(8):1543–1556.

