Research
, Volume: 18( 1)A Cross Sectional Study on the Correlation between Climate Indicators and Covid-19 Pandemic in 22 Major States of India
- *Correspondence:
- Manikanta Bhoi Department of Statistics, Central University of Odisha, Koraput, India Tel: +9107749884112; E-mail: manikantabhoi.sp@gmail.com
Received: December 27, 2021, Manuscript No. TSES-21-43568; Editor assigned: January 30, 2022; Pre QC No. TSES-21-43568 (PQ); Reviewed: January 07, 2022, QC No. TSES-21-43568; Revised: January 17, 2022, Manuscript No: TSES-21-43568 (R); Published: January 27, 2022, DOI: 10.37532/environmental-science.2022.18.210
Citation: Manikanta B. A Cross Sectional Study on the Correlation between Climate Indicators and Covid-19 Pandemic in 22 Major States of India. Environ Sci Ind J. 18(01):210
Abstract
This study aims to analyse the correlation between climate and covid-19 pandemic in 16 major states of India. This study employed a secondary data analysis of surveillance data of covid-19 from NDTV Corona Virus website (https://www.ndtv.com/coronavirus/fullcoverage) and weather from the National Centers for Environmental Information (NCEI)( https://www.ncei.noaa.gov/access/search). The components of weather include minimum temperature (0C), maximum temperature (0C), temperature average (0C), and amount of rainfall (mm). The statistics such as Spearman-rank correlation test, person correlation, Kendall correlation was used for data analysis. Among the components of the weather, only temperature average (0C), was significantly correlated with covid-19 pandemic (r=0.392; p<.01) from the month of January to May but from May to October when the rainfall comes in to picture only rainfall was significantly correlated with covid-19 pandemic (r =0.392; p<.01) . The finding serves as an input to reduce the incidence rate of covid-19 in 16 major states of India in prospective of climate factor. The findings of this study will help World Health Organization and health regulators such as Center for Disease Control (CDC) to combat COVID-19 in India and the rest of the world.
Keywords
Celosia; Drought stress; DUF538; Gene expression; Real-Time PCR
Introduction
COVID-19 pandemic probably started from Wuhan, Hubli, China while the World Health Organization (WHO) got information about it on December 31, 2020. They received information about on unidentified aetiology. The epidemic was officially named COVID-19 on February 11, 2020. It was acknowledging as an infectious disease which resulting in public health emergency, it quickly spread with in china and after spreading in china it moves to further 24 countries which are situated geographically between 42.9370840N-75.61070E [1]. After studying about the COVID-19 spread most clinical doctors and medical specialist reported that a person suffering from corona virus has difficulty in breathing and pneumonia [2,3] There are some similar clinical treatments or symptoms that are related to corona virus illness such as MERS and SARS which can cause fever, cough and difficulties in breathing due to respiratory disorder and in the worst case scenario COVID-19 can also cause kidney failure, pneumonia and even death. COVID-19 pandemic has killed large number of people around the world and it has proved that it is a deadly virus which needs to be vanish early quickly in the whole world.
COVID-19 has certain signs and symptoms which makes us realized that the corona virus inside our body that it’s acute respiratory disorder such as fever, shortness of fever and coughing. The average incubation period. Sometimes the corona virus gets vanished within 4-5 days or it can be as long as 14 days too. In saviour cases like people usually having a casual case can easily fight with corona virus and they can be relieved and they can be recovered too but if it is a serious case then it has some symptoms like heavy breathing problem, heavy fever and x-ray shows extensive pneumonia and acute respiratory syndrome. Clinical symptoms of SARS and MERS are similar to the clinical symptoms of critical and saviour patients with COVID-19.
COVID-19 pandemic kept into Indian Territory with the first case reported on 30 January 2020 which was originated directly from china. The ministry of health and family welfare have confirmed a total case of 85,940 recoveries of 30,153 people including 1 migration and 2752 deaths on 16 May 2020. The infection rate of COVID-19 in India was less the worthily affected countries like USA, China, Italy, etc. We can say that the rate of COVID-19 in India is 1.7, less than the most affected countries. The outbreak has force the school, educational institution, offices to remain close while the outbreak has declared as epidemic in many countries which are worthily affected by the disease. The provision of academic disease act 1897 is passed UN this country. Due to the pandemic India been suspended all tourist visas like USA, China, Italy and many more affected country as majority of people while migrating some those country to India as India was rarely affected at that time [4].
On 22 March 2020 under the honourable Prime Minister Narendra Modi India observes the 14 hours’ voluntary public curfew. The government followed every instruction from Prime Minister Narendra Modi and lockdown was placed in 75 district of India where COVID-19 cases were recognized. Also the government issued also in many major cities like Kolkata, Mumbai and some other cities which are densely populated were closed shutdown because of the COVID-19 pandemic situation. Later on 24th March prime minister order a nationwide lockdown for 21 days which affected the entire 1.3 billion population of India. After that the prime minister had to extend the nationwide lockdown till 3 May. But this was not enough and prime minister extend the lockdown for 2 more weeks till 17 May [5].
Extreme weather conditions are also the factor which can accompany the long term change in climate that contributes to the spread of west Nile virus in the Europe and US. The top predictors of respiratory disease such as SARS can be the certain climate conditions. A gradual change in climate is also the variable or the direct cause of biological interaction between SARS-COV and humans. The swivel and transmission of SARS virus can be determined by optimal temperature, humidity, and wind speed. Change in weather is significantly related with change in Mortality rates due to pandemic [6].
The transmission of virus by influenced by several factors climatic conditions like change in temperature and humidity and it’s also depends on density of population. Research on climatic change and COVID-19 is very limited to research will contributes to effect to prevent COVID-19 disease.
In order to study the impact of weather indicators on COVID-19 outbreak kuldip Singh and Aryan Agarwal[3] took the 6 most effective states of India that is Maharashtra, Delhi, Gujarat, Rajasthan, Madhya Pradesh and Tamilnadu and they published their whole study in paper impact of weather indicator on the COVID-19 outbreak a multifactor outbreak of India. By having a gradual look to the study made by Kuldip singh and Aryan agarwal we can find there is a heavy impact of temperature, average temperature and humidity which has positive correlation with COVID-19 in India. So we decide to check whether it is same for all 22 major state we take in our paper or not. And in there paper they take 2 to 3 months’ data so we also want to check whether it is same for 9 months’ data. So in our paper we try a cross-sectional study between the 22 state COVID-19 cases of including new cases, active case, death and recover case with respect to the climate indicators minimum temperature, maximum temperature, average temperature and PRICIP(rainfall).
Research Methodology
Study area
India is a country of Asia continent and I take the 22 states of India i.e. Maharashtra, Gujarat, Rajasthan, Goa, Kerala, Andhra Pradesh, Sikkim, Uttrakhand, Punjab, West Bengal, Arunachal Pradesh, Karnataka, Odisha, Telangana, Madhya Pradesh, Uttar Pradesh, Tripura, Tamilnadu, Assam, Bihar, Jammu and Kashmir, Delhi. Its lying entirely in the northern hemisphere, the main land extends between latitudes 804’N and 3706’N and longitudes 6807’E and 97027’E. The tropic of cancer (23030’N) divides the country in two equal parts. To the southeast and southwest of the main land lie the Andaman and Nicobar Islands in Bay of Bengal and Arabian Sea respectively. The land mass of India has an area of 3.28 million square kilometre (1,269,219 sq. mi) It measures 3214 km (1997 mi) from north to south and 2933 km (1822 mi) from east to west, It has a land boundary of about 15,200 km and the total length of the coast line of the main land including Andaman and Nicobar and Lakshadweep is 7,516.6 km. India has achieved multi-land socioeconomic progress during the last five decades. It has moved forward displaying remarkable progress in the field of agriculture, industry, technology and overall economic development. It has also contributed significantly to the making of world history according to the revision of the world population prospects in 2019 the population of India stood at 1,352,642,280 (TABLE 1).
Data collection
The computerized data set on daily covid-19 in 16 states of India of the period March 1, 2020 to November 15 , 2020 are taken from the NDTV Corona Virus Website (https://www.ndtv.com/coronavirus/fullcoverage) and weather from National Centers For Environmental Information(NCEI)(https://www.ncei.noaa.gov/access/search). The data consist of total COVID case, new COVID case, Active COVID case, deaths, total deaths, recovers, total recovers, maximum temperature, minimum temperature, average temperature, PRECIP (Rainfall) (TABLE 2 and TABLE 3) [7].
Results
Correlation tables
Table 1. Kendall correlation coefficient data.
| Kendall correlation coefficient | ||||||||||||||||
|---|---|---|---|---|---|---|---|---|---|---|---|---|---|---|---|---|
| With active case | With new case | With death | With recover | |||||||||||||
| States | A | B | C | D | A | B | C | D | A | B | C | D | A | B | C | D |
| AP | -0.3 | 0.15 | -0.1 | 0.25 | -0.3 | 17 | -0.1 | 0.25 | -0.27 | 0.15 | -0.09 | 0.23 | -0.3 | -0.13 | -0.1 | 0.25 |
| Arunachal Pradesh | 0.21 | 0.36 | 0.31 | 0.03 | 0.2 | 0.39 | 0.32 | 0.08 | 0.1 | 0.08 | 0.12 | -0.06 | 0.22 | 0.33 | 0.3 | 0.01 |
| Assam | 0.19 | 0.45 | 0.43 | -0 | 0.23 | 0.53 | 0.49 | 0.006 | 0.2 | 0.38 | 0.38 | -0.07 | 0.16 | 0.43 | 0.39 | 0.01 |
| Bihar | 0.05 | 0.4 | 0.27 | 0.12 | 0.03 | 0.4 | 0.26 | 0.14 | 0.01 | 0.26 | 0.17 | 0.07 | 0.02 | 0.35 | 0.23 | 0.12 |
| Delhi | 0.08 | 0.23 | 0.15 | -0.1 | 0.01 | 0.19 | 0.1 | -0.13 | 0.18 | 0.24 | 0.21 | 0.06 | -0.01 | 0.17 | 0.07 | -0.12 |
| Goa | -0.4 | -0.3 | -0.4 | 0.37 | -0.4 | -0.28 | -0.4 | 0.38 | -0.31 | -0.3 | -0.31 | 0.25 | -0.32 | -0.26 | -0.3 | 0.32 |
| Gujarat | -0.2 | 0.09 | -0.1 | 0.21 | -0.2 | 0.09 | -0.1 | 0.23 | 0.16 | 0.48 | 0.36 | 0.17 | -0.17 | 0.06 | -0.1 | 0.18 |
| Jammu Kashmir | 0.36 | 0.26 | 0.32 | -0.2 | 0.33 | 0.25 | 0.3 | -0.17 | 0.37 | 0.26 | 0.33 | -0.17 | 0.28 | 0.18 | 0.24 | -0.21 |
| Karnataka | -0.5 | -0.3 | -0.6 | 0.2 | -0.5 | -0.16 | -0.5 | 0.25 | -0.55 | -0.2 | -0.49 | 0.27 | 0.55 | -0.21 | -0.5 | 0.25 |
| Kerala | -0.4 | -0.4 | -0.5 | 0.04 | -0.5 | -0.39 | -0.5 | 0.05 | -0.39 | -0.3 | -0.41 | 0.01 | 0.39 | -0.35 | -0.4 | 0.04 |
| Maharashtra | -0.3 | -0.1 | -0.1 | 0.34 | -0.3 | 0.07 | -0.2 | 0.39 | -0.33 | 0.08 | 0.14 | 0.43 | -0.23 | 0.04 | -0.1 | 0.32 |
| MP | -0.1 | 0.07 | -0.1 | 0.11 | -0.2 | 0.06 | -0.1 | 0.11 | -0.15 | 0.11 | -0.03 | 0.12 | -0.2 | 0.01 | -0.1 | 0.09 |
| Odisha | -0.3 | 0.19 | -0.1 | 0.18 | -0.3 | 0.21 | -0.9 | 0.208 | -0.39 | 0.02 | -0.24 | 0.14 | -0.33 | 0.15 | -0.1 | 0.17 |
| Punjab | 0.14 | 0.3 | 0.24 | -0.1 | 0.13 | 0.34 | 0.26 | -0.07 | 0.1 | 0.3 | 0.21 | -0.1 | 0.14 | 0.3 | 0.21 | -0.11 |
| Rajasthan | -0.1 | 0.01 | -0.1 | -0 | -0.1 | 0.01 | -0.1 | -0.03 | -0.1 | 0.06 | -0.03 | 0.02 | -0.15 | -0.02 | -0.1 | 0.01 |
| Sikkim | 0.37 | 0.41 | 0.42 | 0.07 | 0.33 | 0.03 | 0.32 | -0.02 | 0.13 | 0.01 | 0.07 | -0.16 | 0.34 | 0.27 | 0.32 | -0.05 |
| Tamilnadu | -0.1 | 0.01 | -0 | 0.29 | -0.1 | 0.01 | -0 | 0.28 | -0.1 | 0.02 | -0.03 | 0.29 | -0.14 | -0 | -0.1 | 0.3 |
| Telengana | -0.5 | -0.2 | -0.4 | 0.25 | -0.4 | -0.14 | -0.3 | 0.3 | -0.41 | -0.1 | -0.29 | 0.34 | -0.47 | -0.21 | -0.4 | 0.25 |
| Tripura | 0.03 | 0.44 | 0.32 | 0.18 | 0.01 | 0.42 | 0.3 | 0.2 | 0.03 | 0.31 | 0.23 | 0.1 | 0.01 | 0.38 | 0.27 | 0.13 |
| Up | 0.07 | 0.38 | 0.27 | 0.05 | 0.06 | 0.39 | 0.28 | 0.06 | 0.07 | 0.39 | 0.28 | 0.05 | 0.05 | 0.33 | 0.23 | 0.02 |
| Uttrakhand | 0.16 | 0.31 | 0.25 | -0 | 0.12 | 0.3 | 0.25 | -0.01 | 0.06 | 0.19 | 0.13 | -0.04 | 0.1 | 0.25 | 0.19 | -0.02 |
| West Bengal | -0.2 | 0.12 | -0 | 0.02 | -0.2 | 0.13 | -0 | 0.01 | -0.12 | 0.19 | 0.05 | 0.05 | -0.16 | 0.12 | -0 | 0.01 |
Note: A: Maximum temperature, B: Minimum temperature, C: Average temperature, D: Rainfall (PRECIP), E: New cases, F: Active cases, G: Deaths, H: Recovers
Table 2. Spearman correlation coefficient data.
| Spearman correlation coefficient | ||||||||||||||||
|---|---|---|---|---|---|---|---|---|---|---|---|---|---|---|---|---|
| With active case | With new case | With death | With recover | |||||||||||||
| States | A | B | C | D | A | B | C | D | A | B | C | D | A | B | C | D |
| AP | 0.38 | 0.22 | -0.13 | 0.34 | -0.4 | 0.23 | -0.1 | 0.34 | -0.38 | 0.22 | -0.1 | 0.3 | -42 | 0.2 | -0.17 | 0.34 |
| Arunachal Pradesh | 0.3 | 0.51 | 0.44 | 0.04 | 0.28 | 0.55 | 0.45 | 0.11 | 0.13 | 0.1 | 0.14 | -0.1 | 0.3 | 0.47 | 0.42 | 0.008 |
| Assam | 0.27 | 0.65 | 0.61 | -0.02 | 0.32 | 0.73 | 0.68 | 0.006 | 0.27 | 0.53 | 0.52 | -0.1 | 0.22 | 0.62 | 0.57 | -0.01 |
| Bihar | 0.08 | 0.53 | 0.38 | 0.17 | 0.05 | 0.53 | 0.37 | 0.19 | 0 | 0.35 | 0.23 | 0.09 | 0.04 | 0.48 | 0.33 | 0.17 |
| Delhi | 0.1 | 0.28 | 0.21 | -0.17 | 0.03 | 0.23 | 0.14 | -0.18 | 0.24 | 0.31 | 0.3 | -0.1 | 0 | 0.21 | 0.12 | -0.16 |
| Goa | -0.49 | -0.36 | -0.48 | 0.42 | -0.5 | -0.37 | -0.5 | 0.45 | -0.41 | -0.3 | -0.4 | 0.28 | -0.46 | -0.3 | -0.45 | 0.38 |
| Gujarat | -0.27 | 0.13 | -0.1 | 0.28 | -0.3 | 0.12 | -0.1 | 0.31 | 0.24 | 0.66 | 0.5 | 0.21 | -0.27 | 0.08 | -0.14 | 0.24 |
| Jammu Kashmir | 0.49 | 0.28 | 0.41 | -0.25 | 0.46 | 0.28 | 0.39 | -0.22 | 0.52 | 0.35 | 0.46 | -0.2 | 0.39 | 0.16 | 0.3 | -0.27 |
| Karnataka | -0.75 | -0.29 | -0.77 | 0.25 | -0.7 | -0.18 | -0.7 | 0.31 | -0.73 | -0.2 | -0.7 | 0.33 | -0.75 | -0.2 | -0.73 | 0.31 |
| Kerala | -0.6 | -0.54 | -0.65 | 0.06 | -0.6 | -0.55 | -0.7 | 0.07 | -0.53 | -0.5 | -0.6 | 0.01 | -0.57 | -0.5 | -0.61 | 0.05 |
| Maharashtra | -0.37 | 0.08 | -0.17 | 0.47 | -0.4 | 0.1 | -0.2 | 0.54 | -0.46 | 0.13 | -0.2 | 0.58 | -0.33 | 0.07 | -0.16 | 0.44 |
| MP | -0.29 | 0.1 | -0.14 | 0.14 | -0.3 | 0.09 | -0.1 | 0.15 | -0.23 | 0.18 | -0.1 | 0.16 | -0.32 | 0.03 | -0.2 | 0.11 |
| Odisha | -0.44 | 0.29 | -0.13 | 0.26 | -0.4 | 0.3 | -0.1 | 0.27 | -0.53 | 0.03 | -0.2 | 0.18 | -0.47 | 0.23 | -0.18 | 0.24 |
| Punjab | 0.22 | 0.44 | 0.33 | -0.12 | 0.2 | 0.48 | 0.36 | -0.09 | 0.15 | 0.42 | 0.3 | 0.13 | 0.22 | 0.4 | 0.31 | -0.14 |
| Rajasthan | -0.16 | 0.03 | -0.09 | -0.03 | -0.2 | 0.01 | -0.1 | 0.05 | -0.15 | 0.1 | -0 | 0.03 | -0.2 | -0 | -0.14 | 0.007 |
| Sikkim | 0.53 | 0.6 | 0.61 | 0.1 | 0.46 | 0.42 | 0.47 | -0.03 | 0.17 | 0.01 | 0.09 | -0.2 | 0.46 | 0.4 | 0.46 | 0.07 |
| Tamilnadu | -0.2 | 0.01 | -0.08 | 0.38 | -0.2 | -0 | -0.1 | 0.37 | -0.19 | 0.02 | 0.06 | 0.37 | -0.26 | -0 | -0.13 | 0.39 |
| Telengana | -0.68 | -0.25 | -0.59 | 0.3 | -0.7 | -0.19 | -0.5 | 0.36 | -0.59 | -0.1 | 0.04 | 0.4 | -0.68 | -0.3 | -0.6 | 0.3 |
| Tripura | 0.04 | 0.61 | 0.47 | 0.25 | 0.02 | 0.6 | 0.44 | 0.26 | 0.03 | 0.4 | 0.31 | 0.12 | 0.01 | 0.55 | 0.39 | 0.17 |
| Up | 0.09 | 0.5 | 0.36 | 0.06 | 0.09 | 0.53 | 0.38 | 0.08 | 0.1 | 0.55 | 0.4 | 0.06 | 0.08 | 0.45 | 0.32 | 0.03 |
| Uttrakhand | 0.23 | 0.4 | 0.35 | -0.03 | 0.19 | 0.42 | 0.35 | -0.01 | 0.09 | 0.27 | 0.2 | -0.1 | 0.16 | 0.35 | 0.28 | -0.03 |
| West Bengal | -0.24 | 0.19 | -0.04 | 0.04 | -0.2 | 0.2 | -0 | 0.02 | -0.17 | 0.28 | 0.04 | 0.07 | -0.23 | 0.19 | -0.03 | 0.02 |
Note: A: Maximum temperature, B: Minimum temperature, C: Average temperature, D: Rainfall (PRECIP), E: New cases, F: Active cases, G: Deaths, H: Recovers
Table 3. Person correlation coefficient data.
| Person correlation coefficient | ||||||||||||||||
|---|---|---|---|---|---|---|---|---|---|---|---|---|---|---|---|---|
| With active case | With new case | With death | With recover | |||||||||||||
| States | A | B | C | D | A | B | C | D | A | B | C | D | A | B | C | D |
| AP | -0.4 | 0.15 | -0.1 | -0 | -0.3 | 0.17 | -0.12 | 0.009 | -0.33 | 0.19 | -0.1 | -0.01 | -0.37 | 0.13 | -0.2 | 0.003 |
| Arunachal Pradesh | 0.33 | 0.33 | 0.38 | -0.06 | 0.3 | 0.43 | 0.41 | -0.03 | 0.113 | 0.08 | 0.12 | -0.03 | 0.31 | 0.33 | 0.36 | -0.05 |
| Assam | 0.28 | 0.52 | 0.49 | -0.11 | 0.33 | 0.57 | 0.55 | -0.101 | 0.26 | 0.45 | 0.43 | -0.11 | 0.23 | 0.53 | 0.47 | -0.11 |
| Bihar | 0.03 | 0.39 | 0.28 | -0.07 | 0.03 | 0.42 | 0.29 | -0.06 | 0.04 | 0.27 | 0.2 | -0.06 | 0.01 | 0.36 | 0.25 | -0.06 |
| Delhi | 0.01 | 0.14 | 0.08 | -0.02 | -0.2 | -0.1 | -0.12 | -0.07 | 0.191 | 0.17 | 0.2 | 0.012 | -0.16 | -0.06 | -0.1 | -0.009 |
| Goa | -0.5 | -0.5 | -0.6 | 0.41 | -0.5 | -0.4 | -0.47 | 0.37 | -0.32 | -0.32 | -0.37 | 0.22 | -0.39 | -0.39 | -0.5 | 0.31 |
| Gujarat | -0.3 | 0.17 | -0.1 | -0.04 | -0.4 | 0.19 | -0.11 | -0.03 | 0.26 | 0.63 | 0.52 | -0.03 | -0.36 | 0.08 | -0.2 | 0.001 |
| Jammu Kashmir | 0.36 | 0.01 | 0.25 | -0.03 | 0.35 | 0.17 | 0.28 | 0.04 | 0.44 | 0.28 | 0.38 | -0.01 | 0.22 | -0.05 | 0.09 | -0.04 |
| Karnataka | -0.6 | -0.4 | -0.6 | 0.08 | -0.7 | -0.2 | -0.61 | 0.26 | -0.65 | -0.1 | -0.58 | 0.31 | -0.64 | -0.26 | -0.6 | 0.23 |
| Kerala | -0.4 | -0.4 | -0.4 | -0.03 | -0.4 | -0.4 | -0.46 | -0.05 | -0.39 | -0.39 | -0.44 | -0.03 | -0.33 | -0.34 | -0.4 | -0.05 |
| Maharashtra | -0.4 | 0.12 | -0.1 | 0.02 | -0.4 | 0.15 | -0.15 | -0.01 | -0.42 | -0.19 | -0.13 | 0.004 | -0.28 | 0.08 | -0.1 | 0.05 |
| MP | -0.3 | 0.05 | -0.2 | 0.01 | -0.3 | 0.08 | -0.12 | -0.01 | -0.23 | 0.19 | -0.02 | 0.02 | -0.26 | -0.01 | -0.2 | 0.008 |
| Odisha | -0.4 | 0.19 | -0.2 | 0.02 | -0.4 | 0.23 | -0.13 | 0.03 | -0.51 | 0.01 | -0.34 | -0.03 | -0.42 | 0.15 | -0.2 | 0.01 |
| Punjab | 0.14 | 0.35 | 0.27 | -0.1 | 0.14 | 0.39 | 0.3 | -0.09 | 0.11 | 0.34 | 0.26 | -0.09 | 0.13 | 0.27 | 0.22 | -0.1 |
| Rajasthan | -0.3 | -0.1 | -0.2 | -0.01 | -0.3 | -0.1 | -0.22 | -0.02 | -0.07 | 0.15 | 0.04 | -0.03 | -0.27 | -0.17 | -0.2 | -0.02 |
| Sikkim | -0.1 | 0.49 | -0 | -0.11 | -0 | 0.31 | -0.03 | -0.09 | -0.02 | 0.08 | -0.02 | 0.06 | -0.03 | 0.25 | -0 | -0.08 |
| Tamilnadu | -0.3 | -0.1 | -0.2 | 0.22 | -0.3 | -0.1 | -0.02 | 0.2 | -0.22 | -0.05 | -0.16 | 0.15 | -0.39 | -0.2 | -0.3 | 0.23 |
| Telengana | -0.7 | -0.4 | -0.6 | 0.24 | -0.7 | -0.3 | -0.57 | 0.32 | -0.57 | -0.07 | -0.42 | 0.4 | -0.68 | -0.37 | -0.6 | 0.24 |
| Tripura | 0.05 | 0.43 | 0.34 | -0.05 | 0.06 | 0.45 | 0.36 | -0.06 | 0.07 | 0.35 | 0.29 | -0.06 | 0.02 | 0.4 | 0.31 | -0.4 |
| Up | 0.04 | 0.36 | 0.25 | -0.04 | 0.04 | 0.43 | 0.29 | -0.03 | 0.1 | 0.48 | 0.35 | -0.03 | 0.04 | 0.32 | 0.22 | -0.04 |
| Uttrakhand | 0.12 | 0.24 | 0.21 | 0.12 | 0.11 | 0.28 | 0.24 | -0.12 | 0.07 | 0.1 | 0.09 | -0.08 | 0.1 | 0.17 | 0.15 | -0.12 |
| West Bengal | -0.2 | -0.1 | -0.1 | -0.23 | -0.2 | 0.11 | -0.06 | -0.23 | -0.18 | 0.21 | 0.02 | -0.22 | -0.23 | 0.02 | -0.1 | -0.22 |
Note: A: Maximum temperature, B: Minimum temperature, C: Average temperature, D: Rainfall (PRECIP), E: New cases, F: Active cases, G: Deaths, H: Recovers
Discussion
From the above figure shows that the occurrence of COVID-19 in the India and its 22 states shows a rapid increase. The 1st case was found in Kerala in 1-march, 2020 as our data and in some days gap it spread all over India and along with its 16 states. The most affected states as take in our data is Maharashtra, Delhi, Tamilnadu. The weather data shows that the minimum temperature in all states is 15 to 25 and maximum temperature is 35 to 45. Where we can find the average temperature in between 20 to 30. The lowest rainfall we see that is 0 mm and highest is 164 mm.
In the above we find three correlation table that is 1st is for Kendell, next is for Spearman and other is for Pearson. The above table gives us the correlation between the climate indicators such as maximum temperature, minimum temperature etc. against the new covid case, Active covid case etc. We see from the table that the new case of covid is specially correlated with the precip and minimum temperature, whereas the active case is correlated with precip and minimum temperature and the death case of covid 19 is correlated with precip and minimum temperature and recovers also depends upon precip and minimum temperature of that state [8].
In our study the climate change gives a picture of the covid 19 occurrence in the 22 state of India. We find minimum temperature and PRECIP is significantly correlated with COVID-19.Maximum temperature and the average temperatures were not significantly correlated with COVID-19 [9,10].
When we consider the state where no precip and the state where there are more precip, we find in our study that in the state where there are no precip minimum and average temperature are the two main factor for the covid total case, active case, death, and recover. But in the place where there is more rainfall there the only factor which playing an important role is precip.
Let us we consider the 22 state before June-1 and after June-1. When we divide our total data in to two parts and then we calculate correlation separately then we can find before June-1 there is less rainfall so we find there is no impact of rainfall or precip in covid-19. We find the rainfall or the precip is negatively correlated. But when rainfall comes in to picture from June-1 on words when monsoon come the covid cases is now directly correlated to rainfall.
Andhra Pradesh: Here we see the covid case is rapidly growing now a day here monsoon comes and more number of rainfall growing day by day. So here we see the rainfall is the main reason for increase in covid case, active case, Deaths, and recovers.
Arunachal Pradesh: In Arunachal Pradesh we see there is less rainfall till now and we see the covid is not so faster growing. Here we see the covid case is correlated with the minimum temperature and it plays an important role here.
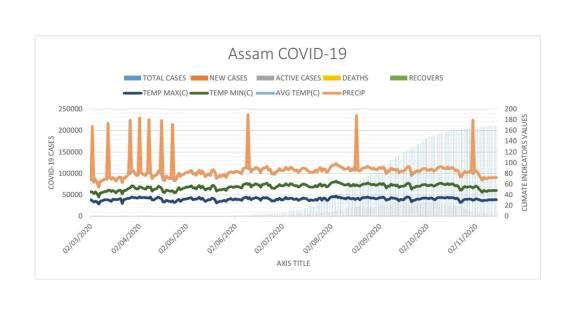
Assam: In Assam we see there is less rainfall till now and we see the covid is not so faster growing. Here we see the covid case is correlated with the minimum temperature and it plays an important role here. Similarly, for active case, death, and recovers minimum temperature is the important factor (FIG. 1).
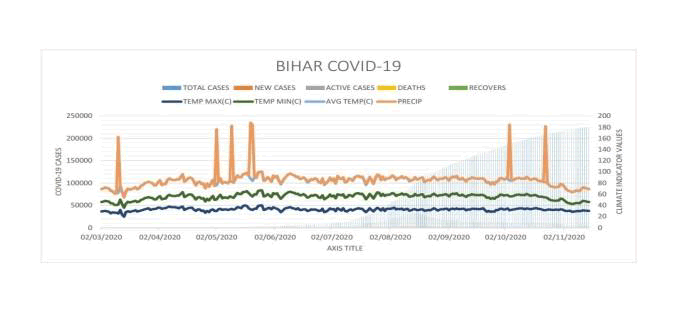
Bihar: In Bihar we see there is less rainfall till now and we see the covid is not so faster growing. The rainfall amount is less as compare to others. Here we see the covid case is correlated with the minimum temperature and it plays an important role here. Similarly for active case, death, and recovers minimum temperature is the important factor (FIG. 2).
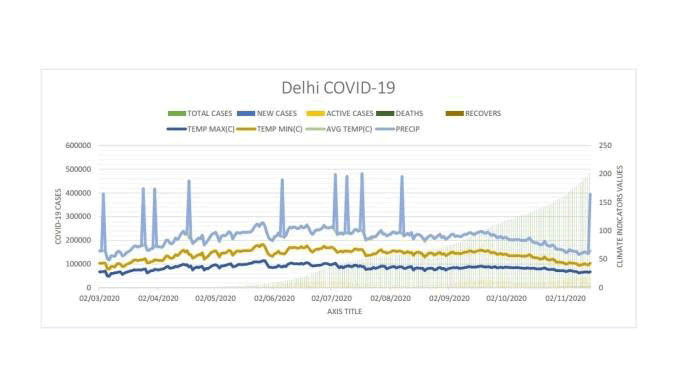
Delhi: In Delhi we see there is less rainfall till now and we see the covid is so faster growing. Here we see the covid case is correlated with the minimum temperature and it plays an important role here. If rainfall can come into picture, then we cannot control it as it is it a control position (FIG. 3).
Goa: Here in Goa we see the covid case is rapidly growing now a days and now a day here monsoon comes and more number of rainfalls growing day by day. So here we see the rainfall is the main reason for increase in covid case, active case, deaths, and recovers (FIG. 4).
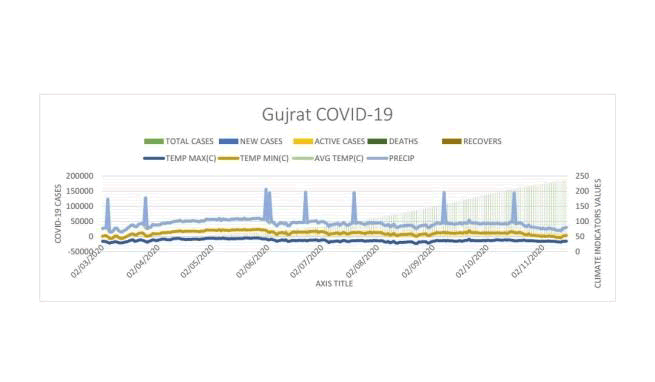
Gujarat: In Gujarat we see the covid case is rapidly growing now a days and now a day here monsoon comes and more number of rainfalls growing day by day. So here we see the rainfall is the main reason for increase in covid case, active case, deaths, and recovers (FIG. 5).
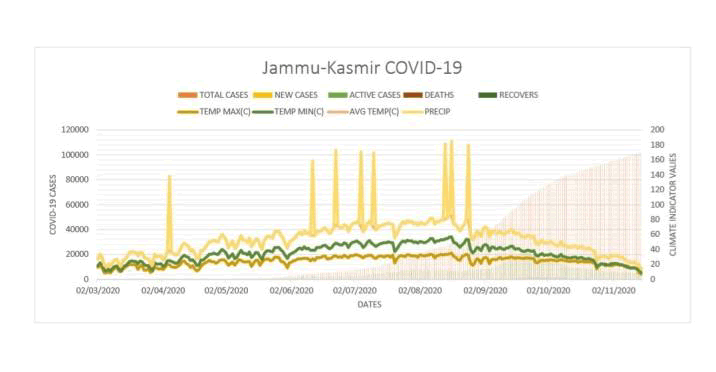
Jammu and Kashmir: In Jammu and Kashmir we see there is less rainfall till now and we see the covid is not so faster growing. Here we see the covid case is correlated with the maximum temperature and it plays an important role here. Because of less rainfall the covid situation is partially less as compare to other state (FIG. 6).
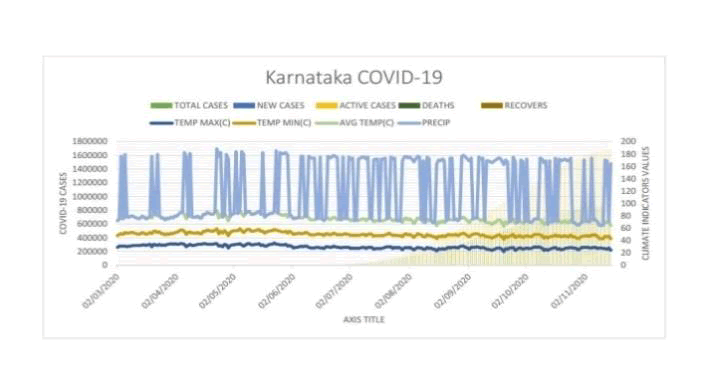
Karnataka: In Karnataka we see the covid case is rapidly growing now a days and now a day here monsoon comes and more number of rainfalls growing day by day. So here we see the rainfall is the main reason for increase in covid case, active case, deaths, and recovers (FIG. 7).
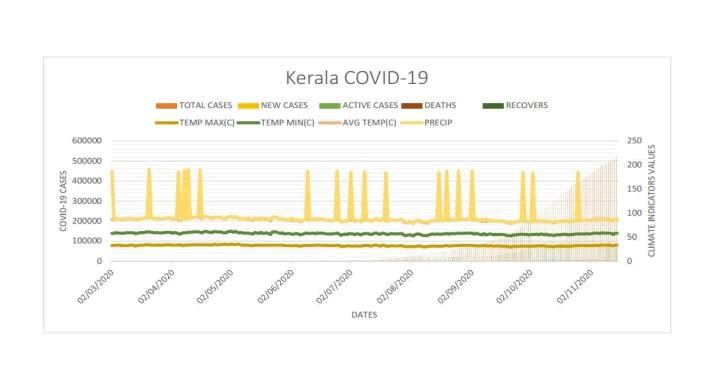
Kerala: Here we see the covid case is rapidly growing now a days here monsoon comes and more number of rainfall growing day by day. So here we see the rainfall is the main reason for increase in covid case, active case, Deaths, and recovers (FIG. 8).
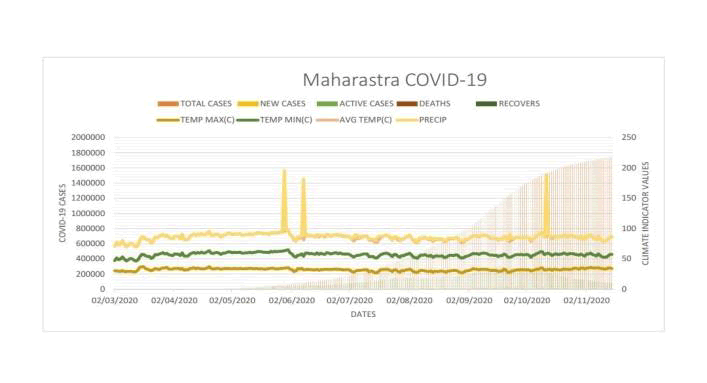
Maharashtra: Here in Maharashtra we see the covid case is rapidly growing now a days and now a day here monsoon comes and more number of rainfalls growing day by day. So here we see the rainfall is the main reason for increase in covid case, active case, deaths, and recovers. Here we also try to find the correlation with minimum temperature but we find that when rainfall cone the minimum temperature role is becomes less (FIG. 9).
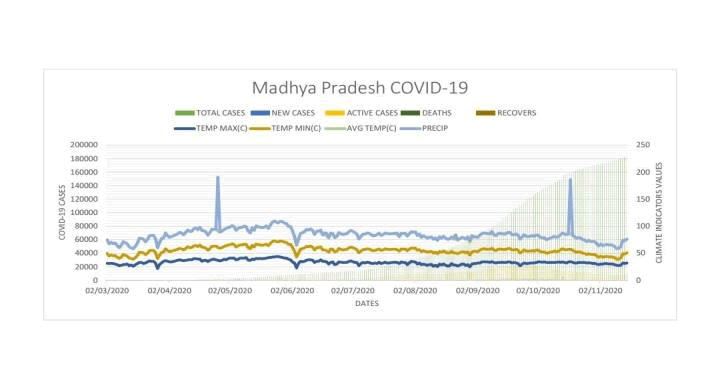
Madhya Pradesh: In Madhya Pradesh we see the covid case is rapidly growing now a day and now a days here monsoon comes and more number of rainfall growing day by day. So here we see the rainfall is the main reason for increase in covid case, active case, deaths, and recovers (FIG. 10).
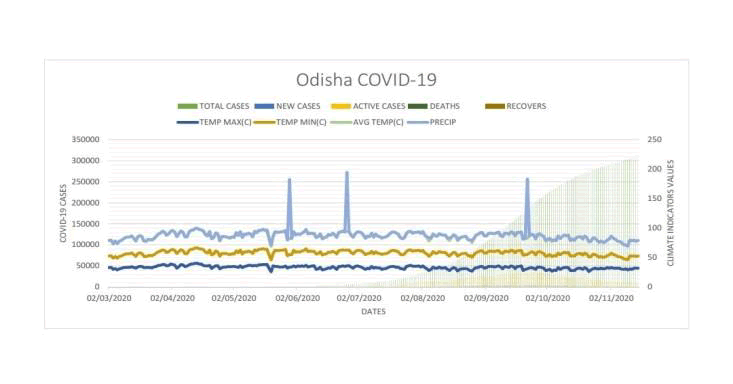
Odisha: In Odisha we see there is less rainfall till now and we see the covid is so faster growing. Here we see the covid case is correlated with the minimum temperature and it plays an important role here. If rainfall comes in to the picture, then the covid case become more as compare to other state (FIG. 11).
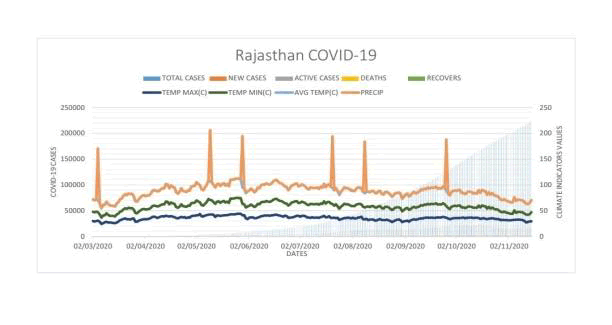
Rajasthan: In Rajasthan we see there is less rainfall till now and we see the covid is not so faster growing. Here we see the covid case is correlated with the minimum temperature and it plays an important role here. Here rainfall is not playing any role because here rain comes in 10-12 day’s interval (FIG. 12).
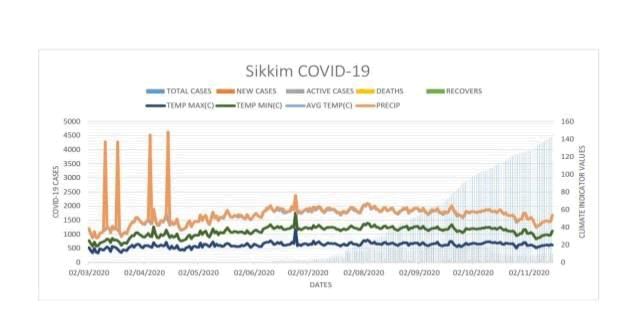
Sikkim: In Sikkim we see there is less rainfall till now and we see the covid is not so faster growing. Here we see the covid case is correlated with the average temperature and it plays an important role here. Similarly, for active case, death, and recovers average temperature is the important factor (FIG. 13).
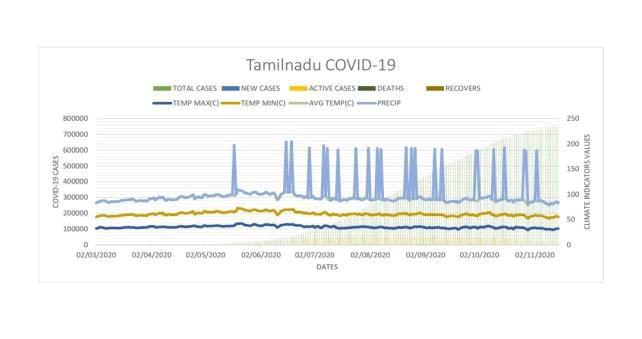
Tamilnadu: Here we see the covid case is rapidly growing now a day and now a day here monsoon comes and more number of rainfalls growing day by day. So here we see the rainfall is the main reason for increase in covid case, active case, deaths, and recovers (FIG. 14).
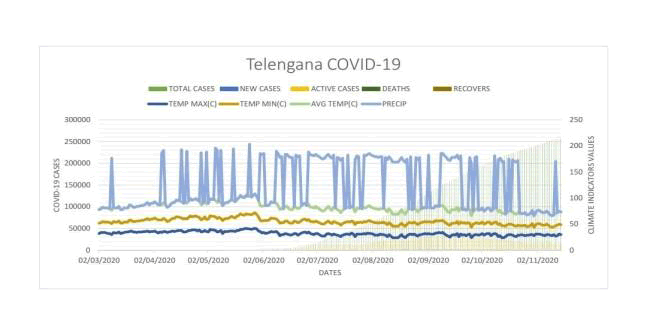
Telangana: Here in Telangana see the covid case is rapidly growing now a days and now a day here monsoon comes and more number of rainfalls growing day by day. So here we see the rainfall is the main reason for increase in covid case, active case, Deaths, and recovers. Because of rain now a days covid cases is growing more as compare to before June-1 (FIG. 15).
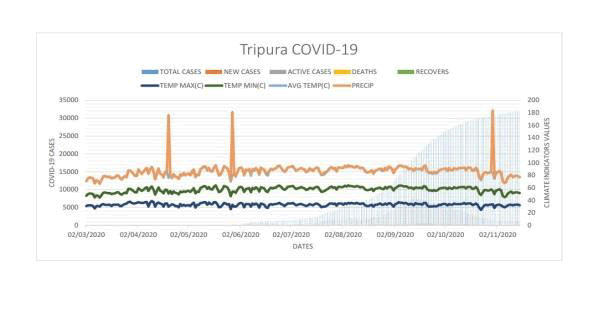
Tripura: In Tripura we see there is less rainfall till now and we see the covid is not so faster growing. Here we see the covid case is correlated with the minimum temperature and it plays an important role here. Similarly, for active case, death, and recovers minimum temperature is the important factor (FIG. 16).
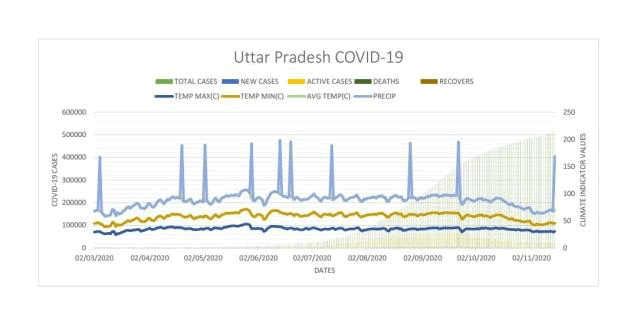
Uttar Pradesh: In Uttar Pradesh we see there is less rainfall till now and we see the covid is not so faster growing. Here we see the covid case is correlated with the minimum temperature and it plays an important role here. If rainfall comes in to the picture then the covid case become more as compare to other state (FIG. 17).
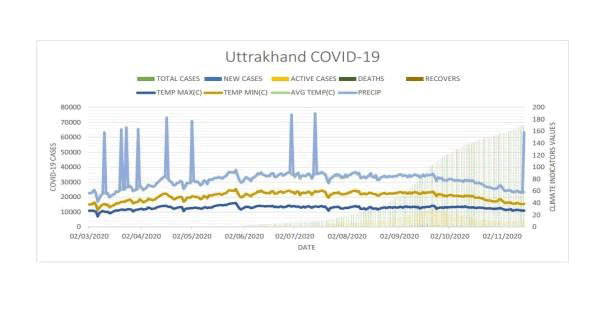
Uttrakhand: In Uttrakhand we see there is less rainfall till now and we see the covid is not so faster growing. Here we see the covid case is correlated with the minimum temperature and it plays an important role here. Here rainfall is not playing any role because here rain comes in 10-12 days’ interval (FIG. 18).
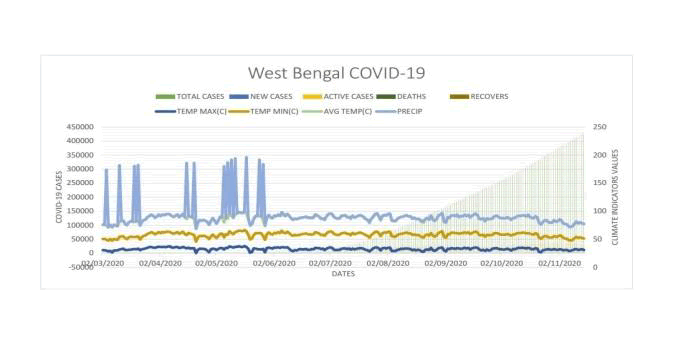
West Bengal: In West Bengal we see there is less rainfall till now and we see the covid is not so faster growing. Here we see the covid case is correlated with the minimum temperature and it plays an important role here. Similarly, for active case, death, and recovers minimum temperature is the important factor (FIG. 19).
Instead of the weather, the high covid-19 cases in India are also caused by the very high mobility of the people. As the capital city of India, Delhi, Maharashtra, Tamilnadu is the main economic destination for job seekers who come from various regions in India. Delhi, Maharashtra, Tamilnadu population density is also very high and this allows Covid-19 transmission to be very fast.
The covid case in state Kerala, Goa, Telangana etc. are gradually decreasing because the Govt. of that state is started early lockdown, quarantine to the people comes from outside of the country, raid corona testing is plays an important role in decreasing of covid case there. People of that states also follow the govt. Rules properly and quarantine themselves in their homes during lockdown period.
The covid cases in Delhi, Maharashtra, Gujarat, Rajasthan are now not in control. The spreading of covid is rapidly increasing there. The main problem of there is the Muslim get together in Delhi. Many muslim people all over the world join there and its play a major role in spreading of covid 19 in India and it’s all state. Now the covid case is gradually increasing in Odisha also because all people of Odisha who are working in other states are coming now in huge number to Odisha and that people comes from other red zone states are now suffering with COVID-19 in Odisha which is a very big issue now.
The significant finding of the weather on covid-19, this study has limitations: First, as the disease is caused by the virus, many factors are needed to be investigated such as virus resistance, population mobility, and population endurance. Second, individual health factors such as hand washing habits, personal hygiene, and use of hand sanitizers may be the other related factors of covid-19 that are necessary to be explored. However, this study is just the preliminary analysis. The strong conclusion requires time and a long data set
Conclusion
The Climate indicator is an important factor in determining the incidence rate of covid-19 in The India and its 22 states. Climate Indicator are integral in the fight against covid casein India. PRICIP and the Temperature minimum were significantly correlated with covid-19. Our findings can be used as an input in reducing Covid-19 disease in India along with its 22 states. Previously we see in the paper “Impact of weather indicator on the COVID-19 outbreak: A multi-state study in India” by Kuldeep Singh and Aryan Agarwal they said that there is a correlation of average temperature and humidity with COVID-19 in India. But in our paper we find that it is not so while we are taking a data for 4 month and more. Because in that time no rainfall effect was there but when monsoon enter India we see COVID-19 case is increasing rapidly as compare to before monsoon. So we see minimum temperature and PRICIP playing important role in COVID-19 outbreak while we taking large data.
References
- Anderson RM, Heesterbeek H, Klinkenberg D, et al. How will country-based mitigation measures influence the course of the COVID-19 epidemic?. The Lancet. 2020;395(1028):931-34.
[Crossref] [Google Scholar] [Indexed]
- Chen B, Liang H, Yuan X, et al. Roles of meteorological conditions in COVID-19 transmission on a worldwide scale. Med Rxiv. 2020.
- Guo XJ, Zhang H, Zeng YP. Transmissibility of COVID-19 in 11 major cities in China and its association with temperature and humidity. Infect Dis Poverty. 2020; 9:87.
[Crossref] [Google Scholar] [Indexed]
- Kuldeep S, Aryan A. Impact of weather indicator on the COVID-19 outbreak: A multi-state study in India. Med Rix. 2020.
- Poole L. Seasonal influences on the spread of SARS-Cov-2 (COVID19), causality, and forecastabililty (3-15-2020). SSRN. 2020.
- Bull GM. The weather and deaths from pneumonia. The Lancet. 1980;315:1405-08.
[Crossref] [Google Scholar] [Indexed]
- Shi P, Dong Y, Yan H, et al. The impact of temperature and absolute humidity on the coronavirus disease 2019 (COVID- 19) outbreak-evidence from China. Med Rxiv. 2020.
- Tan J, Mu L, Huang J, et al. An initial investigation of the association between the SARS outbreak and weather: With the view of the environmental temperature and its variation. J Epidemiol Community Health. 2005;59(3):186-192.
[Crossref] [Google Scholar] [Indexed]
- Yuan J, Yun H, Lan W, et al. A climatologic investigation of the SARS-Cov outbreak in Beijing, China. Am J Infect Control. 2006;34(4):234-36.
[Crossref] [Google Scholar] [Indexed]
- Ma Y, Zhao Y, Liu J, et al. Effects of temperature variation and humidity on the mortality of covid-19 in Wuhan. Med Rxiv. 2020.
[Crossref] [Google Scholar] [Indexed]
