Original Article
, Volume: 13( 6)Environmental Impact Due to Coal Production and Utilization
- *Correspondence:
- Mubarak F Radiation Protection Department, Nuclear Research Center, Atomic Energy Authority, Cairo, Egypt
Tel: +2022876033; E-mail: fawziamubarak@yahoo.com
Received Date: November 20, 2017 Accepted Date: December 16, 2017 Published Date: December 19, 2017
Citation: Mubarak F, Elywa M, Sanad E. Environmental Impact Due to Coal Production and Utilization. Environ Sci Ind J. 2017;13(6):157
Abstract
Different samples of local and imported charcoal, soil and wood were collected from and around traditional charcoal kilns which based on earth pit designs. Samples were analyzed using HPGe detector. According to the obtained concentrations, human risk and environmental effects was estimated. External equivalent and effective dose were estimated using (DFEXT codes). Internal hazard index (Hin), alpha index (Iα), representative level index (RLI), outdoor absorbed gamma dose rate (Dout), annual effective dose (Eout) and excess life time cancer (ELCR) were estimated. Results show that skin receive the highest external exposure while, pancreas received the lowest value. Hin due to charcoal and soil samples was permissible when compared to the recommended value (Hin must be ≤ 1). A simple comparison between activity concentrations of local and imported charcoal was investigated. Elemental analysis was carried out using x-ray technique. Charcoal contains several elements, including calcium, potassium, Silicon, titanium, manganese, aluminum, iron, zirconium, strontium, copper, rubidium, arsenic and sulfur. Gross beta activity concentrations for charcoal samples were determined.
Keywords
Charcoal; x-ray; Elemental analysis; Gamma spectroscopy; Beta spectroscopy; DFEXT code; NORM; Internal hazards indices
Introduction
In Egypt there are more than 2,000 traditional charcoal kilns which based on earth pit designs that use low-cost but inefficient conversional techniques. This is an old technique for wood carbonization by covering the carbonizing wood with layers of straw and soil to control the flow of air to prevent complete combustion. A pit of 0.8 m-1.2 m deep, 6 m-12 m long and 3 m-5 m wide is excavated in the ground and usually lined with rice straw to prevent the soil pollution. The pit is loaded with wood and all spaces between the larger logs are filled with smaller diameter wood to increase the efficiency of the charge and to prevent the production of brands that may be occur due to the flow of gases from one end of the kiln to the other. Air intake holes are set into the charge at the firing end. The wood is then covered with a 0.1 m-0.2 m layer of straw followed by a layer of soil 0.15 m-0.2 m thick. Wood is fired at the wider end of the pit where the air intake holes have been formed into the bottom of the pit side to permit the air enter from below the wood charge and upper these down holes another hole are formed in the earth cover to permit the wood gases to flow through to the atmosphere to assist carbonization. Once carbonization has been completed, the carbonized wood is damped down with water to douse any fire remaining and to prevent leaked air from causing fires that would burn the charcoal to ash. Care is needed to separate the charcoal from the soil cover without damaging the charcoal. Care should also be taken to minimize the contamination of charcoal with soil. Charcoal contains many elements such as magnesium, iron, aluminum, sulfur, calcium, selenium, arsenic, cadmium, lead and potassium. Some trace elements in charcoal are naturally radioactive, uranium (U), thorium (Th) and their numerous decay products, including radium (Ra) and radon (Rn). Potential hazards from charcoal to human come from inhalation or ingestion of fine particulates. There are many environmental effects due to it in nearby air, soil and hence to human [1-6].
In this study, naturally occurring radionuclides concentrations in charcoal, raw materials (wood) and the surrounding soil from local kiln in Egyptian Zagazig city, were calculated. The associated human risk and environmental effects due to this industry and the utilization of charcoal are discussed to take necessary radiological and dosimetric measures for saving workers and public in these fields.
Materials and Methods
Sampling collection sites
The study area (Figure 1) located in Egyptian Zagazig city in Sharkia governorate it is widely enough for collecting, storing and drying wood that used as a raw material for charcoal production. The emissions flow in all directions and dispersed through atmosphere and deposited into soil.

Figure 1: Map of study area in Egyptian Zagazig city.
Samples collection
A total of twenty-six samples were collected for this study. Four wooden samples from which charcoal was manufactured were collected? Ten soil samples (from the surface layer, at a depth of 30 cm, at a depth of 60 cm and at a depth of 90 cm inside the kiln and from the surrounding farming land at different distances easterly and westerly). Eight local charcoal samples were collected from a traditional Egypt charcoal kiln. Four imported charcoal comes from England, China, Vietnam and Indonesia were gathered from different markets.
Samples preparation and measurement
Charcoal, soil and wood samples dried in an oven at 378°K (105°C) for about 24 h to remove the water and moisture. They manually grined, about 300 ml from each sample was mixed thoroughly and weighed using a digital balance and packed in plastic cylindrical containers of uniform size. The plastic containers sealed tightly with caps and wrapped with thick cellotape around their screw necks to make them air tight depending on the density of the sample. The wood samples sawed by using an electrical saw and weighed then packed in plastic containers. All samples kept for more than four weeks to attain secular equilibrium between Ra-226 and its progenies to be achieved before gamma spectroscopy. For Gamma spectrometry a P-type coaxial HPGe detector, Canberra model no. CPVD 30-3020, shielded by 10 cm Pb thickness, 1 mm Cd and 1 mm Cu, with a relative efficiency of 30% and a resolution full width at half maximum (FWHM) of 2.1 keV at 1.33 MeV (with associated electronics) connected to multi-channel analyzer (MCA) and coupled with software program Genie 2000, was used. The main advantages required for such detector is high efficiency, high-energy resolution, very low background and nondestructive analytical. Especially the background features of the system are of considerable importance, as they must be known in order to get an estimate of the detection limits and the minimum detectable activity. Efficiency calibration of the system was carried out by using secondary standard sources (RGU-1, 400 μg/g of U-238) and (RGTh-1, 800 μg/g of Th-232) produced from IAEA. The activity of 226Ra and 232Th was determined via their decay products: 214Bi (609, 1120 and 1764 keV), 214Pb (352 and 295 keV) and 228Ac (338 and 911 keV), respectively. 235U was determined via 185.7 keV corrected for 226Ra. 238U was determined via234Pa (t1/2=1.17 min, 1001keV). The activities of 40K were determined from its 1460 keV γ- energy [7-12]. For background measurements pure silica was also poured to similar jar up to the same height as sample. Gamma spectrum for each sample and background were accumulated for about 24 h.
Calculations of activity and other radiation indices
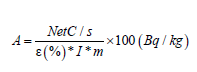
Activity concentrations: Activity concentrations of mentioned radionuclides in the measured samples were then computed by using Equation 1 and expressed in (Bq/kg) as:
 (1)
(1)
Where net c/s is the net counts per second, (I) is branching ratio for the specific energy, ε (%) is absolute photo peak efficiency of the detector at specific energy, m, is the mass of the sample in kg.
External exposure assessment: Organ doses from external irradiation were calculated according to (DFEXT code) in which dose coefficients were computed during the preparation of Federal Guidance Report No. 12 [13].
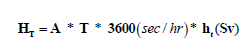
Where, the summation extends over the organs/tissues with explicit the tissue weighting factor (WT), while Wrem is the weighting factor for the remainder (0.2) and hrem is the committed dose equivalent per unit integrated exposure for the remainder tissues, it is given as:  rem t h 1 5 h . From these coefficients, equivalent dose (HT) to any organ from raw materials can be calculated as follow [14]:
 (2)
(2)
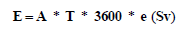
Where, A: activity concentration of raw material (Bq/m3), T: exposure time (8 hr/d * 5 d/week *50 week/year), ht: equivalent dose in tissue t per unit integrated exposure (Sv m3/sec Bq), the effective dose (E) can be calculated as follow:
 (3)
(3)
Where, e (Svm3/secBq) is the effective dose per unit integrated exposure computed as 
Internal and external hazards indices
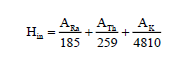
Internal hazard indices: The internal exposure to carcinogenic radon and its short-lived progeny was quantified by the internal hazard index (Hin) given by the expression:
 (4)
(4)
Where, ARa, ATh and AK are the activity concentrations (Bq/kg) of Ra-226, Th-232 and K-40 respectively. For safe, Hin must be less than or equal to unity.
Alpha index Iα: From the radon inhalation, which originates from naturally occurring radionuclides, the excess alpha radiation is calculated using the following equation [15,16]:
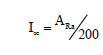 (5)
(5)
Where, 200 is the recommended maximum concentration (Bq/kg) of Ra-226.
Representative level index (RLI): Activity concentration of gamma due to NORM can be used as hazards indicator by calculation of Representative Level Index (RLI) which must be unity [17]. RLI can be calculated as:
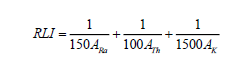 (6)
(6)
Outdoor absorbed gamma dose rate (Dout): The outdoor absorbed dose rate due to NORM originated from charcoal which distributed homogenously in a huge amount inside the kiln (usually an open area) can be calculated as [18,19]:
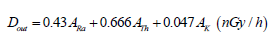 (7)
(7)
Annual effective dose (Eout): The annual effective dose due to gamma radiation can be calculated as:
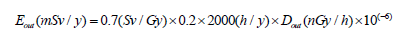 (8)
(8)
Where 0.7 SvGy-1 is a factor for converting absorbed dose in air to effective dose, 0.2 is the outdoor occupancy factor and a working time of 2000 hours/year [20-22].
Excess life time cancer (ELCR): Excess Life Time Cancer can be calculated according to annual calculated effective dose (E) as follow [14]:
 (9)
(9)
Where, LE is the life expectancy (70 years) and RF (Sv-1) is fatal risk factor per Sv, which equal 0.05 for stochastic effects.
Gross beta spectroscopy
A phoswich detector (phosphor sandwich-Tennelec Model/L.B. 1000) was used for gross beta detection in charcoal samples. It is a combination of two detectors for simultaneous gross counting of alpha, beta and gamma. This system consists of, a CaF2 (Eu) scintillator for alpha detection and NaI (Tl) for beta and gamma detection. CaF2 (Eu) is a highly efficiency detector comparing with NaI (Tl), but it is found in a polycrystalline powder form, so, it is only used to detect heavy ions or alpha particles. The scintillation layers were optically coupled to a single PMT with an integrating preamplifier. Then rising pulses from the preamplifier were digitally captured and analyzed [23-25].
Charcoal samples were manually grined, weighed (½gram of each sample), dried in an oven at 378°K (105°C) for about 6 hours to remove the water and moisture and then background and each sample was counted twice for 30 min. Calibration of the detector was carried out by putting 0.5 gm of thorium standard powder (activity=3.26 Bq/gm) in planchet and was counted for 30 min and the efficiency of detector can be determined from the relation:
 (10)
(10)
Where, Ε is the Counting efficiency, A is the activity in Bq/kg (3260 Bq/kg), Net c/s is the counts of sample minus counts of background and m is the mass of sample in kg.
 (11)
(11)
X-ray fluorescence (XRF)
XRF is a non-destructive method of quantitative element analysis used to determine essential and trace elements coverage range from sodium to uranium. In this technique the X-ray beam removes electrons from the inner shells of an element; this inner gap is filled by electrons from an outer shell. The falling electrons emit energy (‘fluorescence’) at wavelengths that are distinctive to each element. The energy produced by cascading electrons is measured by a detector, giving spectrum (as shown in Figure 2-5) from which element concentrations can be calculated in milligrams per kilogram (mg/kg) [26-28]. The JSX-3222 analyzer used to analyze 5 samples (local and imported charcoal) qualitatively and quantitatively. Qualitative analysis can be made by investigating the wavelengths of the fluorescence X-rays and quantitative analysis by investigating the X-ray dose. This element analyzer has been improved in performance such as sensitivity for light elements, energy resolution, quantitative accuracy and also in the ease of maintenance (JEOL LTD).

Figure 2: Total annual equivalent dose and effective dose due to different samples (mSv/y).

Figure 3: XRF spectrum for local charcoal sample (C2).

Figure 4: XRF spectrum of Chinese charcoal sample (C10).

Figure 5: XRF spectrum for Indonesian charcoal sample (C11).
Results and Discussion
Tables 1-5 show the average activity concentrations of local and imported charcoal, soil and wood samples. From Tables 1 and 2, we can conclude that the average activity concentration of U-238, Th-232 and K-40 are higher for imported charcoal compared with local charcoal. Charcoal imported from England show the highest activity concentration for the three radionuclides.
| Sample | U-238 | Th-232 | K-40 |
|---|---|---|---|
| C1 | 2.9 ± 1.0 | 1.6 ± 0.5 | 381.2 ± 11.4 |
| C2 | 1.3 ± 0.4 | 1.1 ± 0.3 | 81.7 ± 4.1 |
| C3 | 1.7 ± 0.5 | BDL* | 171.5 ± 5.2 |
| C4 | 2.8 ± 0.9 | BDL | 214.8 ± 8.6 |
| C5 | 2.8 ± 0.8 | 2.6 ± 1.3 | 31.0 ± 1.6 |
| C6 | 0.6 ± 0.1 | 1.3 ± 0.4 | BDL |
| C7 | 4.4 ± 2.4 | 2.0 ± 1.1 | 155.0 ± 9.3 |
| C8 | 2.5 ± 1.1 | 2.8 ± 0.9 | 221.9 ± 6.7 |
| Average | 2.4 ± 1.2 | 1.9 ± 0.7 | 179.6 ± 112.6 |
| Range | 0.6-4.4 | 1.1-2.8 | 31-381.2 |
*Non-detectable activity (below detection limits)
Table 1. Average activity concentration of local charcoal samples (Bq/kg).
| Samples | U-238 | Th-232 | K-40 |
|---|---|---|---|
| C9 (England) | 9.0 ± 2.1 | 3.1 ± 0.9 | 256.7 ± 7.7 |
| C10 (Chinese) | 4.4 ± 2.3 | 2.9 ± 1.6 | 169.5 ± 13.0 |
| C11 (Indonesia) | 4.7 ± 1.8 | 3.6 ± 1.4 | 211.3 ± 6.3 |
| C12 (Vietnam) | 1.6 ± 0.5 | 1.8 ± 0.5 | 189.4 ± 5.7 |
| Range | 1.6-9 | 1.8-3.6 | 169.5-256.7 |
Table 2. Average activity concentration of imported charcoal samples (Bq/kg).
| Samples | U-238 | Th-232 | K-40 |
|---|---|---|---|
| S1 | 14.2 ± 3.7 | 16.7 ± 5.9 | 298.2 ± 8.9 |
| S2 | 16.0 ± 4.9 | 15.3 ± 4.5 | 51.6 ± 3.1 |
| S3 | 11.7 ± 3.8 | 14.4 ± 5.9 | 252.2 ± 5.0 |
| S4 | 3.2 ± 1.8 | 5.1 ± 2.1 | 87.0 ± 6.1 |
| Average | 11.3 | 12.9 | 172.3 |
| Range | 3.2-16.0 | 5.1-16.7 | 51.6-298.2 |
Table 3. Average activity concentration of soil samples (inside the kiln) (Bq/kg).
| Samples | U-238 | Th-232 | K-40 |
|---|---|---|---|
| S5 | 6.4 ± 2.4 | 5.7 ± 1.8 | 251.8 ± 12.6 |
| S6 | 5.8 ± 1.8 | 7.3 ± 2.6 | 115.9 ± 2.3 |
| S7 | 6.4 ± 2.9 | 11.4 ± 6.0 | 161.6 ± 8.1 |
| S8 | 10.2 ± 2.9 | 9.2 ± 3.8 | 130.2 ± 6.5 |
| S9 | 7.2 ± 2.3 | 7.3 ± 2.2 | 143.3 ± 8.6 |
| S10 | 3.2 ± 0.9 | 1.6 ± 0.4 | 90.5 ± 6.3 |
| Average | 6.5 | 7.1 | 148.9 |
| Range | 3.2-10.2 | 1.6-11.4 | 90.5-251.6 |
Table 4. Average activity concentration of soil samples (around the kiln) (Bq/kg).
| Samples | U-238 | Th-232 | K-40 |
|---|---|---|---|
| P1 | 7.0 ± 3.6 | 4.6 ± 2.9 | 374.7 ± 9.9 |
| P2 | 1.0 ± 0.3 | BDL | 260.6 ± 7.8 |
| P3 | BDL | BDL | 189.1 ± 7.6 |
| P4 | BDL | BDL | 312.9 ± 6.3 |
| P5 | 13.1 ± 3.9 | 5.1 ± 2.1 | 340.5 ± 6.8 |
| P6 | BDL | BDL | 159.4 ± 3.2 |
| P7 | 18.0 ± 2.3 | 12.4 ± 2.2 | 343.6 ± 6.9 |
| P8 | BDL | BDL | 394.6 ± 11.8 |
| P9 | BDL | 3.2 ± 0.9 | 359.4 ± 7.2 |
| P10 | 20.1 ± 3.8 | 7.2 ± 3.8 | 383.5 ± 11.5 |
| P11 | 3.5 ± 1.0 | 1.5 ± 0.5 | 340.8 ± 6.8 |
| P12 | 18.2 ± 5.5 | 6.8 ± 2.1 | 381.4 ± 7.6 |
| Average | 6.7 | 3.4 | 320.0 |
| Range | 1-20.1 | 1.5-12.4 | 159.4-394.6 |
Table 5. Average activity concentration of plant samples (Bq/kg).
Soil samples (inside the kiln) have activity concentrations ranged between 3.2-16.0, 5.1-16.7 and 51.6-298.2 (Bq/kg) for U-238, Th-232 and K-40 respectively as shown in Table 3. While soil samples (around the kiln) have activity concentrations ranged between 3.2-10.2, 1.6-11.4 and 90.5-251.6 (Bq/kg) for U-238, Th-232 and K-40; respectively as shown in Table 4. We can conclude that the difference in activity concentrations for all radionuclides inside the kiln slightly exceed the outside concentrations, this is may be due to deposition of charcoal dust on ground inside the kilns. Wood samples from which charcoal were produced have activity concentrations of U-238, Th-232 and K-40 ranged between 2.1-9.1, 6.4-8.6 and 28.8-83.1 (Bq/kg); respectively as shown in Table 5.
Table 6 shows the annual equivalent to different organs and effective dose due to occupational exposure of workers in local kilns. Results show that skin receive the highest external equivalent dose with value of 1.19E-03 due to the three primordial radionuclides, while, the lowest value of 5.55E-04 was received by the pancreas. We can conclude that the annual effective dose according to charcoal exposure still below the permissible level.
| Samples | U-238 | Th-232 | K-40 |
|---|---|---|---|
| W1 | 9.1 ± 0.6 | 8.6 ± 0.7 | 28.8 ± 1.7 |
| W2 | 2.1 ± 0.2 | 6.4 ± 0.7 | 83.1 ± 5.8 |
| W3 | 7.1 ± 0.9 | 6.8 ± 0.9 | 46.2 ± 3.2 |
| W4 | 6.2 ± 0.6 | 7.8 ± 1.1 | 61.4 ± 2.5 |
| Average | 6.13 ± 2.9 | 7.4 ± 0.9 | 54.9 ± 23.1 |
| Range | 2.1-9.1 | 6.4-8.6 | 28.8-83.1 |
Table 6. Average activity concentration of wood samples (Bq/kg).
Table 7 shows the outdoor equivalent and effective dose due to charcoal and soil samples. Results show that effective dose still below the permissible limits. Table 8 shows the internal index and RLI due to NORM in charcoal and soil inside kilns. Table 9 shows the alpha index due to charcoal and soil inside kilns.
| Organ | U-238 | Th-232 | K-40 | Sum. |
|---|---|---|---|---|
| R Marrow | 7.55E-10 | 2.80E-09 | 6.08E-04 | 6.08E-04 |
| Adrenals | 5.23E-10 | 2.45E-09 | 6.93E-04 | 6.93E-04 |
| B Surface | 4.56E-09 | 1.17E-08 | 6.21E-04 | 6.21E-04 |
| Brain | 5.92E-10 | 2.85E-09 | 6.11E-04 | 6.11E-04 |
| Breast | 3.65E-09 | 4.64E-09 | 5.95E-04 | 5.95E-04 |
| G Bladder | 5.01E-10 | 2.42E-09 | 5.60E-04 | 5.60E-04 |
| Esophagus | 3.63E-10 | 2.14E-09 | 6.56E-04 | 6.56E-04 |
| ST Wall | 6.77E-10 | 2.83E-09 | 6.51E-04 | 6.51E-04 |
| SI Wall | 4.59E-10 | 2.36E-09 | 6.43E-04 | 6.43E-04 |
| ULI Wall | 5.17E-10 | 2.51E-09 | 5.79E-04 | 5.79E-04 |
| LLI Wall | 4.91E-10 | 2.46E-09 | 5.81E-04 | 5.81E-04 |
| Heart | 6.19E-10 | 2.72E-09 | 5.92E-04 | 5.92E-04 |
| Kidneys | 8.03E-10 | 2.93E-09 | 6.08E-04 | 6.08E-04 |
| Liver | 6.80E-10 | 2.88E-09 | 6.03E-04 | 6.03E-04 |
| Lungs | 8.08E-10 | 3.25E-09 | 6.48E-04 | 6.48E-04 |
| Ovaries | 4.48E-10 | 2.28E-09 | 5.76E-04 | 5.76E-04 |
| Pancreas | 4.21E-10 | 2.31E-09 | 5.55E-04 | 5.55E-04 |
| Skin | 1.23E-08 | 7.65E-09 | 1.19E-03 | 1.19E-03 |
| Spleen | 6.64E-10 | 2.88E-09 | 6.08E-04 | 6.08E-04 |
| Testes | 2.83E-09 | 4.24E-09 | 6.93E-04 | 6.93E-04 |
| Thymus | 8.19E-10 | 3.09E-09 | 6.21E-04 | 6.21E-04 |
| Thyroid | 1.01E-09 | 3.12E-09 | 6.11E-04 | 6.11E-04 |
| U Bladder | 6.56E-10 | 2.75E-09 | 5.95E-04 | 5.95E-04 |
| Uterus | 4.35E-10 | 2.31E-09 | 5.60E-04 | 5.60E-04 |
| Muscle | 1.96E-09 | 3.57E-09 | 6.56E-04 | 6.56E-04 |
| h_rem | 1.82E-09 | 3.49E-09 | 6.51E-04 | 6.51E-04 |
| E | 1.47E-09 | 3.33E-09 | 6.43E-04 | 6.43E-04 |
Table 7. Annual equivalent dose and effective dose due to exposure to local charcoal (mSv/y).
| Materials | Dout (n Gy/hr) | Dout (m Gy/y) | Eout (m Sv/y) | ELCR |
|---|---|---|---|---|
| Charcoal | 182.28 | 0.36 | 0.26 | 0.0009 |
| Soil | 158.16 | 0.32 | 0.22 | 0.0008 |
Table 8. Outdoor absorbed dose rate, annual effective dose and excess life time cancer risk due to charcoal and soil samples.
| Materials | Activity concentration (Bq/kg) U-238 Th-232 K-40 |
Hin | RLI | ||
|---|---|---|---|---|---|
| Charcoal | 4.4 | 2.8 | 381.2 | 1.59E-04 | 0.31 |
| Soil | 16 | 16.7 | 298.2 | 2.98E-04 | 0.47 |
| Sum | 4.58E-04 | 0.78 | |||
Table 9. Internal index and RLI due to NORM in charcoal and soil inside kiln.
Figure 3-5 investigated the XRF spectrums of local and imported charcoal samples. While Table 10 shows the mass percentage of different elements in local and imported charcoal samples. It is clear that Vietnamese and Chinese charcoal have the higher elemental concentrations. But, these values are not accurate due to that the coverage range for the elemental analyzer was from sodium to uranium only. Also, it is clear that the Indonesian charcoal show the higher concentration of potassium (26.28%) and these results are consistent with the obtained gamma activities due to K40 as shown in Tables 1 and 2.
| Materials | n Gy/h | mGy/y | mSv/y |
|---|---|---|---|
| Charcoal | 0.022 | 4.40E-05 | 3.08E-05 |
| Soil | 0.08 | 1.60E-04 | 1.12E-04 |
| Summation | 0.102 | 2.04E-04 | 1.43E-04 |
Table 10. Alpha index due to coal and soil inside kiln.
Tables 11 and 12 indicates the gross beta activities due to K40 and other beta emitters daughters of natural radioactivity in (Bq/kg) in local and imported charcoal samples; respectively. It is clear that the average of beta activities due to NORM in local charcoal samples is lower than beta activities in all imported charcoal samples Table 13.
| Element | C2* | C12** (Vietnam) | C10** (China) | C11** (Indonesia) | ||||
|---|---|---|---|---|---|---|---|---|
| ms% | Sigma | ms% | Sigma | ms% | Sigma | ms% | Sigma | |
| Al | -- | -- | 3.89 | 1.60 | -- | -- | -- | -- |
| Si | 2.39 | 2.35 | 14.13 | 1.51 | 6.43 | 2.39 | 17.29 | 1.48 |
| K | 14.95 | 1.44 | 21.93 | 0.95 | 5.04 | 1.48 | 26.28 | 1.19 |
| Ca | 63.43 | 1.69 | 22.80 | 0.99 | 60.16 | 1.36 | 47.41 | 1.47 |
| Ti | 1.54 | 1.50 | 1.89 | 0.53 | 1.09 | 1.26 | -- | -- |
| Mn | 1.93 | 0.86 | 1.29 | 0.34 | 1.08 | 0.74 | -- | -- |
| Fe | 14.99 | 0.75 | 32.10 | 0.30 | 21.08 | 0.65 | 8.28 | 0.47 |
| Cu | -- | -- | 0.56 | 0.33 | 0.36 | 0.59 | -- | -- |
| Zn | -- | -- | 0.59 | 0.30 | 0.59 | 0.52 | -- | -- |
| Rb | -- | -- | 0.43 | 0.22 | -- | -- | -- | -- |
| Sr | 0.77 | 0.34 | 0.39 | 0.18 | 3.73 | 0.34 | 0.26 | 0.19 |
| Zr | -- | -- | -- | -- | 0.44 | 0.32 | -- | -- |
| Ni | -- | -- | -- | -- | -- | -- | 0.48 | 0.39 |
* Local charcoal
** Imported charcoal (Indonesia)
Table 11. Elemental analysis using XFR technique.
| Sample | A (Bq/kg) |
|---|---|
| C1 | 414.8 |
| C2 | 270.5 |
| C3 | 319.2 |
| C4 | 360.7 |
| C5 | 180.3 |
| C6 | 180.3 |
| C7 | 216.4 |
| C8 | 312.0 |
| Range | 180.3-414 |
| Average | 281.8 |
Table 12. Gross beta activity concentrations of local charcoal samples.
| Sample | A (Bq/kg) |
|---|---|
| C9 (England) | 306.6 |
| C10 (Chinese) | 286.7 |
| C11 (Indonesia) | 319.2 |
| C12 (Vietnam) | 306.6 |
| Range | 286.7-319.2 |
Table 13. Gross beta activity concentrations of imported charcoal samples.
Conclusion
The range and average of natural radioactivity concentrations in local charcoal samples reported in the present study are low compared with that determined to imported charcoal especially that imported from England. Maximum activity concentration was 16.0 Bq/kg for U-238 and 16.7 Bq/kg for Th-232 and 298.2 Bq/kg for K-40 in soil samples. These activity values associated with permissible external dose to different organs, skin receive the highest external exposure, while, pancreas received the lowest value. Hin due to coal and soil was 3.58E-04 which is low compared to the recommended value (Hin must be ≤ 1). Alpha index due to inhalation of charcoal dust was 1.43E-04 m Sv/y. RLI was 0.78 and ELCR has maximum value of 0.001. For whole body the total annual external dose, due to charcoal and soil, was 0.48 m Gy/y and the total annual effective dose was 0.68 m Sv/y. Elemental analysis for charcoal show that calcium has the main mass %, but these values is not accurate due to that the coverage range for the elemental analyzer were from sodium to uranium only. But, it is clear that the Indonesian charcoal show the higher concentration of potassium (26.28%) and these results are consistent with the obtained gamma activities due to K-40. Gross beta measurements show that most beta were due to K-40 and the remaining were due to beta emitters daughters as Pa-234, Th-234, Pb-212 and Bi-214 for U-238 series and Ra-228, Ac-228, Pb-212 and Tl-208 for Th-232 series.
References
- FAO. Simple Technologies for Charcoal Making. Forestry paper no. 41, Forest Industries Division, Forestry Department, Food and Agriculture Organization, Rome, Italy. 1987.
- FAO. Charcoal Industries, Egypt. Food and Agriculture Organization of the United Nations, Regional Office for the Near East, Cairo, Egypt. 2011.
- Gomaa HA. Simple charcoal kiln for hardwoods and another dense biomass. International Conference for Environmental Health Mitigation, Cairo University, Cairo, Egypt. 2000. P:167-74.
- Cooper CD, Alley FC. Air Pollution Control: A Design Approach. Illinois: Waveland Press, Inc., USA; 2011.
- Abd El-Hady M. Measurement of individual radon progeny in Egyptian underground coal mine and related lung doses. Egypt J Solids. 2006;29(2):383.
- Philip GO, Babatunde JA, Ayodele EA, et al. Effects of charcoal production on soil physical properties in Ghana. J Plant Nutr Soil Sci. 2008;171(4):591-6.
- Jankovi? MM, Todorovi? DJ, Nikoli?J JD. Analysis of natural radionuclides in coal, slag and ash in coal-fired power plants in Serbia. J Min Metall Sect B-Metall. 2011;47(2)B:149-55.
- Amin YM, Khandaker MU, Shyen AKS, et al. Radionuclide emissions from a coal-fired power plant. Appl Radiat Isot. 2013;80:109-16.
- Khandaker MU, Kim KS, Kim GN. Production cross-sections of short-lived silver radionuclides from natPd (p, xn) nuclear processes. Nucl Instrum Methods Phys Res. 2012;274:148-53.
- Ababneh ZQ, Al-Omari H, Rasheed M, et al. Assessment of Gamma-emitting radionuclides in sediment cores from the Gulf of Aqaba, Red Sea. Radiat Prot Dosim. 2010;141 (3):289-98.
- Tari M, Zarandi SAM, Mohammadi K, et al. The measurement of Gamma-emitting radionuclides in beach sand cores of coastal regions of Ramsar, Iran using HPGe detectors. Mar Pollut Bull. 2013;74(1):425-34.
- Zare MR, Mostajaboddavati M, Kamali M, et al. 235U, 238U, 232Th, 40K and 137Cs Activity concentrations in marine sediments along the northern coast of Oman sea using high-resolution Gamma-ray spectrometry. Mar Pollut Bull. 2012;64(9):1956-61.
- Eckerman KF, Ryman JC. External exposure to radionuclides in air, water and soil. Federal Guidance Report No. 12, EPA Report 402-R-93-081 (Washington, DC). 1993.
- ICRP (International Commission on Radiological Protection). The 1990 Recommendations of the Commission. ICRP Publication 60. Ann ICRP. 1991;21(1-3):295-302.
- Todorovic NI, Karmar BM, Mrdja D, et al. Natural radioactivity in raw materials used in building industry in Serbia. Int J Environ Sci Technol. 2015;12(2):705-16.
- Masila X. Radioactive nuclides in Phosphogypsum from the Lowveld region of South Africa. S Afr J Sci. 2016;112(1/2):1-5.
- Raghu YN, Sekaran HAC, Ravisankar R. Assessment of natural radioactivity and associated radiation hazards in some building materials used in Kilpenathur, Tiruvannamalai Dist, Tamilnadu, India. Afr J of Basic Appl Sci. 2015;7(1):16-25.
- Shittu HO, Olarinoye IO, Baba-Kutigi AN, et al. Determination of the radiological risk associated with naturally occurring radioactive materials (NORM) at selected quarry sites in Abuja, FCT, Nigeria: Using Gamma-ray spectroscopy. Phys J. 2015;1(2):71-8.
- UNSCEAR. Sources and Effects of Ionizing Radiation. United Nations Scientific Committee on the Effects of Atomic Radiation (UNSCEAR 2008), volume (1), United Nations, New York. Annex B: Exposures from Natural Radiation Sources and Annex D: Medical Radiation Exposures. 2010.
- Abdullahi MA, Abdullkarim MS, Abdullahi NK. Contribution of building materials to background radiation dose in Nigeria. Int J Eng Sci Invent. 2014;3(11):56-8.
- Leonard C. Natural radioactivity hazards of building bricks fabricated from clay soil of Bomet District, Bomet County, Kenya. M. Sc. Thesis, Kenyatta University. 2014.
- Eissa MF, Mostafa RM, Shahin KF, et al. Natural radioactivity of some Egyptian building materials. International J Low Radiat. 2008;5(1):1.
- Yasuda K, Usuda S, Gunji G. Development of Scintillation-light-transmission Type Phoswich Detector for Simultaneous Alphaand Beta (Gamma) ray Counting, IEEE Trans. Nucl Sci. 2000;47(4):1337-40.
- Yasuda K, Usuda S, Gunji G. Simultaneous Alpha, Beta/Gamma and Neutron, Counting with Phoswich Detectors by Using a Dual-Parameter Technique, IEEE Trans. Nucl Sci. 2001;48(4):1162-4.
- Seo BK. Development of the dual scintillator sheet and Phoswich detector for simultaneous Alpha- and Beta-rays measurement. WM”07 Conference, 25 Feb, Tucson, Arizona; 2007.
- Beckhoff B, Langhoff N, Wedell R, et al. Handbook of practical X-ray fluorescence analysis. Berlin: Springer, Germany; 2007.
- Helaluddin ABM, Khalid RS, Alaama M, et al. Main analytical techniques used for elemental analysis in various matrices. Trop J Pharm Res. 2016;15(2):427-34.
- Janssens, Grieken V. Comprehensive Analytical Chemistry. Amsterdam: Elsevier, Netherlands; 2004.

