Original Article
, Volume: 12( 1)Structural Studies and Photochromic Properties of Lead(II)-Halide Complexes of 1-CnH2n+1-2-(Arylazo) Imidazoles
- *Correspondence:
- Chittaranjan Sinha Department of Chemistry, Inorganic Chemistry Section, Jadavpur University, Kolkata, India
Fax: 913324146584; E-mail: c_r_sinha@yahoo.com
Received: Feb 25, 2017 Accepted: Mar 28, 2017 Published: Apr 03, 2017
Citation:Mallick D, Chowdhury B, Jana S, et al. Structural Studies and Photochromic Properties of Lead(II)-Halide Complexes of 1-CnH2n+1-2-(Arylazo) Imidazoles. Inorg Chem Ind J. 2017;12(1):108.
Abstract
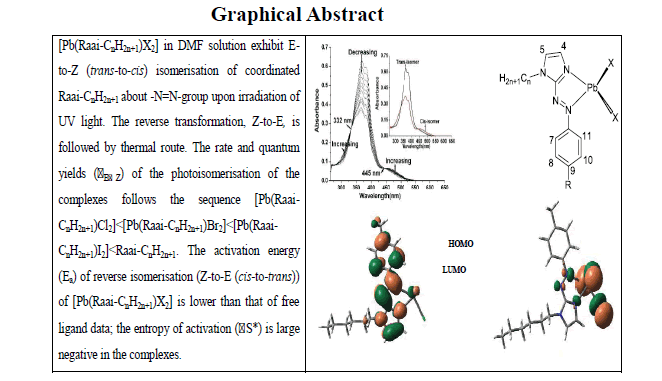
Pb(Raai-CnH2n+1)X2 has been synthesized by the reaction between PbX2 (X=Cl, Br, I) and 1-alkyl-2-(Arylazo) Imidazole (Raai- CnH2n+1, R=H, Me and n=4, 6, 8). The structures of the complexes have been established by spectral (UV-Vis, IR, 1H-NMR) data. UV light irradiation in DMF solution of the complexes exhibit E-to-Z (trans-to-cis) isomerisation of coordinated Raai-CnH2n+1 about- N=N-group. The reverse transformation, Z-to-E, is very slow with visible light irradiation while thermally accessible. The rate and quantum yields (φEZ) of the photoisomerisation of the complexes are lower than free ligand data. The activation energy (Ea) of reverse isomerisation (Z-to-E (cis-to-trans)) of [Pb(Raai-CnH2n+1)X2] is lower than that of free ligand data; the entropy of activation (ΔS*) is large negative in the complexes. Effect of halide (Cl-, Br- and I-) on the rate and quantum yields of photochromism is established in this work and has been supported by DFT computation. Slower rate of photoisomerisation of the coordinated ligands compared to the free ligand may be due to increase of mass of the complexes. However, the rate of isomerisation follows the sequence [Pb(Raai-CnH2n+1)Cl2] <[Pb(Raai-CnH2n+1)Br2] <[Pb(Raai-CnH2n+1)I2].
Keywords
Arylazoimidazole; Lead halide complexes; Spectral study; Photochromism; DFT Computation
Introduction
Recently the organic-inorganic hybrid functional materials have attracted much research attention [1]. Towards the study of the properties of the materials light activated physical/chemical changes are of prime importance because of reversible and nondestructive nature of the process. Light offers an attractive stimulus for external control of molecular switches and has enormous advantages over thermal, magnetic, mechanical, electrical, redox mediated activation processes. Light driven structural changes between trans and cis isomers of azobenzene derivatives, known as photochromism, has been reported by Hartley [2]. A large volume of work, since then, has been reported on the derivatives of azobenzene, the best characterized photo switches [3-5]. Photochromism is a reversible photo-induced transformation between two molecular states whose absorption spectra differ significantly [1,6]. Incorporation of photochromic molecules into organic or hybrid organic-inorganic materials leads to develop very effective devices. Azo-conjugated metal complexes exhibit unique properties upon light irradiation in the area of photon-mode high-density information storage photoswitching devices [5]. Arylazoimidazoles constitute an interesting class of heterocyclic azo compounds as a potential switching group in biological applications and in coordination chemistry, since imidazole is a ubiquitous and essential group in biology, especially as a metal coordinating site [7-9]. The photochromism of arylazoimidazole [ 10-12] and their coordination complexes [13-19] have inspired us to examine the photochromic property of hitherto unknown Pb(II) complexes of 1-alkyl-2-(arylazo)imidazoles (Raai-CnH2n+1, R=H, Me and n=4, 6, 8). The complexes have been spectroscopically characterized and photoisomerisation has been examined by irradiation of UV light in solution phase. Influence of halides (Cl-, Br-,I-) on rates of isomerisation and quantum yields have been examined. The structures have been optimized by DFT computation and the optical properties have been analyzed by TD-DFT computation.
Experimental Materials
PbCl2, PbBr2 and PbI2 were obtained from Loba Chemicals, Bombay, India 1-Alkyl-2-(arylazo)imidazoles were synthesized by reported procedure [20]. 1-Bromo-n-butane, 1-Bromo-n-hexane, 1-bromo-n-octane, were purchased from Sigma-Aldrich and were of analytical reagent grade and used as received. All other chemicals and solvents were reagent grade and used as received and the solvents were purified before use by standard procedure [21].
Physical measurements
Microanalytical data (C, H, N) were collected on Perkin-Elmer 2400 CHNS/O elemental analyzer. Spectroscopic data were obtained using the following instruments: UV-Vis spectra from a Perkin Elmer Lambda 25 spectrophotometer; IR spectra (KBr disk, 4000 cm -1 to 400 cm-1) from a Perkin Elmer RX-1 FTIR spectrophotometer; photo excitation has been carried out using a Perkin Elmer LS-55 spectrofluorimeter and 1H NMR spectra were recorded from a Bruker (AC) 300 MHz FTNMR spectrometer.
Synthesis of [Pb(Haai-C6H13)I2] (11a)
1-Hexyl-2-(phenylazo) imidazole (100 mg, 0.37 mmol) in MeOH (15 ml) was added in drops to hot solution (5 ml) of PbI2 (171 mg, 0.37 mmol) in ethylene glycol monomethyl ether (EGME) and refluxed for 2h. Orange-red precipitate appeared. The precipitate was collected by filtration, washed with KI solution (to remove excess of PbI2) and then washed with MeOH and dried over CaCl2 in vacuo. The compound was purified via crystallization by slow evaporation of EGME-MeOH (1:4 v/v) solution. The yield was 175 mg (66%). Other complexes were prepared under identical conditions and the yield varied in the range 63% to 72%.
Microanalytical data: Calc. For C13H16N4Cl2Pb (4a) C, 30.82; H, 3.16; N, 11.06. Found: C, 30.85; H, 3.18; N, 11.09%. FT-IR (ν, cm -1) 1589 (C=N), 1383 (N=N). UV-Vis (λmax/nm, × 10-4(M-1 cm-1)) 369 (2.8), 377 (2.6), 453 (0.22). Calc. For C14H18N4Cl2Pb (4b) C, 32.30; H, 3.46; N, 10.77. Found: C, 32.33; H, 3.44; N, 10.74%. FT-IR (ν, cm-1) 1591 (C=N), 1385 (N=N). UV-Vis (λmax/nm, ε × 10-4(M-1cm-1)) 367 (3.2), 381 (2.9), 452 (0.33). Calc. For C15H20N4Cl2Pb (5a) C, 33.70; H, 3.74; N, 10.48. Found: C, 33.68; H, 3.76; N, 10.43%. FT-IR (ν, cm-1) 1594 (C=N), 1379 (N=N). UV-Vis (λmax/nm, ε × 10-4(M-1cm-1)) 366 (2.4), 383(2.2), 461 (0.35). Calc. For C16H22N4Cl 2Pb (5b) C, 35.02; H, 4.01; N, 10.22. Found: C, 34.95; H, 4.04; N, 10.19%. FT-IR (ν, cm-1) 1595 (C=N), 1440 (N=N). UV-Vis (λmax/nm, ε × 10-4(M-1cm-1)) 368 (3.2) 381 (2.7), 459 (0.44). Calc. For C17H24N4Cl2Pb (6a) C, 36.29; H, 4.27; N, 9.96. Found: C, 36.33; H, 4.24; N, 9.98%. FT-IR (ν, cm-1) 1593 (C=N), 1379 (N=N). UV-Vis (λmax/nm, ε × 10-4(M-1cm-1)) 367 (3.1), 382 (2.9), 451 (0.30). Calc. For C18H26N4Cl2Pb (6b) C, 37.49; H, 4.51; N, 9.72. Found: C, 37.43; H, 4.45; N, 9.98%. FT-IR (ν, cm-1) 1594 (C=N), 1382 (N=N). UV-Vis (λmax/nm, ε × 10-4(M-1cm-1)) 366 (2.7) 377 (2.3), 460 (0.24). Calc. For C13H16N4Br2Pb (7a) C, 26.22; H, 2.69; N, 9.41. Found: C, 26.24; H, 2.73; N, 9.44%. FT-IR (ν, cm-1) 1594 (C=N), 1382 (N=N). UV-Vis (λmax/nm, ε × 10-4(M-1cm-1)) 366(2.7), 377(2.3), 460(0.24). Calc. For C14H18N4Br2Pb (7b) C, 27.59; H, 2.96; N, 9.20. Found: C, 27.63; H, 3.24; N, 9.24%. FT-IR (ν, cm-1) 1595 (C=N), 1383(N=N). UV-Vis (λmax/nm, ε × 10-4(M-1 cm-1)) 367 (2.6), 380 (2.2), 462 (0.35). Calc. For C15H20N4Br2Pb (8a) C, 28.89; H, 3.21; N, 8.99. Found: C, 28.91; H, 3.47; N, 8.95% . FT-IR (ν, cm-1) 1590 (C=N), 1379 (N=N). UV-Vis (λmax/nm, ε × 10-4(M-1cm-1)) 365 (3.1), 379 (2.5), 462 (0.26). Calc. For C16H22N4Br2Pb (8b) C, 30.14; H, 3.458 N, 8.79. Found: C, 29.98; H, 3.68; N, 8.82%. FTIR (ν, cm-1) 1597 (C=N), 1383 (N=N). UV-Vis (λmax/nm, ε × 10-4(M-1cm-1)) 366(2.8), 383 (2.4), 455 (0.24). Calc. For C17H24N4Br2Pb (9a) C, 31.34; H, 3.66; N, 8.60 Found: C, 31.35; H, 3.93; N, 8.63% . FT-IR (ν, cm-1) 1598 (C=N), 1378 (N=N). UV-Vis (λmax/nm, ε × 10-4(M-1cm-1)) 369 (2.6), 375 (2.1), 459 (0.25). Calc. For C18H26N4Br2Pb (9b) C,32.48; H, 3.91; N, 8.42. Found: C, 32.85; H, 2.34; N, 8.45%. FT-IR (ν, cm-1) 1596 (C=N), 1383 (N=N). UV-Vis (λmax/nm, × 10-4(M-1cm-1)) 367(2.5), 380 (2.0), 453 (0.30). For C13H16N4I2Pb (10a) C, 22.63; H, 2.32; N, 8.13. Found: C, 22.66; H, 2.31; N, 8.29%. FT-IR (ν, cm-1) 1580(C=N), 1380 (N=N). UV-Vis (λmax/nm, ε × 10-4(M-1cm-1)) 366 (2.5), 381 (2.13), 451 (0.36) Calc. For C14H18N4I2Pb (10b) C, 23.89; H, 12.56; N, 7.96. Found: C, 23.87; H, 2.53; N, 7.89%. FT-IR (ν, cm-1) 1582 (C=N), 1381 (N=N). UV-Vis (λmax/nm, × 10-4(M-1cm-1)) 368 (1.91), 383 (1.68), 450 (0.22) Calc. For C 15H20N4I2Pb (11a) C, 25.10; H, 2.79; N, 7.80. Found: C, 25.13; H, 2.83; N, 7.78%. FT-IR (ν, cm-1) 1587 (C=N), 1378 (N=N). UVVis (λ max/nm, ε × 10-4(M-1cm-1)) 368 (1.89), 382 (1.85), 449 (0.27). Calc. For C16H22N4I2Pb (11b) C, 26.26; H, 3.01; N, 7.66 Found: C, 26.28; H, 3.04; N, 7.69%. FT-IR (ν, cm-1) 1590 (C=N), 1379 (N=N). UV-Vis (λmax/nm, ε × 10-4(M-1cm-1)) 366 (1.85), 381 (1.75), 452 (0.35). Calc. For C17H24N4I2Pb (12a) C, 27.38; H, 3.22; N, 7.51. Found: C, 27.40; H, 3.24; N7.53%. FT-IR (ν, cm-1) 1587 (C=N), 1378 (N=N). UV-Vis (λmax/nm, ε × 10-4(M-1cm-1)) 368 (1.89), 382 (1.88), 450 (0.27). Calc. For C18H26N4I2Pb (12b) C, 28.45; H, 3.42; N, 7.38. Found: C, 28.47; H, 3.39; N, 7.39%. FT-IR (ν, cm-1) 1585 (C=N), 1380 (N=N). UV-Vis (λmax/nm, ε × 10-4(M-1cm-1)) 367 (1.83), 383 (1.79), 451 (0.35).
Photometric measurements
The absorption spectra were taken using PerkinElmer Lambda 25 UV/VIS Spectrophotometer in a 1 cm × 1 cm quartz optical cell maintained at 25°C with a Peltier thermostat. The light source of a PerkinElmer LS 55 spectrofluorimeter was used as an excitation light, with a slit width of 10 nm. An optical filter was used to cut off overtones when necessary. The absorption spectra of the cis isomers were obtained by extrapolation of the absorption spectra of a cis-rich mixture for which the composition is known from 1H NMR integration. Quantum yields (φ) were obtained by measuring initial E-to-Z (trans-to-cis) isomerization rates (ν) in a wellstirred solution within the above instrument using the relation, ν=(φ I0 /V)(1- 10-Abs) where I0 is the photon flux at the front of the cell, V is the volume of the solution, and Abs is the initial absorbance at the irradiation wavelength. The value of I0 was obtained by using azobenzene (φ=0.11 for π-*excitation [22]) under the same irradiation conditions.
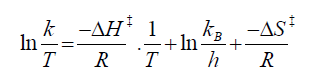
The thermal Z-to-E (cis-to-trans) isomerisation rates were obtained by monitoring absorption changes intermittently for a Z-rich solution kept in the dark at constant temperatures (T) in the range from 298 K to 313 K. The activation energy (Ea) was obtained from ln k=ln A –Ea/RT, where k=rate constant, R=gas constant, and T is temperature. The values of activation enthalpy (ΔH‡) and activation entropy (ΔS‡) were obtained from Eyring Plot using following equation and ΔG‡=Ea –RT-TΔS‡ where kB and h are Boltzmann’s and Plank’s constants, respectively.
Computational Procedure
All the calculations for [Pb(MeaaiC6H13)X2] (X=Cl (5b), Br (8b), I (11b)) were carried out with the density functional theory (DFT) method as implemented in GAUSSIAN 03 (G03) program package [23] and the calculations have been performed using the B3LYP exchange correlation functional [24] using Los Alamos effective core potential plus double zeta (LanL2DZ) [25-27] basis set along with the corresponding pseudo potential without any symmetry constrain for lead, bromide and iodide. The vibrational frequency calculation was also performed for both the complexes to ensure that the optimized geometries represent the local minima and there are only positive Eigen values. The coordinates of single crystal X-ray structure has been used in the calculations. To assign the low lying electronic transitions in the experimental spectra, TDDFT [28] calculations of the complexes were done. We computed the lowest 25 singlet-singlet transition and results of the TD-DFT calculations was qualitatively very similar. GaussSum [29] was used to calculate the fractional contributions of various groups to each molecular orbital.
Results and Discussion
Synthesis and formulation of compounds
The complexes [Pb(Raai-CnH2n+1)X2] (4-12) have been synthesized by the reaction between 1-alkyl-2-(arylazo)imidazole (Raai- C nH2n+1, 1-3, where R=H (a), Me (b); n=4 (C4H9, 1), 6 (C6H13, 2), 8 (C8H17, 3)) and PbX2 (X=Cl, Br, I) in 1:1 mole ratio in MeOH and EGME mixture. Microanalytical data support the composition of the complexes. The vibrational spectra of the complexes (4- 12) are assigned based on literature report [19,20]. We could not isolate X-ray diffractable stable single crystal of present series of complexes for accurate structure determination. Based on the reported structures [18,19] and on comparing other spectroscopic data we apprehend that the complexes in this work could have halo-bridging polymeric geometry (Scheme. 1 ).
Scheme 1: (a) Isomerization of 1-alkyl-2-(arylazo)imidazole (Raai-CnH2n+1, R=H (a), Me (b) and n=4 (1), 6 (2), 8 (3)); (b) the complex, [Pb(Raai-CnH2n+1)X2 (4-12).
The 1H NMR spectra of the complexes are recorded in DMSO-d6. The alkylation of imidazole is supported by the disappearance of (N-H) at ~10.30 ppm and the appearance of N(1)-alkyl signal at 0.85 ppm to 4.40 ppm; N-CH2-(CH2)=n-CH3 shows a triplet for -H2 at 4.40 ppm, a triplet at 0.85 ppm. for last -CH3 group and a multiplet for -(CH2)n-at 1.22 ppm to 1.90 ppm. Imidazolyl 4- and 5-H appear as broad singlet at 7.24-7.28 and 7.14 ppm to 7.17 ppm, respectively and broadened. The aryl protons (7-H to 11-H) have been moved to upfield on going from phenylazo (a) to p-tolylazo (b) which may be due to +I effect of -Me group. Data (Table 1) reveals that the signals in the spectra of the complexes are shifted to downfield side relative to free ligand values. This supports the coordination of ligand to Pb(II). Imidazolyl protons 4-H and 5-H suffer downfield shifting by 0.3 ppm to 0.4 ppm compared to the free ligand position. This supports the strong preference of binding of imidazolyl-N to Pb(II). Aryl signals shift to the lower field side on Me-substitution to the aryl ring. This is due to electron donating effect of the Me- group.
| Compounds | 4-Hs | 5-Hs | 7,11-Hd | 8,10-Hd | 9-Rs | 12-CH2t | LCH3t | LCH3-(CH2)* -CH 2-bs |
|---|---|---|---|---|---|---|---|---|
| [Pb(Haai-C4H9)Cl2](4a) | 7.70 | 7.28 | 7.81 (8.4) |
7.54 | 7.55 | 4.53 (6.3) |
0.87 (6.2) |
1.04-1.12 |
| [Pb(Meaai-C4H9)Cl2] (4b) | 7.68 | 7.27 | 7.79 (7.4) |
7.53 | 2.43 | 4.49 (7.1) |
0.88 (6.3) |
1.03-1.24 |
| [Pb(Haai-C6H13)Cl2] (5a) | 7.68 | 7.29 | 7.84 (8.3) |
7.51 | 7.57 | 4.56 (6.4) |
0.87 (6.2) |
1.01-1.12 |
| [Pb(Meaai-C6H13)Cl2] (5b) | 7.69 | 7.28 | 7.79 (7.5) | 7.52 | 2.42 | 4.47 (7.0) |
0.87 (6.2) |
1.03-1.23 |
| [Pb(Meaai-C8H17)Cl2] (6a) | 7.68 | 7.29 | 7.83 (7.8) |
7.51 | 7.59 | 4.54 (6.3) |
0.85 (6.2) |
1.07-1.10 |
| [Pb(Haai-C8H17)Cl2] (6b) | 7.68 | 7.27 | 7.76 (7.7) |
7.50 | 2.43 | 4.49 (7.1) |
0.81 (6.2) |
1.04-1.07 |
| [Pb(Haai-C4H9)Br2] (7a) | 7.68 | 7.27 | 7.81 (8.5) |
7.53 | 7.58 | 4.53 (6.3) |
0.86 (6.2) |
1.02-1.24 |
| [Pb(Meaai-C4H9)Br2] (7b) | 7.65 | 7.25 | 7.80 (7.4) |
7.51 | 2.42 | 4.49 (7.0) |
0.87 (6.2) |
1.02-1.23 |
| [Pb(Haai-C6H13)Br2] (8a) | 7.63 | 7.27 | 7.81 (8.3) |
7.53 | 7.56 | 4.56 (6.4) |
0.86 (6.3) |
1.03-1.14 |
| [Pb(Meaai-C6H13)Br2] (8b) | 7.64 | 7.26 | 7.79 (7.4) |
7.51 | 2.41 | 4.48 (7.01) |
0.87 (6.2) |
1.01-1.23 |
| [Pb(Meaai-C8H17)Br2] (9a) | 7.68 | 7.28 | 7.82 (7.8) |
7.53 | 7.58 | 4.53 (6.3) |
0.85 (6.2) |
1.09-1.15 |
| [Pb(Haai-C8H17)Br2] (9b) | 7.62 | 7.28 | 7.75 (7.7) |
7.52 | 2.43 | 4.47 (7.3) |
0.83 (6.4) |
1.04-1.22 |
| [Pb(Haai-C4H9)I2]n(10a) | 7.58 | 7.28 | 7.81 (8.3) |
7.51 | 7.55 | 4.53 (6.3) |
0.86 (6.1) |
1.02-1.12 |
| [Pb(Meaai-C4H9)I2] (10b) | 7.57 | 7.26 | 7.79 (7.4) |
7.51 | 2.41 | 4.49 (7.0) |
0.86 (6.2) |
1.02-1.24 |
| [Pb(Haai-C6H13)I2] (11a) | 7.57 | 7.29 | 7.80 (8.2) |
7.50 | 7.58 | 4.55 (6.4) |
0.87 (6.2) |
1.01-1.12 |
| [Pb(Meaai-C6H13)I2] (11b) | 7.56 | 7.27 | 7.78 (7.4) |
7.50 | 2.40 | 4.49 (7.0) |
0.86 (6.2) |
1.02-1.23 |
| [Pb(Meaai-C8H17)I2] (12b) | 7.58 | 7.27 | 7.81 (7.8) |
7.52 | 7.59 | 4.52 (6.3) |
0.86 (6.2) |
1.09-1.10 |
| [Pb(Haai-C8H17)I2] (12b) | 7.57 | 7.26 | 7.76 (7.6) |
7.51 | 2.42 | 4.48 (7.1) |
0.84 (6.2) |
1.03-1.02 |
sSinglet; dDoublet; tTriplet; bsBroad Singlet; Llast -CH3 of respective N-alkyl group
Table: 1H NMR spectral data in DMSO-dtsub at room temperature.
The spectral studies and photochromism
The absorption spectra were recorded in DMF solution (because of sparing solubility in MeOH) for the complexes, in the wavelength range 200 nm to 900 nm. The absorption spectra of ligands show absorption band at 340 nm to 380 nm with a molar absorption coefficient in the order of 103 dm3 mol-1 cm-1 and a tail extending into 550 nm with a weak band at 450 nm to 455 nm [30]. The complexes show structured absorption band at 345 nm to 385 nm with a molar absorption coefficient on the order of 103 M-1 cm-1 and a tail extending into 550 nm with a weak band (∈~103 mol-1 dm3 cm-1) appears at 455 nm to 460 nm. This may due to MLCT transition from Pb(II)→π*(Azoimine).
The E-to-Z (trans-to-cis) isomerisation of coordinated Raai-CnH2n+1 in [Pb(Raai-CnH2n+1)X2] (X=Cl, Br, I) are carried out upon UV light irradiation (λ, 364-368 nm) in DMF solution. Upon irradiation with UV light trans-to-cis photoisomerisation proceeded and the cis molar ratio is reached to >95%. The absorption spectra of the complexes changed with isosbestic points upon excitation (Figure. 1) into the cis-isomer. Repeated irradiation even after 15 cycles photochrome does not show any change of intensity which assigns photostability. The quantum yields were measured for the trans-to-cis (φt→c) photoisomerisation of complexes in DMF on irradiation of UV wavelength (Table 2). The φE→Z values are significantly dependent on nature of substituents and X. The Me substituent at Ar-N=N- and also substituent at N(1)-position (1-CnH2n+1) reduce φE→Z values. In general, increase in rotor-mass and rotor-volume of the complexes reduce the rate of E-to-Z isomerisation.
Figure 1: The spectral changes of [Pb(Meaai-C6H13)I2] (11b) in DMF solution upon repeated irradiation at 368 nm at 5 min interval at 25°C. Inset figure shows spectra of cis and trans isomer of the complex.
| Compounds | λπ,π* (nm) | Isobestic point (nm) |
Rate of t→c conversion × 108 (s-1) | t→c conversion |
|---|---|---|---|---|
| 4a | 365 | 335,437 | 1.53 | 0.083 |
| 4b | 366 | 336,446 | 1.42 | 0.079 |
| 5a | 365 | 334,443 | 1.33 | 0.074 |
| 5b | 364 | 337,444 | 1.30 | 0.073 |
| 6a | 367 | 333,442 | 1.23 | 0.069 |
| 6b | 365 | 336,441 | 1.21 | 0.068 |
| 7a | 366 | 333,435 | 1.67 | 0.091 |
| 7b | 366 | 331,447 | 1.54 | 0.089 |
| 8a | 368 | 334,441 | 1.53 | 0.085 |
| 8b | 367 | 333,440 | 1.51 | 0.084 |
| 9a | 369 | 336,433 | 1.48 | 0.081 |
| 9b | 366 | 331,442 | 1.31 | 0.077 |
| 10a | 368 | 337,443 | 1.87 | 0.099 |
| 10b | 368 | 338,445 | 1.80 | 0.097 |
| 11a | 364 | 335,433 | 1.76 | 0.095 |
| 11b | 365 | 331,444 | 1.67 | 0.092 |
| 12a | 365 | 335,441 | 1.59 | 0.090 |
| 12b | 367 | 337,444 | 1.54 | 0.089 |
Table 2. Results of photochromism, rate of conversion and quantum yields upon UV light irradiation.
Thermal Z-to-E (cis-to-trans) isomerisations of the complexes were followed by UV-Vis spectroscopy in DMF at varied temperatures, 298 K to 313 K. The Eyring plots in the range 298 K to 308 K gave a linear graph from which the activation energy was obtained ( Table 3 and Figure. 2). In the complexes, the Eas are severely reduced which means faster Z-to-E isomerisation of the complexes. The entropy of activation (ΔS*) are high negative in the complexes than that of free ligand. This is also in support of increase in rotor volume in the complexes.
Figure 2: The Eyring plots of rate constants of E to Z thermal isomerisation of [Pb(Meaai-C6H13) I)2] (11b) at different temperatures.
Electronic structure calculation and optical spectra
The DFT computation has been performed of [Pb(Meaai-C6H13)X2] (X=Cl (5b), Br (8b), I (11b)) to generate optimized structures. In the complexes the occupied MOs (HOMO, HOMO-1 etc) are dominate by X (HOMO shares 74% Cl (5b), 84% Br (8b), 94% I (11b)) and HOMO-1, HOMO-2 etc contain >90% of halide Figure. 3). The LUMO, LUMO+1, LUMO+2 have received major share from coordinated Meaai-C6H13 (>95%) (Supplementary FIG. S1 and Tables S1-S6). The azo group shares 45% to 52% in the unoccupied MOs of Meaai-C6H13.
Figure 3: Surface plots of HOMO, HOMO-1, LUMO and LUMO+1 of [Pb(Meaai-C6H13)Cl2] (5b); [Pb(Meaai-C6H13)Br2] (8b); [Pb(Meaai-C6H13)I2] (11b).
The calculated spectral transitions account that longer wavelength transitions (>450 nm) refer to X (Cl, Br or I)→π*(azoimine) charge transfer transitions. The MLCT transition is calculated at <412 nm. A strong π-π* transition (H-8/H-7 to L+1) is expected around 325 nm to 375 nm. In photochromic process the UV light irradiation is mandatory to the molecule in solution for a fixed time which will enforce to isomerise more stable trans-isomer (E) to cis-isomer (Z). Irradiation in the UV region may be responsible to π→π* transition. The MLCT or XLCTs are of lower energetic transition which are capable to charge transfer to azoimidazole and may not sufficient to perform physical process like Pb-N(azo) cleavage or isomerisation. Conversely, the excited complex may perform charge transition in a secondary (MLCT or XLCT) process which is responsible for deactivation of excited species and reduces the rate of trans→cis change and quantum yields. This is observed, indeed (Table 3).
| Compounds | Temp (K) | Rate of thermal c→t conversion × 103 (s-1) |
Ea, kJ mol-1 |
ΔH* kJ mol-1 |
ΔS* J mol-1 K-1 |
ΔG* c kJ mol-1 |
|---|---|---|---|---|---|---|
| 4a | 298 303 308 |
0.1531 0.2115 0.3009 |
51.54 | 49.03 | -153.48 | 95.92 |
| 4b | 298 303 308 |
0.1588 0.2190 0.3101 |
51.05 | 48.54 | -154.82 | 95.44 |
| 5a | 298 303 308 |
0.1699 0.2216 0.3294 |
50.46 | 47.94 | -156.38 | 95.33 |
| 5b | 298 303 308 |
0.1768 0.2563 0.3412 |
50.20 | 47.68 | -156.63 | 95.14 |
| 6a | 298 303 308 |
0.1804 0.2624 0.3421 |
48.87 | 46.36 | -160.89 | 95.10 |
| 6b | 298 303 308 |
0.1864 0.2756 0.3452 |
47.09 | 44.57 | -166.52 | 95.03 |
| 7a | 298 303 308 |
0.2008 0.3031 0.4155 |
55.52 | 53.00 | -137.69 | 94.73 |
| 7b | 298 303 308 |
0.2013 0.3135 0.4139 |
55.07 | 52.55 | -139.11 | 94.70 |
| 8a | 298 303 308 313 |
0.2076 0.3325 0.4234 |
54.48 | 51.96 | -140.75 | 94.60 |
| 8b | 298 303 308 |
0.2086 0.3235 0.4243 |
54.28 | 51.73 | -141.57 | 94.62 |
| 9a | 298 303 308 313 |
0.2213 0.2835 0.4439 |
53.03 | 50.51 | -145.67 | 94.65 |
| 9b | 298 303 308 |
0.2221 0.2829 0.4445 |
52.85 | 50.33 | -146.24 | 94.64 |
| 10a | 298 303 308 |
0.2563 0.4129 0.5881 |
63.42 | 60.91 | -109 | 94.15 |
| 10b | 298 303 308 |
0.2464 0.4135 0.5623 |
63.04 | 60.53 | -110.16 | 94.04 |
| 11a | 298 303 308 |
0.2342 0.3591 0.5342 |
62.94 | 60.44 | -111.50 | 94.41 |
| 11b | 298 303 308 |
0.2346 0.3605 0.5348 |
62.88 | 60.37 | -111.78 | 94.24 |
| 12a | 298 303 308 |
0.2566 0.3933 0.5822 |
62.52 | 60.01 | -112.24 | 94.02 |
| 12b | 298 303 308 |
0.2376 0.3415 0.5334 |
61.66 | 59.15 | -115.45 | 94.13 |
Table 3. Rate and activation parameters for cis (c) ? trans (t) thermal isomerization.
The correlation diagram Figure. 4 shows that the energy difference between HOMO and LUMO is decreasing with declining elctronegativity of Cl to Br to I: [Pb(Meaai-C6H13)Cl2] (2.72 eV), [Pb(Meaai-C6H13)Br2] (2.39 eV) and [Pb(Meaai-C6H13)I2] (2.01 eV). The plots of ΔE versus rates of isomerisation and quantum yields are linearly related (Figure. 5). This implies the direct correlation between photophysical process and activation energy barrier.
Figure 4: Energy correlation between HOMO (H), HOMO-1 (H-1), LUMO (L) and LUMO+1 (L+1) of 5b, 8b and 11b. Results obtained from DFT calculation of optimized geometries.
Figure 5: Correlation between E, eV (=ELUMO-EHOMO) and quantum yields (trans-to-cis); (b) E, eV and rate of thermal process ( cis-to-trans).
UV light causes π→π* transition followed by geometrical transformation, E→Z of coordinated Raai-CnH2n+1. The irradiation is carried out for a fixed time which will enforce to isomerise more stable trans-isomer to cis-isomer. The MLCT or XLCT are of lower energetic transition which is capable to charge transfer to azoimidazole but energy is insufficient to perform isomerisation. Conversely, the Pb(II)-coordinated photochrome may perform charge transition in via MLCT or XLCT process which is responsible for deactivation of excited species and controls the rate of isomerisation and quantum yields. This is observed, indeed (Table 3).
Research Highlights
Structural studies and photochromic properties of lead(II)-halide complexes of 1-CnH2n+1-2-(arylazo)imidazoles
Debashis Mallick, Bharati Chowdhury, Srikanta Jana, Chandana Sen, Sudipa Mondal and Chittaranjan Sinha*
• 1-Alkyl-2-(arylazo)imidazole complexes of Pb(II).
• Photochromism, E-to-Z and Z-to-E, of coordinated 1-alkyl-2-(arylazo)imidazole
• Photoisomerisation follows the sequence [Pb(Raai-CnH2n+1)Cl2]<[Pb(Raai-CnH2n+1)Br2]<[Pb(Raai-CnH2n+1)I2]<Raai-CnH2n+1
• DFT computation explains the light induced phenomena
Acknowledgments
Financial support under minor research programme (PSW-158/13-14) from the UGC, New Delhi are gratefully acknowledged.
References
- Gómez-Romero P, Sanchez C, editors. “Functional Hybrid Materials”, Wiley-VCH Verlag GmbH & Co. 2004.
- Tamaoki N, Irie M, Yokoyama Y, et al. editors. New Frontiers in Photochromism, Springer, Japan 2013.
- Durr H, Bouas-Laurent H, editors. Photochromism molecules and systems. 1st Edn, Elsevier, Amsterdam, 2003.
- Knoll H. CRC Handbook of organic photochemistry and photobiology. Horspool W, Lenci F, editors. CRC Press, Boca Raton, 2004;1-16.
- Irie M. Photochromism: Memories and Switches (special issue) Chem. Rev. 2000;100(5):1683-4.
- Rau H. In photochromism, molecules and systems. Dürr H, Bounas-Laurent H, editors. Elsevier: Amsterdam, 1990;165.
- Ray U, Banerjee D, Mostafa G, et al. Copper coordination compounds of chelating imidazole-azo-aryl ligand. The molecular structures of bis[1-ethyl-2-(p-tolylazo)imidazole]-bis-(azido)copper(II) and bis[1-methyl-2-(phenylazo)imidazole]-bis(thiocyanato)copper(II). New J Chem. 2004;28:1437-42.
- Dinda J, Jasimuddin SK, Mostafa G, et al. Silver(I) complexes of azoimine functions: Single crystal X-ray structure of bis-[1-ethyl-2-(naphthyl-a-azo)imidazole] silver(I) perchlorate by*, Polyhedron. 2004;23:793-800.
- Chand B, Ray U, Mostafa G, et al. Inorg Chim Acta. 2005;358:1927.
- Otsuki J, Suwa K, Narutaki K, et al. Photochromism of 2-(Phenylazo)imidazoles. J Phys Chem A. 2005;109(35):8064-69.
- Gayen P, Sinha CJ. The photochromism of 1-alkyl-2-(arylazo)imidazoles trapped in water pool by AOT-heptane reverse micelle. Indian Chem Soc. 2013;90(6):751-62.
- Gayen P, Sinha C. Transducer influence of polycyclic aromatic hydrocarbons (PAHs) on photoisomerisation of 1-alkyl-2-(arylazo)imidazoles. Spectrochim Acta A. 2013;104:477-85.
- Sen C, Nandi A, Mallick D, et al. The spectroscopic characterization, photochromism of cadmium(II)-iodo complexes of 1-alkyl-2-(arylazo) imidazoles and DFT computation of representative complexes. Sinha. Spectrochim Acta A. 2015;13:935-44.
- Sen C, Mallick D, Mondal S, et al. Structure, photochromism and mesogenic property of mercury(II) complexes of 1-alkyl-2-(arylazo)imidazoles. J Indian Chem Soc. 2015;92:203.
- Nandi A, Sen C, Roy S, et al. Polyhedron. Synthesis, structure, photochromism, mesogenic property and DFT computations of silver(I) complexes of long chain alkyl group containing 1-alkyl-2-(arylazo)imidazoles. 2014;79:186 -96.
- Misra K, Das D, Sinha C, et al. Chemistry of Azoimidazoles: Synthesis, spectral characterization, electrochemical studies, and x-ray crystal structures of isomeric dichloro bis[1-alkyl-2-(arylazo)imidazole] complexes of Ruthenium(II). Inorg Chem.1998;37(8):1672-78.
- Mondal JA, Saha G, Sinha C, et al. Photoisomerization dynamics of N-1-methyl-2-(tolylazo) imidazole and the effect of complexation with Cu (II). Chem Phys. 2012;14(37):13027-34.
- Mallick D, Sarker KK, Datta P, et al. Studies on 1-alkyl-2-(arylazo)imidazole complexes of lead(II) and their photoisomerization. Inorg Chim Acta. 2012;387:352-60.
- Sarker KK, Jana AD, Mostafa G, Wu JS, Lu TH, et al. Inorg. Chim. Acta. 2006;359:4377.
- Halder S, Roy S, Mondal TK, et al. Anorg Alleg Chem. 2013;639:1861-70.
- Vogel AI. A text-book of quantitative inorganic analysis, 3rd Ed., ELBS, Longman. 1975;433.
- Zimmerman G, Chow L, Paik U. The photochemical isomerization of Azobenzene. J Am Chem Soc. 1958;80(14):3528-31.
- Gaussian 03, Revision C.02, M.J. Frisch; Gaussian, Inc., Wallingford CT 2004;26.
- ABecke AD. Density functional thermochemistry. III. The role of exact exchange. J Chem Phys. 1993;98:5648.
- Hay PJ, Wadt WR. Ab initio effective core potentials for molecular calculations. Potentials for the transition metal atoms Sc to Hg. J Chem Phys. 1985;82:270.
- Hay PJ, Wadt WR. Ab initio effective core potentials for molecular calculations. Potentials for main group elements Na to Bi. J Chem Phys. 1985;82:284.
- Hay PJ, Wadt WR. Ab initio effective core potentials for molecular calculations. Potentials for K to Au including the outermost core orbitals. J Chem Phys. 1985;82:299.
- EMSL, Basis set library from http:/www.emsl.pnl.gov/forms/basisform.html.
- Boyle NM, Vos J, Gauss Sum 1.0; Dublin City University: Dublin, Ireland (2005). Available from http://gausssum.sourceforge.net.
- Mallick D, Nandi A, Datta S, et al. The synthesis, structure and photochromism of mercury(II)-iodide complexes of 1-CnH2n+1-2-(arylazo)imidazoles (n=4, 6, 8) Polyhedron. 2012;31:506-14.