Original Article
, Volume: 16( 1)Morphological and Mechanical Analysis of Polyamide-66/Poss Nanocomposite Fiber
Edison Omollo 1*, Jacob Koech1,2, Edwin Kamalha3 and Vijay Adolkar1
1Technical University of Kenya, P.O. Box 52428 (00200), Nairobi, Kenya
2Donghua University, 210620, Shanghai, China
3Busitema University, Tororo, Uganda
- *Correspondence:
- Edison Omollo, Technical University of Kenya, P.O. Box 52428 (00200), Nairobi, Kenya, Tel: +254721857685, E-mail: edisonomollo@gmail.com
Received: December 04, 2017; Accepted: January 02, 2018; Published: January 09, 2018
Citation: Omollo E, Koech J, Kamalha E, et al. Morphological and Mechanical Analysis of Polyamide-66/Poss Nanocomposite Fiber. Mat Sci Ind J. 2017;16(1):124
Abstract
Nanocomposite fibers were prepared from poly hexamethylene adipamide (PA-66) via melt mixing of polyhedral oligomeric silsesquioxane (POSS) nanoparticles (octa-aminophenyl polyhedral oligomeric silsesquioxane (OAPS) and octaphenyl polyhedral oligomeric silsesquioxane (OPS)) into the PA-66 matrix. Analysis was then done using, fiber tensile testing, X-ray diffraction (XRD), FTIR, and field emission scanning electron microscopy (FE-SEM) to characterize the fabricated nanocomposite fibers to determine their mechanical and morphological characteristics. Tensile modulus and tenacity increased by up to 8% and 2% respectively. However, it was seen that 3% POSS loading does not give the material performance enhancements. XRD studies showed that the inter-segmental packing of the polymer chains is not disrupted by the incorporation of POSS nanoparticles. At 1%wt POSS, SEM micrographs showed a uniform cross section with no visible phase separation. As the POSS loading was increased to 3%wt, resultant nanocomposite fibre showed distinct phase separation with formation of distinctive micron size aggregates that led to reduced properties of nanocomposite fiber. OAPS at low concentrations produced nanocomposite fibers of better mechanical properties compared to OPS. OAPS at low concentrations dispersed in a polymer matrix of PA-66 has the potential to be used in nanocomposite fabrication and is recommended for further research.
Keywords
Nanocomposites; Polyamide 66; Polyhedral oligomeric silsesquioxane; Mechanical properties
Introduction
Nano-composites composed of polymers are gradually becoming an important material in engineering applications. This is because studies show that by homogeneously dispersing nanoparticles in the matrix of a polymer, can result in tremendous improvement in the properties of the resultant polymer nano-composite. Some properties known to be improved include the mechanical, thermal and barrier performance. It has also been shown that these properties are only enhanced at low concentration of nanoparticles [1,2]. Applications of these polymer nano-composites has been impeded by the strong agglomeration proneness of nanoparticles and surface modification of the nanoparticles is usually necessary prior to improve their dispersion in the polymer matrix. This will thus improve the properties of the polymer based nano-composite [3].
Polyamide 66 (PA 66) is famous for its good mechanical and physical properties. Since its discovery, it has found wide applications due to their high melting temperatures [4]. PA 66 is manufactured by polycondensation of the by-product of the reaction of a diacid and diamine (hexamethylene diamonium adipate) proceeded by removal of water [5]. The final properties of PA 66 are usually affected by its orientation and crystallinity [6]. PA 66 nanocomposites studies have been on the rise due to the aforementioned properties of PA 66. Polyhedral silsesquioxanes (POSS) is an organo-silicon compound that combines a flexible and reactive organic shell and a rigid inorganic core that have made them very ideal as possible platforms to be used as nanocomposite materials [7].
In our earlier study, PA 66 nanocomposite fibers were fabricated through melt mixing PA 66 using octa-aminophenyl polyhedral oligomeric silsesquioxane (OAPS) and octaphenyl polyhedral oligomeric silsesquioxane (OPS) as matrix fillers. The thermal characteristics were then determined [8]. This study therefore aims at further performing morphological and mechanical analysis of PA 66/POSS nanocomposite fibers fabricated from our previous study. FTIR analysis was performed to check if POSS nanoparticles had any interaction with PA 66. X-ray diffraction (XRD) was also used to characterize the inter-segmental packing of the nanocomposite fibers. A field emission scanning electron microscope (FE-SEM) was incorporated to study the fabricated nanocomposite fiber morphology while tensile strength, modulus and tenacity determined using a fiber tensile tester. These characterizations were done to ascertain their possible use in high temperature automobile applications.
Experimental
Polyamide 66 used in the study was bought from BASF (Shanghai, China) and was dried in a vacuum before being used. Octaphenyl silsesquioxane (OPS) POSS was purchased from Liaoning AM Union Composite Materials Company Ltd. (China).
Nanocomposite fiber fabrication process
OPS was first converted to Octaaminophenyl POSS (OAPS) in a two-stage nitration reduction reaction process as outlined in our earlier work [9]. During the fabrication of PA-66/POSS nanocomposites, the weight ratios of PA-66 to POSS was varied from 0% POSS to 3% POSS as shown in Table 1. The procedure followed in the fabrication was as described in another of our previous work [8].
| Sample No. | PA 66 (%wt) | POSS (%wt) | |
|---|---|---|---|
| OPS | OAPS | ||
| 1 | 100 (Neat) | 0 | 0 |
| 2 | 99 | 1 | 1 |
| 3 | 98 | 2 | 2 |
| 4 | 97 | 3 | 3 |
Table 1: Composition of PA-66/POSS nanocomposite.
During the fabrication of PA-66/POSS nanocomposites,
Methods
A Nicolet 6700 Series FTIR spectrometer (Thermo Fisher Scientific, Inc., Madison, WI) was used to determine the presence of functional groups on POSS, PA66 and the composite. POSS samples which were in powder form were prepared using a standard KBr pellet technique. FTIR grade KBr was dried in an oven at 100°C. The sample was also dried under vacuum prior to test. KBr and the sample (1 to 3%wt) were mixed thoroughly in a mortar and pestle. Pellets of approximately 1 mm thickness were prepared using a pelletizer and applying hand pressure. Care was taken to form transparent pellets. The pelletizer along with the pellet was mounted in the internal workbench of the FTIR and scanned in the range 4000 cm-1-400 cm-1. A base spectrum was obtained prior to sample collection in the range of 4000 cm-1-400 cm-1.
Attenuated total reflectance (ATR) spectroscopy was used to obtain the nanocomposite fibres spectra. Pure PA-66 and nanocomposite fibres were tested using FTIR to determine functional groups of the base PA-66, and the appearance and intensity of the POSS peaks in the fibre morphology. Before starting the analysis, the microscope was filled with liquid nitrogen to keep it cool while in operation. The ATR microscope accessory was then mounted onto the microscope. Small fibre samples were kept on the microscope stage with a glass slide underneath for support. A background spectrum was collected and subtracted from the sample spectrum.
A field emission scanning electron microscope (Hitachi UHR FE-SEM, SU8010) was used to obtain micrographs of fracture surface of the composite fibres. An electron beam was focused on the sample and the image obtained was collected at various magnifications. The image was stabilized by adjusting the x and y stigmator. Typical sample preparation involved snapping the extruded fibre samples under liquid nitrogen and mounting it on a stub with a double sided carbon tape. Since the fibres were non-conducting, they were coated with gold before mounting in the SEM.
Fibre linear density was measured by XD-1 vibration fibre fineness tester (Shanghai New Fiber Instrument Co., Ltd.). Mechanical properties including tensile strength, modulus and tenacity were determined as a function of OAPS concentration using XG-1A engineering fiber tensile tester (Shanghai New Fiber Instrument Co., Ltd.). The sample specimen was held between the two pneumatically operated grips and subjected to a fixed load using a fixed drawing rate. The sample fibre was cut and fixed on the test clamp with test length being 10 mm and the crosshead speed set to 20.0 mm/min for all tests. 20 runs were performed for each sample to obtain the average results of tensile strengths, elongation ratios and tensile modulus. The impact of addition of POSS on the inter-segmental packing of the PA-66 was determined using an x-ray diffractometer, XRD (Rigaku Ultima3 X-ray instrument).
Results and Discussion
FTIR analysis
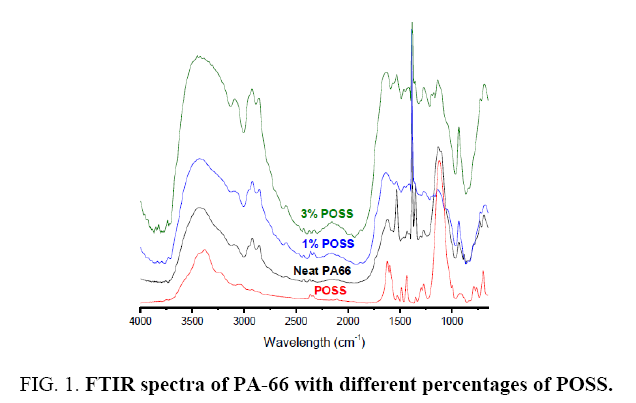
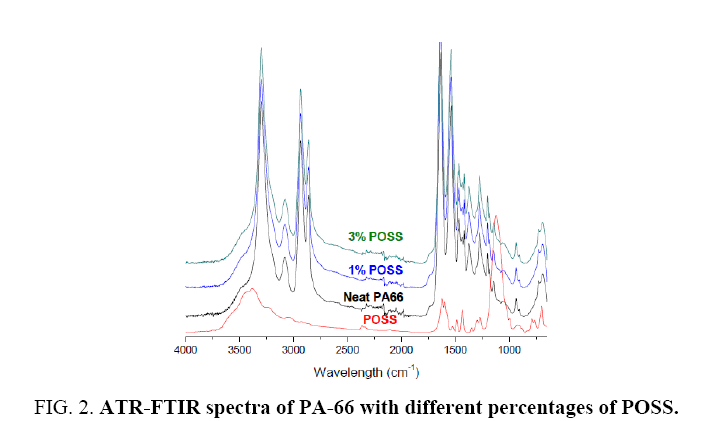
Infrared spectroscopy can be used as a tool to probe interactions between two phases. The FTIR spectrum of the PA66/POSS composites is shown in Figure 1 and 2. No evidence of interactions between PA66 and POSS was seen in both spectral graphs. There is neither change nor shift in the shape of the carbonyl peak at 1715 cm-1. Similarly, the composites do not show any changes in the amine N-H stretch (3296 cm-1), amide I (1634 cm-1) or amide II (1538 cm-1) peaks (C=O stretch in amides), [10] indicating no interactions between PA-66 and POSS.
Tensile properties
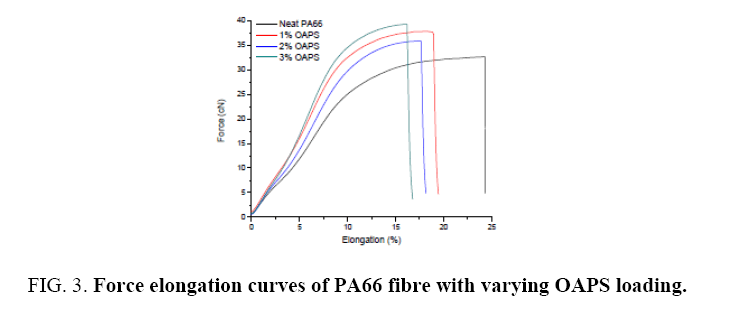
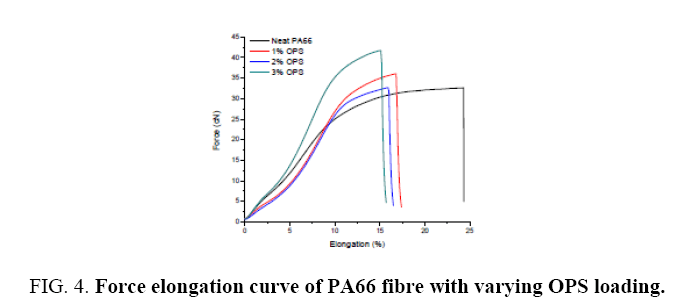
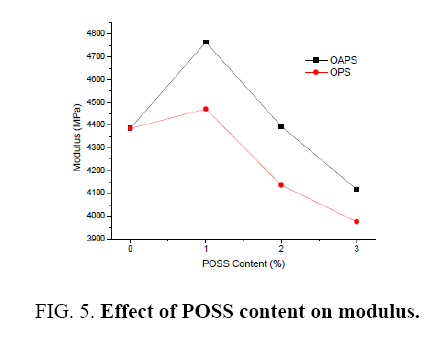
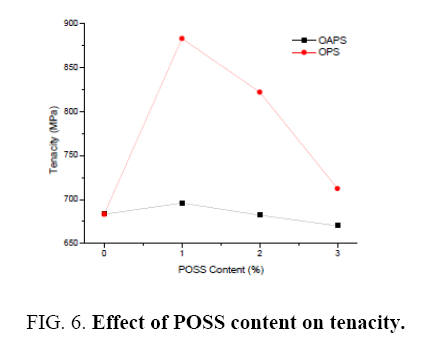
The strength tester calculated the mean of force, elongation, tenacity, work done to break and modulus. The variation of tensile strength and modulus of the PA-66/POSS nanocomposites with the POSS content is shown in Figure 3 and 4 and summarized in Table 2.
| Sample | Elongation (%) | Modulus (MPa) | Tenacity (MPa) |
|---|---|---|---|
| Neat PA-66 | 24.34 | 4386.31 | 683.16 |
| 1% OAPS | 18.98 | 4765.35 | 695.99 |
| 2% OAPS | 17.97 | 4394.9 | 682.11 |
| 3% OAPS | 16.5 | 4117.2 | 670.03 |
| 1% OPS | 17.11 | 4471.07 | 883.21 |
| 2% OPS | 16.31 | 4136.39 | 822.17 |
| 3% OPS | 15.51 | 3974.95 | 712.4 |
Table 2: Comparison of tensile properties of neat PA66 with varying POSS loading.
0As POSS content increased, the tensile strength and tensile modulus of the PA66/POSS nanocomposites were improved due to the reinforcement effect of POSS with high aspect ratios, and this improvement being more significant at lower POSS content (1%). However, nanoparticles often tend to bundle together because intrinsic Van der Waals attraction between the individual cubes in combination with high aspect ratio and surface area of the nanoparticles, leads to some agglomeration, and thus prevents efficient load transfer to the polymer matrix [11].
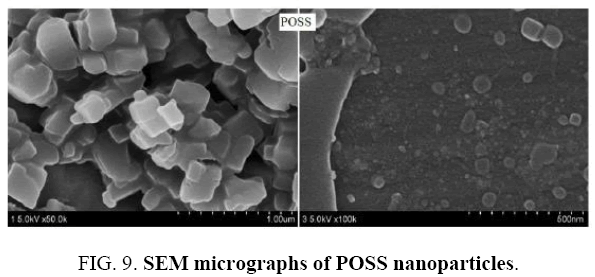
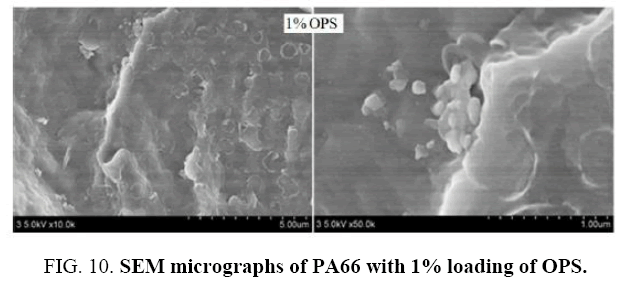
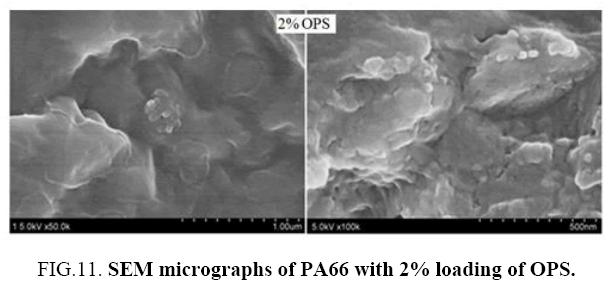
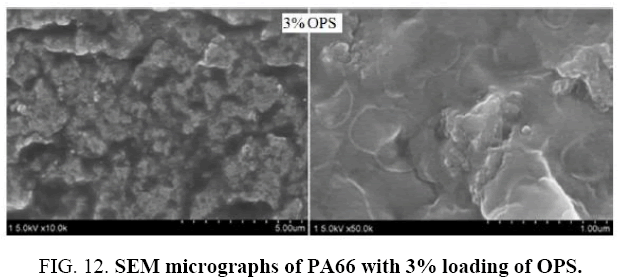
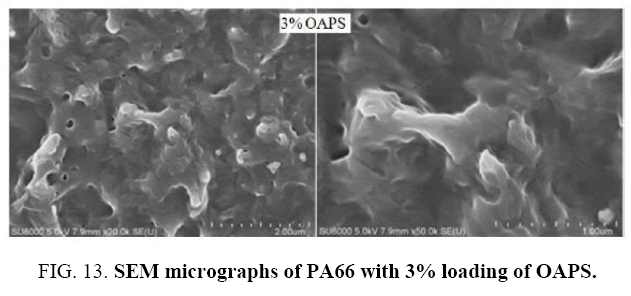
At higher POSS content, less uniformly dispersed and more agglomerated bundles of POSS were formed in the PA66 matrix, as seen from SEM images (Figure 5-13), which may have resulted into stress concentration phenomenon. As a result, the tensile modulus of the PA66/POSS nanocomposites decreased significantly at high POSS content (Figure 5), compared with that at low content, resulting from few agglomerated structures of homogeneously dispersed POSS in the polymer nanocomposites.
Therefore, to achieve further enhanced mechanical properties of the PA-66/POSS nanocomposites, the improvement in both the dispersion of POSS in the PA-66 matrix and in the interfacial adhesion between the POSS and the PA-66 matrix through functionalization of POSS should be studied extensively; in our current research OAPS was considered. A significant improvement in modulus was recorded on the PA-66/OAPS fibre nanocomposites compared to PA-66/OPS (Figure 5) counterpart though there was a drop in tenacity (Figure 5). However, it is hypothesized that tenacity will be greatly improved by twisting and plying in the subsequent processing prior to use in tyre cord production [12,13].
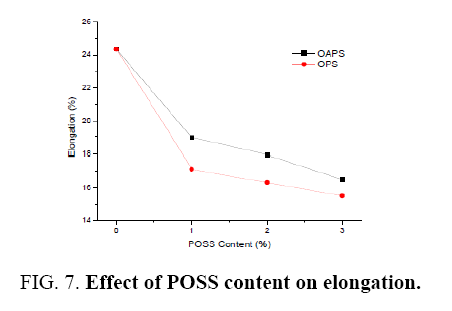
Incorporation of the nanoparticles greatly reduced the elongation of the fiber and the effect is magnificent with increasing POSS loading as shown in Figure 7. This was expected as the nanoparticles will act as barriers to the sliding motion between polymer chains [14]. However, OAPS elongation is slightly higher than that of OPS because OPS are solely incorporated as nanoparticles without any chemical interactions whereas OAPS contain active sites which might have interacted with the polymer chain chemically and thus becomes part of the chain and will slide along. It therefore implies that not only will the hydrogen bonds be responsible for the strength of the fiber but particle inclusions will play a role as well.
Morphology and fracture surfaces
To determine the relationship between the morphological structure and the POSS dispersion of the samples, fiber specimens were analyzed by SEM. As the percentage of POSS loading increased, agglomeration becomes distinctive. From SEM images, high loading display unsatisfactory results because the nanoparticles tend to agglomerate hindering uniform dispersion in the matrix (PA-66).
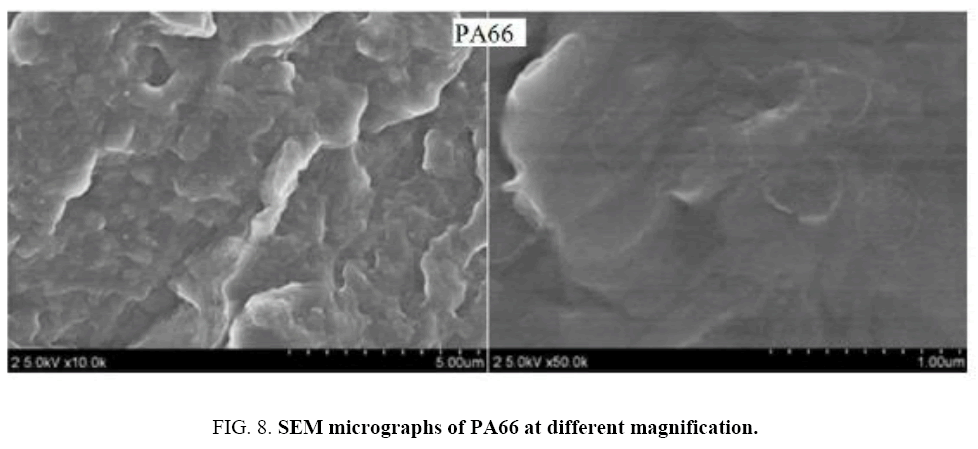
Analysis of the morphology of a polymer-filler blended fiber can give valuable information regarding the homogeneity and dispersion of the filler within a polymer matrix. For example, in case of molecular scale inorganic fillers, agglomeration and phase separation can be monitored using techniques such as SEM. The morphology of the neat PA-66 and the blended films was observed using SEM. Micrographs of pure PA-66, POSS, 1% wt, 2% wt and 3% wt composites are shown in Figure 8 - 13.
At 1% wt, micrographs show a uniform cross section with no visible phase separation. The fracture surfaces are similar to that of the neat PA-66 and are typical for brittle fracture surfaces. However, very small nano-sized agglomerates of POSS are seen for both 2% wt and 3% wt PA-66/POSS nanocomposites.
The SEM micrograph of the 3% wt fiber shows distinct phase separation with formation of distinctive micron size aggregates. Individual POSS particles are of molecular size (1.5 nm) as compared to the polymer matrix [15-17]. Addition of increasing amounts of POSS within the polymer leads to aggregation of inorganic filler and at high POSS loading, a regular array of micron size aggregates of POSS are observed.
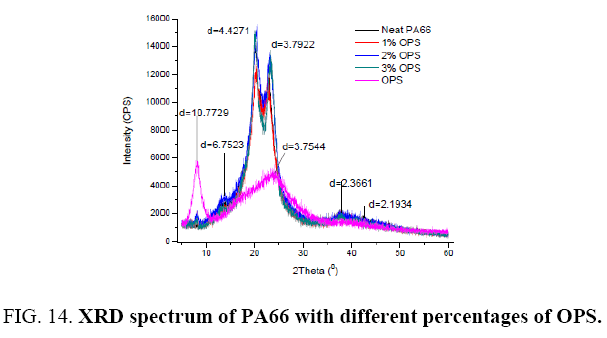
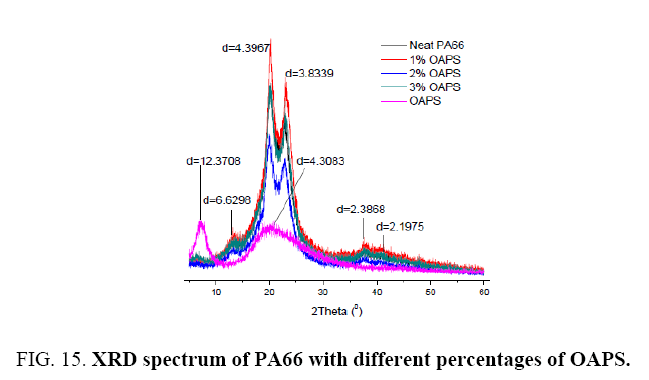
X-ray diffraction is one of the most common and simplest methods for the morphological analysis of nanocomposites. The results obtained from X-ray patterns can be supported with electron microscopic analysis since X-ray beams may hit a non-uniformly dispersed region in a sample due to low concentration of the POSS or immiscibility and disorder in the sample may lead to elimination of a Bragg’s reflection [18].
X-ray patterns of the neat PA-66 and the PA66-POSS composites are given inFigure 14 and 15. Information from XRD patterns of polymers which are amorphous is usually less precise and defined in comparison to those of crystalline polymers. In amorphous polymers, no long range order is seen, but there exists a minimal kind of short range order because of the average distance between neighboring polymer chains. It is because of the order, that the diffraction pattern is observed for non-crystalline polymers [19].
The broad peak pattern for neat PA66 at 2θ ≅ 19° can be attributed to interference from inter-segmental d-spacing. This corresponds to a d-spacing of ~4.6 Å. There is another very broad peak at 2θ ≅ 22° which corresponds to a d-spacing of ~3.9 Å. These are the characteristic peaks of PA66. The XRD pattern for OPS and OAPS also shows a broad peak at 2θ ≅ 8°and 2θ ≅ 7° which corresponds to a d-spacing of ~10 Å and ~12 Å respectively. This d-spacing (~1 nm to ~1.2 nm) corresponds roughly to the core diameter of OPS [20].
There is no shift in the amorphous 2θ peak (~20° and ~22°) of PA66 with the incorporation of POSS in increasing concentrations. Therefore incorporation of POSS within the PA66 matrix has not affected the inter-segmental distance or packing of the polymer chains. Nevertheless, there is a substantial change occurring at lower angles or higher d-spacing’s with increasing POSS concentration. At 2% wt and 3% wt OAPS, there is just a very slight shift to higher angle. This peak for the PA66-POSS composites can be a combination of diffraction from the POSS cages as well as some long range ordering of the polymer chains.
Therefore, it can be concluded from XRD studies that the inter-segmental packing of the polymer chains is not disrupted by the incorporation of POSS.
Conclusion and Recommendations
In this study, the morphological and mechanical analysis of PA66/POSS nanocomposite was discussed in order to understand the properties of PA66 matrix since the synthesis and the thermal properties have been discussed in our previous work.
The main differences between the structures due to the dispersion of POSS particles, and the compatibility of POSS types with PA66 were studied. The most tortuous path was observed at 1% wt POSS loading implying the highest degree of dispersion and intercalation. At higher POSS content (3%), the nanoparticles remained mostly as aggregates giving rise to poor properties. Among the POSS types, generally the OAPS produced the highest tortuous structure in SEM micrographs.
Incorporation of POSS at different loadings impacted the mechanical properties. Although the composite fibers were optically clear, nano scale aggregates of POSS was observed under SEM which increased in size with increase in concentration. The 1% POSS content recorded appealing results because of the inhibited agglomeration due to low POSS loading which favored better dispersion of the nanoparticles as observed in the SEM micrographs at higher degrees of particle exfoliation.
Nearly all the mechanical properties were found to increase with the POSS loading. Tensile modulus and tenacity increased by up to 8% and 2% respectively. However, it was seen that 3% POSS loading does not give the material performance enhancements mainly due to higher degree of agglomeration causing defect points in the structure.
The ultimate performance of the resultant composite fiber is greatly determined by the dispersion of the nanoparticles. Detailed SEM and TEM analysis of the composite fibers holds more information on dispersion and interaction of the nanoparticles and polymer matrix. Probing the composites using electron microscopy would give more information on the nature of aggregation of POSS and the precise manner in which it affects the surrounding polymer matrix. Silicon mapping using SEM would also assist in understanding the distribution of POSS within the polymer matrix. Since POSS are only 1.5 nm in diameter, TEM imaging would be useful in understanding critical concentration required for agglomeration and also the mechanism of formation of regularly shaped agglomerates at high loadings. TEM can also be used to investigate actual structure of POSS itself, whether functionalization techniques has caused any distortion to the size and shape of the Si-O core cage.
References
- Alexandre M,Dubois P. Polymer-layered silicate nanocomposites: Preparation, properties and uses of a new class of materials. Mater SciEng C. 2000;15;28(1):1-63.
- Schmidt D, Shah D,Giannelis EP. New advances in polymer/layered silicate nanocomposites. CurrOpin Solid State Mater Sci. 2002;30;6(3):205-12.
- Xu X, Li B, Lu H, et al. The interface structure of nano-SiO 2/PA66 composites and its influence on material's mechanical and thermal properties. Appl Surf Sci.2007;254(5):1456-62.
- Mark HF. Encyclopedia of Polymer Science and Technology, Vol. 12. Set. John Wiley & Sons, Inc., New Jersey, USA; 2005.
- Kirk RE,Othmer DF. Encyclopedia of Chemical Technology. Vol. 2. The Interscience EncyclopediaInc; New York, USA; 1953.
- Bunn CW,Garner EV. The crystal structures of two polyamides ('nylons'). In: Proceedings of the Royal Society of London A: Philos Trans Royal Soc. A.1947;189(1016):39-68.
- Lichtenhan JD. Polyhedral oligomericsilsesquioxanes: Building blocks for silsesquioxane-based polymers and hybrid materials. Comments on Inorganic Chemistry. 1995;17(2):115-30.
- Jacob, Edison, Fredrick, et al.Thermal analysis of polyamide-66/POSS nanocomposite fiber.International IJETR.2017;7(4):35-40.
- Koech, Shao, Mutua, et al. Application of hydrazine hydrate in the synthesis of octa(aminophenyl)silsesquioxane (OAPS). Poss.2013;3(1): 93-97.
- Socrates G. Infrared and Raman characteristic group frequencies: Tables and charts. John Wiley & Sons; 2001.
- Ma PC, Siddiqui NA, Marom G, et al. Dispersion and functionalization of carbon nanotubes for polymer-based nanocomposites: A review. Compos Part A ApplSci Manuf. 2010;41(10):1345-67.
- AS Hockenberger, S Koral. Effect of twist on the performance of tire cord yarns. IJFTR.2004;29(1):19-24.
- Aytac A, Yilmaz B,Deniz V. Effect of twist level on tyre cord performance. Fibers and Polymers. 2009;10(2):221-5.
- Díez-PascualAM, Xu C,Luque R. Development and characterization of novel poly (ether ether ketone)/ZnObionanocomposites. J Mater Chem B. 2014;2(20):3065-78.
- Hybrid:The creator of POSS® [Internet]. Hattiesburg: Hybrid Plastics Inc.; 2016 [cited 2017 Dec 01]. Available from: http://www.eatright.org/.
- Hartmann-Thompson C. Polyhedral oligomericsilsesquioxanes in electronics and energy applications. In: Applications of Polyhedral OligomericSilsesquioxanes. 2011:247-325.
- Tamaki R, Choi J, Laine RM. A polyimide nanocomposite from octa (aminophenyl) silsesquioxane. Chem Mater. 2003;15(3):793-7.
- Morgan AB,Gilman JW. Characterization of polymer-layered silicate (clay) nanocomposites by transmission electron microscopy and X-ray diffraction: A comparative study. J ApplPolym Sci. 2003;87(8):1329-38.
- Kulkarni. Effect of polyhedral oligomericsilsesquioxane on gas transport properties of polyimide. 2007, University of Toledo.
- Choi J, Tamaki R, Kim SG, et al. Organic/inorganic imide nanocomposites from aminophenylsilsesquioxanes. Chem Mater. 2003;15(17):3365-75.
