Original Article
, Volume: 14( 4)Flow Pattern and Liquid Holdup Prediction in Multiphase Flow by Machine Learning Approach
- *Correspondence:
- Chandrasekaran S , Petroleum Engineering Program, Department of Ocean Engineering, IIT-Madras, Chennai-600036, India. Tel: +91-9840261010; E-Mail: sridharavc@gmail.com
Received: August 27, 2018; Accepted: August 27, 2018; Published: September 3, 2018
Citation: Chandrasekaran S, Kumar S. Flow Pattern and Liquid Holdup Prediction in Multiphase Flow by Machine Learning Approach. Environ Sci Ind J. 2018;14(4):173
Abstract
In this work, data models are developed by artificial intelligence techniques to predict the flow patterns and to predict liquid hold up during multiphase flow in the drilling phase and production phase of petroleum exploration process. This is significant because early alerting and mitigation of kick, which is a multiphase flow, is important from the safety of the drillers and preventing unwanted catastrophe of life and property. In the production process of petroleum industry, addressing this problem is significant to know about the productivity of the well, design of the transport system and refining process. It is shown that these methods were able to match and improved the prediction performance from multiphase empirical correlations. Different neural network model structures and machine learning classification and regression algorithms were evaluated and optimized to determine the best models that performs prediction accurately. The data for developing the models was collected from experiments in literature where two phase flow of air-kerosene in inclined pipes were studied.
Keywords
Classification-multiphase flow; regression; empirical models
Introduction
Multiphase flow is the simultaneous flow of two or more phases during fluid flow. In the petroleum industry such flow takes place during the production and during the drilling process where accurate determination of pressure gradient in the wellbore is important. In the drilling process, the multiphase flow phenomenon occurs during kick which is an unwanted influx of formation fluids or gas into the wellbore driven by the pressure gradient between the reservoir and wellbore. In the production process, gas-liquid mixtures are transported over long distances under large pressure differential which influence the design of the production system and the net productivity. In both the cases, uncertainty in the pressure drop and flow regimes significantly affects the pressure distribution along the well bore. Accurate determination of pressure drop and flow regimes enables the proper choice of well control procedure in the event of a kick and blowout. Due to the complex in-homogeneous nature of multiphase flow, no physical equations has been developed that completely describes them. The multiphase correlations and models developed by the researchers over time are empirical and highly subjective to the flow conditions under which those relations were established [1].
Pressure distribution during the gas-liquid multiphase flow is different than a single phase flow. When the gas and liquid flow together, they tend to separate because of the variation in fluid properties (density, viscosity). In the vertical flow, gas and liquid will normally not travel with the same velocity because of the variation in the shear stress. In multiphase flow of gas and liquid, each phase flow flows through a smaller area when compared to single phase flow and hence results in pressure loss for each of the phase. Gas tends to flow with higher velocity than liquids as it is less dense, less viscous and compressible. In the process, they tend to slip past the liquid phase at the interface at varying degree of roughness depending on the flow pattern. In order to model the multiphase flow phenomenon, researchers extend the single phase flow methods to multiphase flow but with additional “mixing” rules and hence, several correlations are proposed to define the holdup and flow patterns for horizontal, vertical, and inclined pipes. Hold up is defined as the volume fraction of the single phase occupied in the domain in the presence of two or more phases. In this work, Duns and Ros Correlation [2] and Mukherjee Correlation are implemented and considered as baseline empirical models. These correlations are based on experimental work conducted under specific conditions such as a constant pipe diameter [3].
In general, there are four flow regimes for vertical upward multiphase flow namely, bubble, slug, churn and annular mist flow as shown in FIG. 1. The flow regimes vary in the order by increasing gas velocity for a given liquid velocity [4]. In the bubble flow, the continuous phase is liquid and the gas phase is observed in small bubbles moving with varying velocity and contributes less for the pressure drop and hold up. In the slug flow, the smaller gas bubbles coalesce to form Taylor bubbles at higher gas velocity. Liquid is still the continuous phase. In churn flow, the gas bubbles disintegrate. It is a turbulent phase and neither liquid nor gas forms a continuous phase. As the gas velocity increases, the gas bubbles forms a continuous phase and the liquid is found as film coating on the pipe wall resulting in annular flow [5].

Figure 1: Flow pattern.
Besides empirical correlations and mechanistic models, artificial intelligence techniques have been developed by petroleum researches to solve the pressure gradient issue and flow regime identification automatically. This technology is based on the ability to detect patterns which is not visible to the naked eye [3]. Complex relation in hold up prediction and flow pattern recognition can be extracted through machine learning and artificial intelligence methods thereby offering insights in the data from noisy environment [6].
Materials and Methods
In this work, a machine learning approach is employed to understand the holdup and the flow pattern identification in multiphase conditions in pipes by adopting a supervised learning technique. The approach understands the pattern between the experimental parameters and establishes a relation between them. This relation is stored in the machine learning models and further extended to predict flow patterns under a different input condition.
The data for this work was obtained from Mukherjee [7] which covered different aspects of the flow (upward and downward) and at different inclinations. The summary of the data is described in FIG. 2.

Figure 2: Mukherjee data set.
In this upward flow experiment, the two phase mixture of compressed air-kerosene was allowed to pass through a 1.5 inch diameter pipe, 56 ft. in length and at different conditions of pressure, temperature. The hold up and the flow pattern was observed at the end of the pipe for every observation of pressure and temperature. Out of the 610 observations, the slug flow was the dominant pattern occurring 390 times and stratified flow the least with only 12 times.
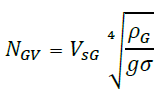
Earlier work on flow pattern classification focused on flow pattern maps [8]. Generally, to develop a flow pattern map visual inference, of the flow pattern was plotted with experimental observation which best influences the flow regimes. Gas velocity number and liquid velocity numbers are non-dimensional numbers which best represents the temperature, pressure and fluid properties in the experiment, are employed as ordinates and abscissa respectively. Gas velocity number is given by,
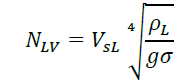
Liquid velocity number is given by,
In this work, two data models are develop to study the multiphase flow phenomenon. One mode is to perform classification of flow patterns and the other model is to perform prediction of hold up. The data models are developed by supervised learning algorithms that require a dataset to learn, validate and test. The classification problem to predict type of flow patterns, was solved by four types of algorithm namely, random forest algorithm, logistic regression, support vector machines and multi-layer perceptron classifier. The learning process for each of these methods vary and for Support Vector Machines (SVM), the process of learning in support vector machine takes the training data to higher dimensional space, thus to avoid non-linearity of low dimensional space and suitable when the input data is limited. SVM model finds the maximum separating hyper-plane that can maximize the distance to training data ensuring generalization and global optima. The logistic regression model measures the relationship between the input variables by measuring the logistic function. The random trees are a class of ensemble learning method where the input space is split into a number of decision trees during training and the output class is the mode of the individual decision trees during prediction. Neural network model was also developed for the classification problem. A three layer back propagation network was employed with seven neurons in the hidden layer and four neurons in the output layer, each output neuron corresponding to mist, slug, stratified and bubble flow patterns [9]. The inputs to the data model are the gas velocity number, liquid velocity number, inclination; hold up values, pressures, temperature, specific gravities (FIG. 3).

Figure 3: Multi-layer perceptron.
The hyper tuning of the parameters of the machine learning algorithms are performed by grid search optimization where the individual model parameters (for example, the number of decision trees is a model parameter for random forest method) are selected and scored against the model. The parameters of the algorithm, which provides the best score in the model is chosen as its tuned parameters and retained for further evaluation. In classification problems, confusion matrix is the common way in which the results of the algorithm are scored. A confusion matrix is a table (two dimensional array) that can be used to describe the performance of a classifier with one axis representing the prediction and the other axis representing the actual.
A multi-layer perceptron neural network model was built to predict the hold up. It is observed in the experiment that there are few observations of pressure which were missing. The non-existent pressure observations were filled with near estimates during the pre-processing by data imputation technique. The input neurons are similar to the classification problem but the output in this case is the hold-up parameter. In the training phase of the model, 90% of the data set was taken into consideration while the 10% is set aside for testing. Different learning criteria and activation functions were studied to design the optimum neural network with a computer program. At the end of each training, upon stabilization, the developed model was applied to the test set and the predicted hold up is calculated. The model parameters are hyper tuned by grid search optimization so that the model generalize and the number of layers was estimated to be 7 with 17 nodes in each layer. In order to validate the prediction, two analytical models are taken as reference namely Mukherjee correlation [10] and Duns & Ros Correlation [2].
Results and Discussion
FIG. 4 shows the plot of all data points used in the study from Mukherjee experiment [7]. The superficial gas velocity is represented by abscissa between the scales from (0.1 to 100) ft/s and the superficial liquid velocity is represented by the ordinate between the scales from (0.07 to 12) ft/s. The experimental data represented in the FIG. 4, is for air-kerosene flow and for all the inclinations in the study. It is observed that the data do not contain any significant patterns with clear clusters among the four flow classification. It is evident there exists a complex relationship between the flow pattern observed and the parameters of the experiments namely temperature, pressure, hold up, fluid properties, inclination of the flow and geometry.

Figure 4: Mukherjee experiment.
FIG. 5-7 shows the comparison of measured and predicted hold up by three different models namely Mukherjee model, Duns and Ros Model and Neural network model. For each model, the correlation coefficient squared (R2) was determined. It is observed that all the models show good agreement between the prediction and the experimental results in the overall sense. As the number of data points is significantly lesser in stratified and mist flow, the comparisons between them may not be significant. However, it is observed that the predictions from the neural network model had a better correlation coefficient (0.94) than the theoretical models which were 0.89 and 0.9 respectively (TABLE 1) [2,3].

Figure 5: Data Model for predicting holdup-All predictions.

Figure 6: Data model for predicting holdup-bubble and slug flow.

Figure 7: Mukherjee and Duns and Ros Correlation.
| Flow | Mukherjee Correlation | Duns & Ros Correlation | Data Model |
|---|---|---|---|
| Slug Flow | 0.937 | 0.935 | 0.939 |
| Bubble Flow | 0.724 | 0.689 | 0.781 |
| Overall | 0.9 | 0.89 | 0.94 |
Table 1: Comparison of hold up relations.
In this study, the input and the output pressure differential which is represented as pressure gradient, is provided as an input parameters. In the experimental observation, in which the pressure gradient was unknown, the data imputation technique was implemented and this resulted in increasing the confidence of the prediction. The data imputation technique adopted was a multi-layer perceptron regressor which is also a neural network scheme. This feature engineering technique enabled us to build a correlation neural network model with the know pressure observation and extend them to predict an estimate for the unknown observation.
FIG. 8-10 shows the flow pattern prediction obtained by Mukherjee Model, Duns and Ros model and machine learning models. The results are represented in terms of a pie chart which represents the classification of flow pattern observed in the experiment against the flow pattern predicted by the models. In FIG. 10, for the actual mist flow, the data model predicted 80 percent instances of mist flow, 19 percent instances of stratified flow and 1 percent instance of slug flow. In general, the data model was able to predict 80 percent instances of true mist flow, 67 percent of true stratified flow, 89 percent of true slug flow and 69 instances of true bubble flow accurately. Among the flow patterns, slug flow prediction was the highest with 89 percent. Although, this could be related to the number of instances in the training data, nevertheless it important to note that the model is able to generalize well for other types of pattern prediction as the accuracy is also very high. The data model follows closely with the Mukherjee model (FIG. 8) prediction for slug, stratified and annular mist flow and performs better for bubble flow. The data model is also better in terms of prediction than the Duns & Ros model (FIG. 9) for slug and annular mist flow patterns. However, for the bubble flow, the Duns and Ros model, the accuracy is 80% which is better than data model (69%). The Duns and Ros model do not have a separate classification for stratified flow and most of them falls under the class of slug flow. The data model predicts better than the Mukherjee model in the stratified flow, bubble flow regimes and predicts better than the Dun and Ros model in bubble, slug flow regimes. The data model also serves as a generalization model closely matching the experimental observations.

Figure 8: Mukherjee Model.

Figure 9: Duns and Ros Model.

Figure 10: Machine learning model.
It is also observed in the data model, for the mist flow the model classifies 19% as slug flow incorrectly, for the stratified flow, the model classifies 17% as the slug flow incorrectly and for the bubble flow, the model classifies 31% as slug flow incorrectly. This implies that the input pattern identified by the data model under slug conditions, are related and simple than the pattern existing for other flow patterns.
The data model presented in the above discussion for flow regime classification was a random forest evaluation algorithm. A simple study was conducted to determine the best machine learning algorithm for this data set. The data was divided into many sets of random training datasets and testing datasets. Different machine learning algorithms were applied on this dataset and the aggregate score of different techniques were compared as shown in TABLE 2. The result showed that the random forest classifier was able to classify flow patterns efficiently than other methods. The random forest is a better classification algorithm because the logistic regression and SVM can be a good classifier with non-linear boundaries and limited number of instances. This also implies that the classification boundaries between the flow patterns in the Mukherjee experiment are linear and general which makes the random forest more successful with our input dataset.
| Method | Accuracy |
|---|---|
| Logistic Regression | 0.737 |
| Support Vector Machine | 0.798 |
| Random Forest | 0.854 |
| Neural Network | 0.830 |
Table 2: Classifier Algorithms
Conclusion
In this work two data models were successfully developed and applied to hold up prediction and flow regime prediction at various inclination of pipe flow. These models were successfully able to understand the complex relationship that exist in multiphase fluid flow of air-liquid phases and extend it to predict on different input scenario. The developed model was based on the experimental results from Mukherjee correlation for lower operating pressure regimes. The model input variables include superficial velocities, densities, viscosities of the two phases, pressure and temperature and the output variables are hold up and flow pattern. It is found that the prediction accuracy of the novel neural network model was much superior to the Mukherjee and Duns and Ros empirical correlations [11]. In addition to the accuracy, the data model was able to generalize well and hence, could be extended to different experimental and real world scenarios. For the flow pattern classification, the random forest algorithm which is based on decision trees is able to classify the flow patterns accurately from the experimental results. The flow pattern under consideration was slug, stratified, bubble and annular mist flow and it is found that the data model is able to classify close to 89% slug flow and 70% bubble flow accurately better than the previous studies.
References
- Pucknell JK, Mason JN, Vervest EG. An Evaluation of Recent" Mechanistic" Models of Multiphase Flow for Predicting Pressure Drops in Oil and Gas Wells. In Offshore Europe 1993. Society of Petroleum Engineers
- Duns Jr H, Ros NC. Vertical flow of gas and liquid mixtures in wells. In 6th world petroleum congress 1963. World Petroleum Congress.
- Mukherjee H, Brill JP. Multiphase flow in wells. Monograph from society of petroleum engineers Inc. Richardson, Texas. 1999.
- Zavareh F, Hill AD, Podio A. Flow regimes in vertical and inclined oil/water flow in pipes. In SPE Annual Technical Conference and Exhibition 1988. Society of Petroleum Engineers.
- Orkiszewski J. Predicting two-phase pressure drops in vertical pipe. J Pet Tech. 1967;19(06):829-38.
- Al-Naser M, Elshafei M, Al-Sarkhi A. Artificial neural network application for multiphase flow patterns detection: A new approach. J Pet Sci Eng. 2016;145:548-64.
- Mukherjee H. An experimental study of inclined two-phase flow.1979.
- Beggs DH, Brill JP. A study of two-phase flow in inclined pipes. J Pet Tech. 1973;25(05):607-17.
- Jahanandish I, Salimifard B, Jalalifar H. Predicting bottomhole pressure in vertical multiphase flowing wells using artificial neural networks. J Pet Sci Eng. 2011;75(3-4):336-42.
- Ashena R, Moghadasi J. Bottom hole pressure estimation using evolved neural networks by real coded ant colony optimization and genetic algorithm. J Pet Sci Eng. 2011;77(3-4):375-85.
- Mukherjee H, Brill JP, Beggs HD. Experimental study of oil-water flow in inclined pipes. J Energy Resour Technol. 1981;103(1):56-66.

