Original Article
, Volume: 9( 5)Comparison of Total Antioxidant Capacity, Polyphenolic, and Anthocyanins Contents from Some Varieties of Dry Beans of Burkina
Adama H1*, Eloi P1, Abdoulaye S2 and Mouhoussine N1
1Department of Chemistry, UFR-SEA, University Ouaga I Pr. Joseph Ki-Zerbo, 03 BP 7021 Ouagadougou 03, Burkina Faso
2Department of Natural Products, 03 BP 7047 Ouagadougou 03 Burkina Faso
- *Correspondence:
- Adama H, Department of Chemistry, UFR-SEA, University Ouaga I Pr. Joseph Ki-Zerbo, 03 BP 7021 Ouagadougou 03, Burkina Faso, Tel: 22663332087; E-mail: hemaadama@yahoo.fr
Received: May 19, 2016; Accepted: Jun 10, 2016; Published: Jun 17, 2016
Citation: Hema A, Pale E, Sereme A, et al. Comparison of Total Antioxidant Capacity, Polyphenolic, and Anthocyanins Contents from Some Varieties of Dry Beans of Burkina. ChemXpress. 2016;9(5): 101.
Abstract
Total polyphenolics (TPP), anthocyanins (TAT) contents and total antioxidant capacity (TAC) of grains and leaves from fourteen local varieties of dry beans grown in Burkina were studied using Folin-Ciocalteu, DPPH, and total anthocyanin assays. Extracted with 70% aqueous acetone, TPP, TAT contents and TAC were determined spectrophotometrically. All measurements are made in duplicates with a coefficient of variation less than 10%. In relation to those of leaves, grains extracts had the highest TAC and TPP values. Then, the highest TAC value of grains (01 CC-26 (77.57 ± 0.08 μmoles of Quercetin Equivalents (QE) per gram of dried material) is higher than the highest TAC value of leaves (Gaoua Local (GR) (9.48 ± 0.08 μmoles of QE per gram of fresh material). Indeed, between TAC values (from Gaoua Local (GR) (9.48 ± 0.08 μmoles of QE per gram of fresh material) to IT 93K-93-10 (2.84 ± 0.13 μmoles of QE per gram of fresh material) and TPP content (from 01 CC-26 (31.67 ± 0.28 μg of Gallic Acid Equivalents per gram of fresh material to IT 85F 867-5 (23.12 ± 0.04 μg of GAE per gram of fresh material) of leaves there was the best correlation (R=0.947).
Keywords
Dry beans; Grains and leaves extract; Antioxidant capacity; Polyphenolic compounds; Anthocyanins contents
Introduction
Polyphenolics are common constituents of foods of plants origin and major antioxidants of our diet [1]. It’s well known that polyphenolics intake is associated with a protective effect from coronary diseases and risks of cancer [2,3]. In recent years, antioxidants have been the subject of many epidemiological studies that have related their consumption with a reduction in the incidence of cardiovascular diseases and cancers [4,5]. Phytochemicals and antioxidants constituents in plant material have raised interest among scientists, food manufacturers, producers, and consumers for their roles in the maintenance of human health [6]. Numerous epidemiological studies suggest that diets rich in phytochemicals antioxidants execute a protective role in health and disease [7,8]. Frequent consumption of fruits and vegetables is associated with a lowered risk of cancer, heart disease, hypertension and stroke [9,10]. Antioxidants are compounds that help to delay and inhibit lipid oxidation and when added to foods tend to minimize rancidity, retard the formation of toxic products, maintain the nutritional quality and increase their shelf life [11,12].
The major groups of phytochemicals that may contribute to the total antioxidant capacity (TAC) of plant foods include polyphenols, carotenoids and the traditional antioxidant vitamins such as vitamin C and vitamin E. Then, vitamins are not the only phytochemicals present in plant foods that may have positive effects on the health of consumers [13]. These phytochemicals may be present in small amounts but may be very important to the health of consumers [14]. Common beans are an important source of protein, carbohydrates, vitamins, and minerals. They are also an excellent source of nutraceutical constituents such as fiber, protease inhibitors, phytic acid, and polyphenols such as tannins [15]. The bean seed coat color is attributed to the presence and quantity of polyphenols such as flavonol glycosides, condensed tannins, and anthocyanins [16], and their function is to protect the seed against pathogens and predators [17]. These compounds have antioxidant, antimutagenic, and anticarcinogenic activities and also free radical scavenger properties [18]. However, there is little information about the content of phenolic compounds in cultivated common bean seeds and leaves of Burkina, and no possible correlations have been established between phenolic content and antioxidant activities.
Then the objective of this study was to measure and compare the TAC, TPP and TAT of fourteen local varieties grown and consumed in Burkina. It carried on both young leaves and grains harvested from plants of these local varieties. These data will be used to estimate the phytochemical and antioxidant intake of the population and may lead to deep studies of these plants by botanists for their valorisation.
Materials and Methods
Reagents
DPPH and Folin-Ciocalteu phenol reagent were obtained from Labosi Chemical Co. (St. Louis, MO).
Standards and samples
Gallic acid, Quercetin were obtained Fluka Chemical
Sampling and sample preparation
Sampling: Grains used for the culture were obtained from the experimental station of INERA (Institut de l’Environnement et de Recherches Agricoles). They had been given with the following codes: Unknown; IT 93K-93-10; IT 97K-556-6; IT X; IT 97K1069-2; IT 85F-3139; IT 85F 867-5; IT90K 284-2; IT82E -18; 01 CC-26; Gaoua Local (GR); IT 97K 556-4 ; UCR 779; 01 FCV 59; 01 CC 26-34 and IT 98 K-128-4.
Harvest of the leaves: Leaves used were harvested in the garden cultivated on the site of University of Ouagadougou. Three months after germination, young leaves were harvested from each local variety.
Harvest of the grains: Grains were also harvested from the same garden accurately in order to avoid mixing of the different varieties.
Samples extraction and assays: Samples (15 g) were crushed and homogenized in a 200 mL flask and extracted three times with 50 mL of a mixture containing acetone, water, and acetic acid (70:29.5:0.5 v/v) [19]. Samples were vortexed and allowed to stand for 30 min at room temperature to allow for complete solvent extraction. Extracts are accurately filtered through a Wathman N°1 filter after which, filtrates underwent to a liquid-liquid extraction successively with 50 mL, 10 mL (twice) of chloroform. The volume obtained from these different steps was accurately measured for each sample and stored at 4°C until the assays.
Extraction of the grains has been done as described above but with a little difference due to their availability. So, only about 0.85 g of crushed material was extracted with 10 mL of the mixture overnight.
Total antioxidant assay: The method of Brand-Williams et al. was used with slight modifications in this experiment [20,21]. For the standard curves, DPPH radical was dissolved in ethanol (3.94 mg/100 mL or 10-4M). Various concentrations of 500 μL of standard solution (2 mg/50 mL or 118.34 μM) were added to 3 mL of the DPPH radical solution. The mixture was then shaken vigorously and allowed to stand at the room temperature in the dark for 10 min, and the decrease of absorbance at 517 nm was measured using a CIBA-CORNING UV-vis. Spectrophotometer. Absorbances of 500 μL of the samples reported to the standard curves allowed to determine the TAC expressed in micromoles of quercetin equivalents per gram of fresh/dried material. The radical stock solution was freshly prepared each day.
Total polyphenol assay: the total phenolic phytochemical concentration was measured using the Folin-Ciocalteu method [22]. Briefly, 50 μL of appropriate diluted samples and a standard solution of gallic acid were mixed with 2.5 mL of Folin- Ciocalteu’s Reagent (FCR 1:10 dilution) and left to stand for 8 min at room temperature to allow for the FCR to react completely with the oxidibles substances or phenolates. 2 ml of Na2CO3 (7.5% in water) were added to destroy the residual reagent. The absorbances were measured at 760 nm using a CIBA-CORNING UV-vis Spectrophotometer after incubation for 30 min at 37°C. The total phenolic contents of the samples were expressed in micrograms of gallic acid equivalents (GAE) per gram of fresh/dried material. All samples were prepared in duplicates.
Total anthocyanin assay: The total anthocyanin content of the food was estimated with a CIBA-CORNING UV-vis Spectrophotometer by the pH-differential method [23] using two buffer systems-potassium chloride buffer, pH 1.0 (0.025 M) and acetate buffer, pH 4.5 (0.4M).
Briefly, 0.5 mL of the extract was mixed with 3.5 mL of corresponding buffers and read against a blank at 510 and 700 nm.
Absorbance (A) was calculated as:  . Monomeric anthocyanin pigment
concentration in the extract was calculated as cyanidin-3-glucoside
. Monomeric anthocyanin pigment
concentration in the extract was calculated as cyanidin-3-glucoside 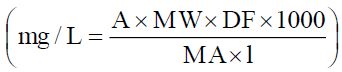 Where A: Absorbance; MW: Molecular Weight; (449.2); DF: Dilution Factor; MA: Molar Absorptivity (26900). The total
anthocyanin content was expressed in micrograms of cyanidin-3-glucoside per gram of fresh/dried material.
Where A: Absorbance; MW: Molecular Weight; (449.2); DF: Dilution Factor; MA: Molar Absorptivity (26900). The total
anthocyanin content was expressed in micrograms of cyanidin-3-glucoside per gram of fresh/dried material.
Statistical Analysis: All data were reported as Mean ± Standard Deviation of two determinations. The results were compared by Analysis of Variance (one-Way ANOVA analysis with replication) using the Genstat 14th = version statistical analysis. Variances determined allow to calculate the SD which allow to calculate coefficients of variation by the following relation:
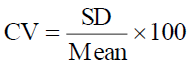 . CV was always less than 10%.
Differences at P<0.05 were considered to be statistically significant
Results and Discussion
Results
Discussion
Table 1 show results obtained from the comparison of the fourteen local varieties. It reveals that all extracts studied contained active substances evaluated by DPPH method. All calculations made on the basis of two measurements show low coefficients of variation less than 10% [24]. From the results of Table 1, it appears that leaves extracts of the local Gaoua (GR) variety had the highest antioxidant activity (9.48 ± 0.06) followed by those from IT 98K-128-4 and IT 97 k-1069-2 varieties. Furthermore it was noted that leaves extracts of the varieties from IT 85F 867-5, IT 97K-556-6 and IT93K-93-10 present the lowest radical scavenging activities. Either a relative decrease of more than 70% from local Gaoua (GR) extracts to those from IT93k-93-10. The established correlation between the levels of polyphenols from leaves and radical scavenging activities reveals that the phenolic molecules are responsible for almost 95% of the active properties of extracts.
| Sample | Leaves | Grains | ||||
|---|---|---|---|---|---|---|
| TACa-L | TPPb-L | TATc-L | TACa-G | TPPb-G | TATc-G | |
| Variety | ||||||
| Unknown | 6.35 ± 0.13 | 28.55 ± 0.41A’ | 0.724 ± 0.01 | 75.91 ± 0.14 | 133.45 ± 0.14 | nd |
| IT 93K-93-10 | 2.84 ± 0.13 | 31.25 ± 0.08B’ | 0.204 ± 0.006 | 67.74 ± 0.04 | 145.76 ± 0.13 | nd |
| IT 97K-556-6 | 4.21 ± 0.17 | 29.00 ± 0.15 | nd | 54.11 ± 0.23 | 144.16 ± 0.13 | nd |
| IT X | 5.57 ± 0.17A | 29.78 ± 0.21C’ | nd | 74.68 ± 0.14 | 158.93 ± 0.11 | nd |
| IT 97K1069-2 | 7.56 ± 0.14B | 25.85 ± 0.11 | nd | 52.19 ± 0.25 | 98.76 ± 0.13 | nd |
| IT 85F-3139 | 5.83 ± 0.13 | 25.24 ± 0.14 | nd | 39.61 ± 0.17 | 84.98 ± 0.17 | nd |
| IT 85F 867-5 | 5.19 ± 0.04 | 23.12 ± 0.04 | 0.059 ± 0.006 | 60.02 ± 0.14 | 122.76 ± 0.1 | nd |
| IT90K 284-2 | 5.52 ± 0.08A | 27.49 ± 0.11 | nd | 66.58 ± 0.08 | 122.18 ± 0.04 | nd |
| 01 CC-26 | 6.11 ± 0.06C | 31.67 ± 0.28B’ | nd | 77.57 ± 0.03 | 128.47 ± 0.13 | nd |
| Gaoua Local (GR) | 9.48 ± 0.08 | 28.99 ± 0.15 | 0.284 ± 0.024 | 75.40 ± 0.06 | 146.10 ± 0.1 | nd |
| IT 97K 556-4 | 5.92 ± 0.06 | 31.51 ± 0.07B’ | nd | 77.01 ± 0.04 | 197.87 ± 0.14 | nd |
| 01 FCV 59 | 7.56 ± 0.04B | 30.85 ± 0.23 | nd | 58.01 ± 0.08 | 140.14 ± 0.1 | nd |
| 01 CC 26-34 | 6.12 ± 0.11C | 29.83 ± 0.04C’ | nd | 74.28 ± 0.07 | 113.58 ± 0.04 | nd |
| IT 98 K-128-4 | 8.53 ± 0.11 | 28.59 ± 0.06A’ | nd | 54.46 ± 0.04 | 138.84 ± 0.1 | nd |
| l.s.d | 0.2168 | 0.3173 | 0.01464 | 0.2940 | 0.2275 | nd |
Results are expressed as means ± SD. Multiple comparisons between extracts are made by the Student’s t test. Values with the same letter are not significantly different (P>0.05)
a-L: Total Antioxidant Capacity of leaves expressed in μmoles of Quercetin Equivalents per gram of fresh material;
b-L: Total polyphenol of leaves expressed in μg of Gallic Acid Equivalents per gram of dried material;
c-L: Total Anthocyanin of leaves expressed in μg of cyanidin-3-glucoside per gram of dried material;
a-G: Total Antioxidant Capacity of Grains expressed in μmoles of Quercetin Equivalents per gram of dried material;
b-G: Total polyphenol of Grains expressed in μg of Gallic Acid Equivalents per gram of dried material;
c-G: Total Anthocyanin of grains expressed in μg of cyanidin-3-glucoside per gram of dried material.
nd: not detected
l.s.d: least significative difference
Table 1: Values of TAC, TPP and TAT of leaves and Grains of the different varieties of dry beans.
Varietal factor explains the differences between the values of TAC more than 95%. Least significative difference of averages (0.2168) allows to determine the statistical significance of the results. Then, for couples (01 CC 26-34/01 CC-26); (IT X/IT 90 K 284-2); (IT 85F-3139/IT 97 K 556-4) and (01 FCV 59/IT 97 K-1069-2), TAC values were not significantly different (P>0.05). Indeed, from the analysis of lsd value (0,3173), couples (Unknown/IT 98 K - 128-4); (93 K - 93-10 IT/IT 97 K 556-4); (IT 97 K 556 - 4/01 CC-26) and (01 CC 26-34/IT X) have statistically equivalent values of TPP (P>0.05). But, IT 93K-93-10 (Table 1 and b-L) which has the lowest TAC value has the third highest total polyphenol content from the following decreasing order concerning TPP of leaves extracts (b-L) : 01 CC-26>IT 97K-556-4 ~ IT93K-93-10>01 FCV 59>01 CC 26-34 ~ IT X ~IT 97K-556-6>Gaoua Local (GR)>Unknown ~IT 98K-128-4>IT 90K 284-2>IT 97K-1069-2>IT 85F-3139>IT 85F-867-5. Noruma et al. [25] have found that this complication in the interpretation was due to the overlapped DPPH spectra (at 517 nm) of the tested compounds; particularly carotenoids interfere more. Steric accessibility is a major determinant of the reaction between the radical of DPPH and the test compounds. Thus, small molecules (in an extract) that have better access to the radical site have higher TAC using this method than big ones that have not a good access (showing low apparent TAC). This can explain the lowest TAC value of IT 93K-93-10 (2.84 ± 0.13 μmoles of Quercetin Equivalents per gram of fresh material). Besides, the majority of leaves does not contain anthocyanin since the assay using the pH-differential method reveals that only Unknown>Gaoua Local (GR)>IT93K-93-10>IT 85F-867-5 contained a small amount. These small amounts of anthocyanins have a positive incidence on the TPP values of leaves. Without IT85F867-5 (which has a very low TAT value), varieties cited above have the highest TPP values. In revenge, TAC values are not necessarily the highest; in this case, it’s rather the variety IT93K-93-10 having one of the highest values of TPP (31.24 ± 0.08 μg GAE) which has the lowest TAC value. This attests that polyphenols in general and particularly anthocyanins detected in this variety are not enough active or not detected by the DPPH method (probably due to the big molecules). These results reveal a good correlation (R=0.947) between TAC and TPP contents of leaves of the different varieties (Table 2). The FCR-based assay is becoming more and more popular and is commonly known as the total phenols assay. As many publications, the good linear correlation found between the “total phenols profiles” (TPP) and “the antioxidant activity” (TAC) is not surprising since the FCR actually measures a sample’s reducing capacity [26].
| TPP | TAC | ||
|---|---|---|---|
| Leaves | TAC | 0.947 | - |
| Grains | TPP | - | 0.582 |
Table 2: Correlation (R) between the quality parameters in leaves and graines.
The analysis of the results of the TAC of extracts of grains, is that, as previously, the varietal factor explains the differences between the levels of antioxidants (Table 1 and Figure 1, a-G). The least significative difference about 0,2940 allowed to make the following comparison according to the TAC : 01 CC-26>IT 97K-556-4>Unknown>Gaoua Local (GR)>IT X>01 CC 26-34>IT93K-93-10>IT 90K 284-2>IT 85F-867-5>01 FCV 5 >IT 97K-556-6>IT 97K-1069-2>IT 85F-3139. It is well known that anthocyanins have a good incidence on the TAC of foods [12].

Figure 1: Histograms classifying Leaves (a-L; b-L) and Grains (a-G; b-G) varieties of dry beans about their TAC and TPP values.
From ANOVA means Square Table 3, TAC, TPP values of grains extracts are higher than those of leaves; that’s to say that grains contain more total antioxidant substances than leaves for these local varieties grown in Burkina. We can notice that even if polyphenols or anthocyanins contribute to the TAC value, they cannot exclusively explain the antioxidant power of the extracts. IT93K-93-10 which has the lowest TAC value has however one of the highest value of TPP (Table 1 a-L and b- L). In addition, TPP values of IT 85F-867-5 and IT 90K 284-2 are respectively 122.76 and 122.18 μmoles of GAE/g of dried material (Table 1; b-G). We can notice that IT 90K 284-2 having the lowest TPP value is more antioxidant. There are certainly other substances that influence positively the antioxidant power [24].
| TAC | TPP | TAT | |
|---|---|---|---|
| Leaves | 5.733*** | 12.778*** | 0.155** |
| Grains | 281.681*** | 1463*** | - |
| ** for P=0.008, *** for P<0.001 | |||
Table 3: ANOVA of Means Square for phytochemical compound in leaves and grains of dry beans.
The correlation established between TAC and TPP contents for grains, smaller (R=0.5823; Table 2) than that of leaves (R=0.947 Table 2), reveals that total antioxidant capacity of grains (as for leaves) extracts depends on the amount of total polyphenol. But, grains extracts contained active substances that are not necessarily of polyphenols and influencing positively radical scavenging activities on DPPH radical; this may explain the low correlation between the TPP and the TAC observed for grains extracts.
In fact, the classification of the grains about TPP (see Table 1 and Figure 1, b-G) content is: IT 97K-556-4> IT X>Gaoua Local (GR)> IT93K-93-10>IT 97K-556-6>01 FCV 59> IT 98K-128-4>unknown> 01 CC-26> IT 85F-867-5>IT 90K 284-2>01 CC 26-34>IT 97K-1069-2 >IT 85F-3139. In addition, Table 1 reveals that even if they don’t contain anthocyanins, grains have a TAC values that increase from six time (for IT98K-128-4) to 23 times (for IT93K-93-10) when going from leaves to grains; while TPP values are multiplied by four or five time. Then, it’s more profitable to use grains in alimentation due to their highest TPP and TAC values. Future work on these local varieties will enable us to identify the polyphenols (flavonoids, tannins, phenolic acids,) responsible for TAC of leaves and grains.
Conclusion
Fourteen varieties of dry bean (leaves and grains) were analysed for their total antioxidant capacity (TAC), total polyphenol content (TPP) and total anthocyanin content (TAT). Grains of these fourteen varieties had the highest as well as TAC and TPP content. However, the correlation between TAC and TPP values (R=0.947) of leaves (extracts) is higher, showing that there is less substances interfering in leaves extracts than the grains ones. However, this study reveals that polyphenols and anthocyanins are not the only responsible (since they are absent in the grains) of the TAC; there are other compounds such as other polyphenols which can explain the highest values observed in the grains.
The results of this study will be used to estimate the antioxidant intake of the population in Burkina. Furthermore, these data are a basis to expand this study to more several local varieties of bean and to several local fruits and vegetables grown in Burkina.
References
- Faudale M, Viladomat F, Bastida J, et al. Antioxidant activity and phenolic composition of wild, edible, and medicinal fennel from different Mediterranean countries. J Agric Food Chem. 2008;56(6): 1912-20.
- Johnsen SP, Overvad K, Stripp C, et al. Intake of fruit and vegetables and the risk of ischemic stroke in a cohort of Danish men and women. Am J ClinNutr. 2003;78(1): 57-64.
- Seeram NP. Berry fruits for cancer prevention: current status and future prospects. J Agric Food Chem. 2008; 56(3): 630-35.
- Smith-Warner SA, Spiegelman D, Yaun SS, et al. Fruits, vegetables and lung cancer: a pooled analysis of cohort studies. Int J Cancer. 2003;107(6): 1001-11.
- Zhang Y, Seeram NP, Lee R, et al. Isolation and identification of strawberry phenolics with antioxidant and human cancer cell antiproliferativeproperties. J Agric Food Chem. 2008;56(3): 670-75.
- Chu YF, Sun J, Wu X, Liu RH. Antioxidant and antiproliferative activities of common vegetables. J Agric Food Chem. 2002;50(23): 6910-16.
- Navindra PS. Berry Fruits: Compositional Elements, Biochemical Activities, and the Impact of Their Intake on Human Health, Performance, and Disease. J. Agric. Food Chem. 2008;56(3): 627-29.
- Pezzuto JM. Grapes and human health: a perspective. J Agric Food Chem. 2008;56(16): 6777-84.
- Hamutal B, Sylvie J, Amnon G, et al. Phenolic Antioxidants and Antiatherogenic Effects of Marula (Sclerocarryabirrea Subsp. caffra) Fruit Juice in Healthy Humans. J. Agric. Food Chem. 2008;56(21): 9884-91.
- Sara T, Bruno M, Franco C, et al. Antioxidants, phenolics compounds, and nutritional quality of different strawberry genotypes. J. Agric. Food Chem. 2008;56(3): 696-704.
- Fukumoto LR, Mazza G. Assessing antioxidant and prooxidant activities of phenolic compounds. J Agric Food Chem. 2000;48(8): 3597-604.
- Rene DC, Elhadi MY, Armando C. Correlation between Some Nutritional Components and the Total Antioxidant Capacity Measured with Six Different Assays in Eight Horticultural Crops. J. Agric. Food Chem. 2008;56(22): 10498-504.
- Jimaima L Craige T, Mark W, Naiyama W. Phytochemical flavonols, carotenoids and the antioxidant properties of a wide selections of Fijian fruits, vegetables and other readly available foods. Food Chemistry. 2007;101(4): 1319-26.
- Jing P, Bomser JA, Schwartz SJ, et al. Structure-function relationships of anthocyanins from various anthocyanin-rich extracts on the inhibition of colon cancer cell growth. J Agric Food Chem. 2008;56(20): 9391-98.
- Guzman-Maldonado SH, Paredes-Lopez O. Biotechnology for the improvement of nutritional quality of food crop plants. In Molecular Biotechnology for Plant Food Production; Paredes-Lopez, O., Ed.; Technomic Publishing Company, Inc.: Lancaster, PA. 1999; 590-591.
- Romani A, Vignolini P, Galardi C, et al. Germplasm characterization of Zolfino landraces (Phaseolus vulgaris L.) by flavonoid content. J Agric Food Chem. 2004;52(12): 3838-42.
- Islam FM, Rengifo J, Redden RJ. Association between seed coat polyphenolics (tannins) and disease resistance in common bean. Plant Foods Hum Nutr. 2003;58(4): 285-97.
- Beninger CW, Hosfield GL. Antioxidant activity of extracts, condensed tannin fractions, and pure flavonoids from Phaseolus vulgaris L. seed coat color genotypes. J Agric Food Chem. 2003;51(27): 7879-83.
- Asami KD, Yun-Jeong H, Diane MB, et al. Comparison of the total phenolic and ascorbic acid content of freeze-dried marionberry, strawberry, and corn grown using conventional, organic, and sustainable agricultural practices. J. Agric. Food Chem. 2003;51(27): 1237-41.
- Frankel EN, Waterhouse A, Teissedre PL. Principal phenolic phytochemicals in selected California wines and their antioxidant activity in inhibiting oxidation of human Low-density Lipoproteins. J. Agric. Food Chem. 1995;43(4): 890-94.
- Brand-Williams W, Cuvelier ME, Berset C. Use of a free radical method to evaluate antioxidant activity. Lebensm.-Wiss-Technol. 1995;28: 25-30.
- Sellappan S, Akoh CC, Krewer G. Phenolic compounds and antioxidant capacity of Georgia-grown blueberries and blackberries. J Agric Food Chem. 2002;50(8): 2432-38.
- Sellappan S, Akoh CC. Flavonoids and antioxidant capacity of Georgia-grown Vidalia onions. J Agric Food Chem. 2002;50(19): 5338-42.
- Llorach R, Juan C.E, FAT, et al. Valorization of Cauliflower (Brassica oleracea L. var. botrytis) By-Products as a Source of Antioxidant Phenolics. J. Agric. Food Chem. 2003;51(19): 2181-87.
- Noruma T, Kikuchi M, Kawakami Y. Proton-donative antioxidant activity of fucoxanthin with, 1-diphenyl-2-picrylhydrazyl (DPPH). Biochem. Mol. Biol. Int. 1997;42(2): 361-70.
- Huang D, Ou B, Prior RL. The chemistry behind antioxidant capacity assays. J Agric Food Chem. 2005;53(6): 1841-56.