Original Article
, Volume: 12( 1)Reaction Calorimetry as a Tool for Thermal Risk Assessment and Improvement of Safe Scalable Chemical Processes
- *Correspondence:
- Rakeshwar B , Research and Development, Integrated Product Development, Innovative Plaza, Dr Reddy?s Laboratories Ltd, Bachupally, Qutubullapur, R, R. District, 500072, India, Tel: +919963029531; Fax: 04044346285; E-mail: rakeshwarb@drreddys.com
Received: April 07, 2017; Accepted: May 22, 2017; Published: May 29, 2017
Citation: Kamala Jyotsna G, Srikanth S, Ratnaparkhi V, et al. Reaction calorimetry as a tool for thermal risk assessment and improvement of safe scalable chemical processes. Inorg Chem Ind J. 2017;12(1):110.
Abstract
The reaction calorimeter is commonly employed to study several aspects of a desired chemical reaction like heat of reaction, heat release rate, accumulation, maximum temperture of synthesis reaction (MTSR) etc. In order to assess the thermal risks associated with a chemical reaction, both the desired and undesired (i.e., decomposition) reactions must be studied. In this paper we report in detail the practical procedure followed for the assessment of thermal risk of a chemical reaction and thereby identification of Stoessel’s criticality class. The kinetics and energy potential of the undesired decomposition reaction are studied using differential scanning calorimeter (DSC). The decomposition onset (Tonset) obtained from DSC was used in Arrhenius kinetic model (zero order assumption) to estimate TD24. Thus obtained TD24 value is on the conservative side and can be used for safety purposes. We also discussed how this thermal assessment further led to the chemical process improvisation in terms of thermal safety for a safe and efficient scale up. We have discussed an example of bromination reaction where azobisisobutyronitrile (AIBN) decomposes to form a free radical and initiates the chain reaction. The reaction is found to be associated with high thermal risks corresponding to a Stoessel’s criticality class 5. Process was optimized by varying the feed profile of the AIBN in solvent solution to reduce the Stoessel’s criticality from class 5 to class 2. We have also discussed the synthesis of tetra phosphate ester where the chemical process was improvised in terms of safety by classifying the reagent isopropyl addition into two zones; one critical zone of addition (control measures are required) and the other non critical zone.
Keywords
Differential scanning caloirmeter; Heat release rate; Bromination reaction; Azobisisobutyronitrile
Symbols and Abbreviations:
A: Heat flow area (m2); α (t): Fraction of dosed reagent up to the stochiometric point at time t; AIBN: Azobis Isobutylonitrile; Cp: Specific heat capacity of the reaction (kJ kg-1 K-1); DSC: Differential Scanning Calorimeter; Ea: Activation energy (J.mol-1); ΔHr: Heat of reaction (KJ.mol-1); IPA: Isopropyl Alcohol; MTSR: Maximum Temperature of a Synthesis Reaction in case of cooling failure (°C); MTT: Maximum Technical Temperature (°C); Mr: Mass of the reaction (kg); NBS: n-Bromo Succinamide; PPE: Tetra Phosphate Ester; Qhr: Heat of reaction (kJ); qRTCal: Heat flow through the part of the reaction vessel that is wetted by its contents (W); qS0 is the specific heat flow through the horizontal sensor band (W/m2); qr_rtc: Heat release obtained from RTCal (W); R: Universal Gas Constant (J.mol-1K-1); RTCal: Real Time Calorimetry; Td: Onset of decomposition temperature (°C); TD24: Temperature at which time to maximum rate is 24 hrs (°C); TMRad: Time to Maximum Rate under adiabatic conditions (h); ΔTad: Temperature rise under adiabatic conditions (°C); Tcf: Temperature reached in case of cooling failure (°C); Tp: Process Temperature (°C); Tr: Reaction mass Temperature (°C); Xth: Thermal conversion at any instant of time t.
Introduction
At laboratory scale, the exothermic heat of a chemical reaction could be removed without any detectable temperature rise due to the availability of high heat transfer area i.e. larger about two orders of magnitude compared to plant scale [1]. Mastering the same exotherm at plant scale could be difficult unless the heat release pattern during a chemical reaction is known [1,2]. Therefore, for safe and successful scale-up of a chemical reaction, understanding the thermal behaviour of the reacting system and defining proper control strategies is very important. Thermal risk assessment of a chemical process requires the knowledge of the desired as well as undesired reaction (decomposition). Reaction calorimeters are extensively used in the chemical and pharmaceutical industries to determine the thermal hazard potential of a chemical reaction. Stoessel’s criticality index serves as a useful tool for the risk assessment of a chemical reaction. It classifies a chemical reaction into 5 criticality classes ranging from 1-5 [1,3]. The higher the criticality class, higher is the risk of thermal runaway. Identifying the Stoessel’s criticality class for a chemical reaction requires the Maximum temperature of synthesis reaction (MTSR), Maximum technical temperature (MTT) and Time to maximum rate under adiabatic condition (TMRad) values. The MTSR of a chemical reaction depends on the thermal accumulation due to the unconverted reagents, the heat of the reaction and the specific heat of the reaction mass [4]. The TMRad is calculated from the heat release rate, heat capacity and activation energy of the reaction mass [1,4].
This paper focuses on assessing the thermal safety of a chemical process using tools like reaction calorimeter and differential scanning calorimeter. We first review the theory and formulas pertaining to the calculation of the MTSR and TMRad values. In our work, we focused on reducing the thermal risk for runaway (reducing Stoessel’s criticality index) by varying the feed profile of the reagent. The accumulated reaction heat is converted into a dosing controlled heat by varying the feed profile. We present our experimental work with the help of two case studies. We discussed on how the chemical process is improved in terms of safety by bringing down the thermal accumulation, thereby MTSR value and the Stoessel’s criticality index (Figure. 1).

Figure 1: Stoessel's criticality index.
Basic concepts for the assessment of the criticality of chemical processes
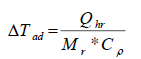
The Stoessel’s criticality class uses the temperature scale for the assessment of severity and the time-scale (TMRad) for the assessment probability of a thermal runaway [1,3]. The temperature rises under adiabatic conditions (ΔTad) which serves as criteria for assessing the severity of a runaway reaction is calculated by using equation (1).
 (1)
(1)
where, Qhr, Heat of reaction (kJ), Mr, Mass of the reaction (kg) and Cp, Specific heat capacity of the reaction (kJ kg-1 K-1). The calculation of MTSR and TMRad values are discussed below.
Calculation of MTSR
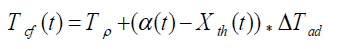
The concept of Maximum temperature of synthesis reaction, MTSR was first proposed by Gygax [5] and later extended by Stoessel in 1993.
 (2)
(2)
where, Tcf, Temperature reached in case of cooling failure (°C), Tp, Process Temperature (°C). The term  refers to thermal accumulation due to the fraction of unreacted reagent that has been charged to the reactor [4,6]. Thermal Conversion at time t, (Xth) is given by equation 3.
 (3)
(3)
The time at which the maximum thermal accumulation occurs is the most unfavourable time for a cooling breakdown to occur. At this point of time, even if the feed is interrupted, the reaction conversion progress due to the accumulated reagent [7], Therefore,
 (5)
(5)
Therefore, in order to determine MTSR, the time of maximum reagent accumulation and the maximum amount of thermal accumulation needs to be determined. For a batch reaction, MTSR is calculated by considering zero thermal conversion and 100 % thermal accumulation which is the worst case that can happen. According to equation 4, for a semi batch operation, the MTSR depends on the degree of accumulation of the reagents. Therefore, by changing the feed profile in a semi batch reaction MTSR could be controlled [8-11].
Estimation of TMRad
An ideal way to determine TMRad is by conducting an adiabatic experiment.[10] But performing an adiabatic experiment in an industry has its own limitations of experimental time and sample quantity. A conservative approach for determining the TMRad could be is to set up an Arrhenius model by assuming zero order kinetics for the decomposition reaction.[11-13] The expression for TMRad is given in equation 5.
 (5)
(5)
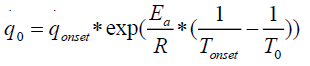
Here  corresponds to the heat release rate at temperature T0, R, Universal Gas Constant (Jmol-1K-1). A single dynamic differential scanning caloirmeter (DSC) run (at a ramp of 4°C/min) helps in calculating the heat release rate at TD24. A TMRad in between 10-24 hrs is considered to be an industrially acceptable value as sufficient time is provided to take appropriate measures to prevent a thermal runaway.[3] Heat release rate
  at the decomposition onset temperature (Tonset) is determined from a single dynamic DSC experiment. Tonset is the temperature at which heat signal can first be differentiated from the baseline temperature reading [12]. Using these values, the heat release rate qo at any temperature T0 can be estimated by using equation (6) and corresponding TMRad can be calculated using equation (5).
 (6)
(6)
Low activation energy Ea of 50000 J/mol was considered for the calculations, which gives a high heat release rate which in turn results in a shorter TMRad value than the real adiabatic value [12]. The above approach can be used only for safety purposes.
General Description of RC1e
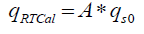
The experimental work is carried out in RC1e (a model reaction calorimeter) supplied by Mettler Toledo. RC1e works on the real-time calorimetry (RTCal) technique which measures heat flow in real time. In RTCal technique, heat flux sensors located on to the outer wall of the reactor vessel measures the heat flow directly. The measurement is independent of temperature and properties of the reaction mass; thereby eliminating the problems of calibration during the experiment. The horizontal ring of heat flow sensors measures the heat flow through the reactor wall over a specified heat exchange area. The vertical band of heat flow sensors attached to the reactor wall measure the complete heat transfer area [6].
 (7)
(7)
Where q RTCal is the heat flow through the part of the reaction vessel that is wetted by its contents (W), A is the heat flow area (m2) and qS0 is the specific heat flow through the horizontal sensor band (W/m2).
For our experiments, we have used a 500 ml RTCal reactor, with a working volume of 80 ml to 400 ml. A four-blade glass pitched blade turbine (PBT) stirrer of 38 mm diameter is used. A 3-element glass baffle with 10 mm diameter is used for reducing the vortex formation and for achieving better mixing profile. A temperature (Tr) sensor of 6 mm diameter is inserted into the reactor for online temperature measurement (Figure. 2).

Figure 2: RC1e-RTCal reactor with horizontal and vertical band of sensors.
Determination of Cp using RTCal method
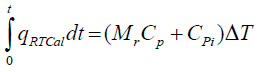
The reactor contents are heated at a rate of 0.3 K/min for 10 min through jacket. The heat flow between the reactor and jacket (qRTCal) is measured by means of the heat flow sensors attached to the reactor wall. The Cp of the reaction mass is determined by the following equation.
 (8)
(8)
Here, Mr is reaction mass (kg), Cpi is specific heat capacity of the inserts (kJ/K) which is a known value. ΔT corresponds to the initial and final temperature difference between the reactor contents.
Case Study 1: Conversion of 100% Thermally Accumulated Process into Dose Controlled Process
Reaction
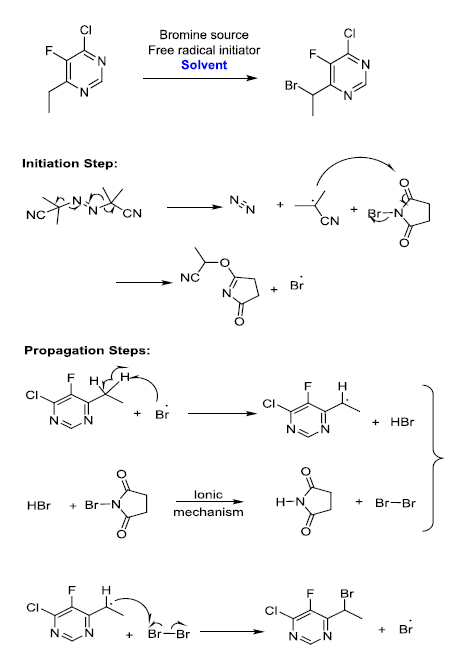
The synthetic reaction involves brominating of active methylene group (VOR5) with N-bromo succinamide (NBS) in presence of azobisisobutyronitrile (AIBN) and Chlorobenzene. The underlying mechanism of AIBN catalyzed reaction is chain initiation with AIBN decomposition to form free radical, which propagates the chain reaction till the completion.
Experimental Procedure
The experimental procedure is to charge the reagents NBS and AIBN in sequential order to the initial mixture of VOR5 and chlorobenzene solvent at room temperature. Reaction is initiated by heating the reaction mass to 65°C to 70°C and maintained till completion. The reaction was performed in reaction calorimeter RC1e to determine the heat of reaction, adiabatic temperature rise, and Stoessel’s criticality class. The results obtained from the experiment are tabulated in Table 1.
| Heat of Reaction (ΔHr) | 110. 8 KJ/mole of VOR5 |
| Process Temperature (Tp) | 70°C |
| Adiabatic Temperature Rise (ΔTad) | 50°C |
| MTSR (100% thermal accumulation) | 120°C |
| MTT (boiling point of chlorobenzene) | 132°C |
| TD24 | 112.1°C |
| Stoessel’s criticality class | 5 |
Table 1: Results obtained from RC1e for the initial process of bromination reaction.
TD24 is calculated using a single dynamic DSC experiment of the reaction mass with the calculations as explained in section 2.2. The first exotherm corresponds to the desired reaction and the second exotherm corresponds to the decomposition reaction. Using Tonset of 227°C, Ea of 50 KJ/mol, specific heat capacity (Cp) of 1.8 J/g K (determine by RC1e experiment) and heat release rate (q_onset) of 20 W/Kg (this is a conservative assumption of the detection limit of the measurement system DSC),12TD24 is estimated as 112.1°C. The above experimental results and observations helped in detailed analysis of thermal risks associated with the current synthetic process.
The reaction was found to be initiating when reaction mass temperature Tr reaches 70°C. The heat release was sudden and sharp as evident from the RC1e data (Figure. 3). This is a batch reaction with unfavorable kinetics. As the reaction initiates at 70°C, if a cooling failure occurs at this point, an adiabatic runaway of the reaction would happen because of 100 percent thermal accumulation. The Stoessel’s criticality class is 5 for the reaction (Figure. 4-6) which indicates that the maximum temperature of synthetic reaction (MTSR) and maximum technical temperature (MTT) are far above the TD24. Since MTSR is less than TD24, decomposition reaction would be triggered before completion of the synthesis reaction, which would further lead to very severe consequences. Hence, the synthetic process is prone to risk of triggering a runaway reaction in case of cooling failure.

Figure 3: Heat Profile obtained from RC1e for initial process of bromination reaction (-- Tr Curve; -- qr_rtc Curve; -- Thermal Conversion Curve; -- Mr Curve).

Figure 4: DSC thermogram of the reaction mass of bromination reaction.

Figure 5: Stoessel?s criticality class for the initial process of bromination reaction (generated by iControl software).

Figure 6:DSC thermogram of the AIBN and chlorobenzene solution.
Stoessel’s criticality class 5 demands process modification before going for plant scale batches. Redesigning a batch process has limited available choices. MTSR can be reduced by reducing the process temperature Tp but this might lead to long reaction times. Other way is to reduce the ΔTad by high dilution of the reaction mass which might result in low throughput [7]. So, the other option is to convert 100% thermal accumulated heat to a dosing controlled heat (i.e. batch reaction to semi batch reaction). A semi batch reaction has clear cut advantages when compared to a batch reaction. In the case of semi-batch reaction, the rate of reaction and thereby heat production rate can be influenced externally [7]. Safe design of a feed controlled reaction requires the understanding of the degree of accumulation of reactants at any point of time and limiting the accumulation.
In order make the 100% thermal accumulated process in to dosing controlled process following options were considered.
• Controlled addition of NBS at 65°C to 70°
• Controlled addition of active methylene group compound at 65°C to 70°
• Controlled addition of AIBN at 65°C to 70°.
Based on the reaction mechanism proposed, AIBN is serving as a radical generator. Once AIBN is added, the reaction begins (probably at a smaller rate) and adding more AIBN should serve to accelerate the rate of reaction. However, if the charge is stopped, the reaction will continue to run to completion. If only a portion of the NBS or activated methylene is available for reaction, the severity of any runaway would be limited, since the amount of material available to react is limited. But based on the literature available and observations from DSC studies, it is evident that AIBN will decompose around 70°C irrespective of presence of any other reaction components. The energy of decomposition of AIBN as measured by DSC is 1.3 KJ/g and is associated with a high rate pressure rise [13-15]. The energy of decomposition for AIBN and chlorobenzene mixture as measured by DSC is -84 J/g and has initiated at 87°C (Figure.6). The thermal effects of decomposition of AIBN are of great concern. Therefore, considering the safety issues associated with heating AIBN in solution with one of the starting materials, the first two options (controlled addition of NBS and active methylene group compound) were ruled out. The slow addition of AIBN is considered to be the best way to control the heat generation rate.
Optimization experiment
In this experiment, the active methylene group compound VOR5, NBS and chlorobenzene were taken as first fill into the RC1e reactor vessel and heated to 67.5°C. At this temperature AIBN in chlorobenzene solution was added over a period of 30 minutes. The reaction is found to be initiating after 70% addition of AIBN solution which can be seen in heat profile obtained from RC1e (Figure. 7). The reaction is not an ideal dosing controlled reaction. For an ideal dosing controlled reaction, thermal accumulation is zero at any point of time during dosing. Here the dosing and consuming reaction occur at different rates. So, the thermal accumulation lies in between 0 and 1. Therefore the time of maximum accumulation and the maximum accumulation are important parameters to be determined and limited. By the end of dosing, thermal accumulation was 94%, which corresponds to an adiabatic temperature rise of 47 K. Therefore, MTSR is 114.5°C corresponding to a Stoessel’s criticality class of 5. Thermal accumulation can be reduced by increasing the process temperature. But the reaction kinetics is found to be strongly dependent on the temperature. So, an increase in process temperature increases the reaction rate, thereby increasing the maximum heat release rate which should be avoided. A high heat release rate of the reaction demands a high cooling power which might not be economically feasible in larger scales (Figure. 7 and 8).

Figure 7: Heat Profile obtained from RC1e for the bromination reaction; continuous addition of AIBN for 30 minutes (-- Tr Curve; -- qr_rtc Curve; -- Thermal Conversion Curve; -- Mr Curve).

Figure 8: Heat Profile obtained from RC1e for bromination reaction: Continuous addition of AIBN for six hours (-- Tr Curve; -- qr_rtc Curve; -- Thermal Conversion Curve; -- Mr Curve).
The optimal way of reducing the accumulation is to vary the feed profile of the reagent. The ideal case is the one in which the heat produced by the reaction is equal to the heat dissipated through the jacket without any accumulation in the reactor. The cooling capacity of the jacket is given by equation 9. If Q is the total heat released for a known batch size, the heat release rate during a chemical reaction is given by equation 10.
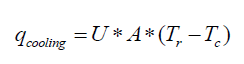 (9)
(9)
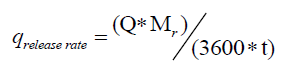 (10)
(10)
Here, Tr is the reaction mass temperature and Tc is the coolant temperature. Equating 9 to 10 gives the maximum allowable addition time for the reagent.
Validation experiment in RC1e
Validation experiment was conducted in RC1e; continuous addition of AIBN solution for six hours. The experimental results are tabulated in Table 2. The thermal accumulation at the end of dosing has reduced, thereby reducing the MTSR. After optimization, the Stoessel’s criticality of the reaction reduced from 5 to 2 thereby making it a safer process to operate in the plant.
| Expt | Continuous addition of AIBN solution for 6 hours |
|---|---|
| Parameter | |
| Max. heat release rate | 8.43 W/Kg |
| Thermal accumulation at the end of dosing | 5 % |
| MTSR | 70°C |
| MTT | 132°C |
| TD24 | 112.1°C |
| Criticality class | 2 |
Table 2: . Results obtained from RC1e for bromination reaction: (a) Lot wise addition of AIBN (b) continuous addition of AIBN for 6 hours.
Case Study 2: Classification of Reagent Addition into Zones Based on Thermal Conversion and Heat Release Profile
Chemical reaction
As per the lab process, the synthesis of Tetra Phosphate Ester (PPE) involves addition of isopropyl alcohol (IPA) to the solution of phosphorus pentoxide (P2O5) in chloroform at room temperature.
Experimental procedure
The experiment was performed in an isothermal calorimetry mode in RC1e reactor. Initially 100 grams of chloroform and 50 grams of phosphorous pentoxide are taken into the reactor. This heterogeneous solution was cooled to 30°C. To this solution at 30°C, 254 grams isopropyl alcohol was added over a period of 60 minutes through peristaltic dosing equipment and maintained for 30 minutes. Cp of the reaction mass was determined before and after the addition of isopropyl alcohol and maintenance period.
Results and discussion
The analysis was done for the reaction and results are tabulated in Table 3.
| Heat of the reaction (ΔHr) | 286.84 kJmole-1 of P2O5 |
| ΔTad | 52.34°C |
| Thermal Accumulation at the end of dosing | < 5% |
| MTSR | 82.34°C |
| MTT | 61.2°C |
| Td24 | 140°C |
| Criticality Class | 3 |
| Max. Heat release rate | 372 W kg-1 |
Table 3: Results obtained from RC1e for PPE synthesis.
From the analysis of the experimental results, few interesting observations were made;
• The 75% of the total heat was released during the addition of 47 grams i.e, 18.5% of the total amount of isopropyl alcohol
• Only 25% of the total heat was evolved during addition of the remaining 207 grams i.e., 81.5% of the total amount of isopropyl alcohol
• During addition of IPA, the process temperature raised to 61°C (in RC1e with cooling circulation) which is almost near to the boiling point of chloroform (Figure. 9).

Figure 9: Heat profile obtained from RC1e for initial process of PPE synthesis.
If the reaction mass temperature reaches the boiling point of the solvent during dosing of the reagent, it results in boiling of the solvent. Since MTSR is higher than MTT, if a cooling failure occurs, the boiling of the solvent would result in eventual pressure buildup in the reactor. The safety of a criticality class 3 chemical reaction depends on the heat release rate. The high heat release in this reaction can be avoided by varying the feed profile of the reagent. We have tabulated the amount of IPA consumed and the quantity of heat released for every 5 percent thermal conversions (Table 4).
| IPA quantity added | Heat liberated | Zone |
|---|---|---|
| 47 g | 38 KJ | Critical zone |
| 207 g | 12.52 KJ | Non-critical zone |
Table 4: Critical and noncritical zones during IPA addition.
From Table 4 it was evident that 47 g i.e. one fifth of the total quantity of isopropyl alcohol contributes towards 75% of total heat release. This 47 g is equal to one equivalent of IPA (w.r.t P2O5 ~ 50 grams for 50 grams batch size). So, the addition of one equivalent of IPA is considered to be critical and the feed rate needs to be controlled to have better heat dissipation. The remaining amount i.e. four fifth of the total quantity of isopropyl alcohol can be added at a faster rate.
Based on this analysis and inferences drawn, we have conducted one validation experiment to validate our inferences (Figure. 10).

Figure 10: IPA consumed for every 5 % thermal conversion (PPE synthesis initial process).
Optimization experiment
The critical zone of dosing i.e. addition of the first 50 g (1 mole equivalent) of isopropyl alcohol was done in 60-90 minutes and the remaining 204 g (non-critical zone) was added in another 60 minutes. The graph and the evaluation results obtained from this experiment are shown in Figure. 11. The maximum temperature observed in RC1e (with cooling circulation) during addition of IPA was only 33°C. The maximum heat release rate observed was 25 Wkg-1, reduced by an order of 10 when compared to that of the initial process. The Stoessel’s criticality class for the reaction remains same (i.e. 3) corresponding to an MTSR of 82.4°C, but zone wise addition resulted in less heat release rate thereby achieving a better control on the reaction. These results are acceptable for better scale-up.

Figure 11: Heat profile obtained from RC1e for optimized experiment of PPE synthesis.
Conclusion
In summary, we have used reaction calorimetry data for the risk assessment of a chemical reaction. Risk assessment of a chemical reaction helps in defining the adequate risk reducing measures like evaporative cooling, emergency pressure relief system etc. But a slight modification in the chemical process, here, varying the feed profile of the reagent helped in reducing the level of thermal risk associated. For the bromination reaction, controlled addition of the reagent resulted in reducing the thermal accumulation thereby reducing the Stoessel’s criticality class from 5 to 2, making it a process with low thermal risk. For the PPE synthesis reaction, RC1e study helped in identifying the Stoessel’s criticality class as 3 and the high heat release associated with the reaction. Varying the feed profile of the reagent for this reaction helped in reducing the maximum heat release rate during the course of reaction. In the event on an upset scenario where a reactant is charged too quickly, the risks that were identified can still be present. Addition rate is one means of managing the risk, but it makes the control of addition rate a critical factor in the process. The cost investment on the design of technical safety measures for a reactor can be brought down by optimization of the existing chemical processes.
References
- Stoessel F. Thermal safety of chemical processes: Risk assessment and process design. John Wiley & Sons; 2008 Jun 25.
- HarsNet Working Group, HarsBook: A technical guide for the assessment of thermal hazards in highly reactive chemical systems, DECHEMA e. V, 2002.
- Stoessel F, What is your thermal risk? ChemEng Prog. 1993;89(10):68-75.
- Andre R, Diab LB, Lerena P, et al.A new reaction calorimeter for screening purposes during process development. OrgProcess Res Dev. 2002;6:915-21.
- Gygax R. Chemical reaction engineering for safety. Chem Eng Sci. 1988;43(8):1759-71.
- iC safety software version 5.0.21.0. Help file. Mettler Toledo, Switzerland, 2011.
- Gygax R. Thermal process safety-Data assessment criteria measures. ESCIS. 1993.
- Lerena P, Wehner W, Weber H, et al. Assessment of hazards linked to accumulation in semi-batch reactors. Thermochim. Acta. 1996;289(2):127-42.
- Ubrich O, Srinivasan B, Lerena P, et al. Optimal feed profile for a second order reaction in a semi-batch reactor under safety constraints: Experimental study. J Loss Prev Process Ind. 1999;12(6):485-93.
- Barton J, Rogers R. Guide on chemical reaction hazards. Institute of chemical engineers (IChemE), Rugby. 1993.
- Townsend DI, Tou JC. Thermal hazard evaluation by an accelerating rate calorimeter. Thermochimica Acta. 1980;1;37(1):1-30.
- Keller A, Stark D, Fierz H.Estimation of the time to maximum rate using dynamic DSC experiments. Chemical Reaction Hazards. 1997;10(1):31-41.
- Frurip DJ, Elwell T. Effective use of differential scanning calorimetry in reactive chemicals hazard evaluation. Process Safety Prog. 2007;26(1):51-8.
- Stoessel.Experimental study of thermal hazards during the hydrogenation of aromatic nitro compounds.Loss Prev Process Ind. 1993;6(2):79-85.
- Bretherick L.Bretherick?s Handbook of reactive chemical hazards, 6thedition, Volume2. Butterworth-Heinemann Ltd. 1999.