Original Article
, Volume: 16( 2)Influence of Aluminum Addition on the Structural and Physical Properties of Tin- Antimony Alloy
- *Correspondence:
- Abbas Al-Bawee Materials Engineering Department, University of Diyala, Diyala, 32001, Iraq
Tel: +0201009061678; E-Mail: abbash77@engineering.uodiyala.edu.iq
Received Date: June 29, 2018 Accepted Date: July 24, 2018 Published Date: July 31, 2018
Citation: Abbas Al-Bawee, Feryal Dawood, Athil Al-Ezzi. Influence of Aluminum Addition on the Structural and Physical
Properties of Tin- Antimony Alloy. Mat Sci Ind J. 2018;16(2):133
Abstract
The aim of this study is to investigate the effects of adding different ratios of aluminum on the structural, mechanical, electrical and thermal properties of tin-antimony bearing alloy Sn87Sb13. Many experimental techniques were used. The results showed that crystallinity (peak intensity), crystal size (peak broadness) and orientations (peak position, 2θ) of Sn87Sb13alloy changed after adding different proportions of aluminum. Many mechanical and physical properties changed; for example, the hardness and minimum shear stress of the alloy increased while its internal friction dramatically decreased. Furthermore, the addition decreased the melting temperature of the alloy and increased its electrical resistivity. Thus, the properties of the tin-antimony alloy improved after adding the aluminum portions.
Keywords
Tin-antimony alloy; White metals; Internal friction; Hardness; Physical properties.
Introduction
White metals can be classified into two types: tin and lead as its main component. Tin-based white metals are common for their high thermal conductivity, compression strength, fatigue, and impact strength and corrosion resistance in addition to their low tendencies towards segregation. Tin- aluminum and lead- aluminum alloys are slightly different in their mechanical properties. Indium and lead have the lowest elastic modulus of all soft alloying phases with aluminum, Xie et al. [1]. Sn-Sb alloy is one of the most important types of Sn-based alloys. Tin based white metals are called bearing alloys due to the intermetallic compound (SbSn), which is harder than the matrix. Resistance to wear is the most significant property of bearing alloys as they are typically used for sliding bearings to transmit loads between moving surfaces because of their lubrication property such as Babbitt alloys (white metals), which have a good combination of strength and surface properties referring to Wang et al. [2].
Many prior studies have investigated the properties of tin based bearing alloys. El-Bediwi, Al-Bawee and Kamal [3] have inspected the effect of adding alloying elements, such as Cu, Bi, Al, Pb, Zn and Ag on the structural, physical and mechanical properties of Sn87Sb13 alloy. The study indicated that the microstructure of the alloy and present phases were changed after adding the alloying elements. The results also showed that Sn87Sb10Pb3 alloy was the most interesting alloy due to its lowest corrosion rate and internal friction, acceptable hardness, self-lubricate property and good thermal properties, which are significant for automotive applications. In addition, El-Bediwi, Grayb and Kamal [4] studied the Influences of adding titanium oxide (TiO2) nanoparticles on the mechanical and thermal properties of tin-aluminum-antimony comparing to tin-antimony-lead bearing alloy. The results revealed that the tin antimony lead alloy has better bearing properties such as low internal friction, high elastic modulus and thermal diffusivity for industrial applications. Furthermore, El-Bediwi, El-Shishtawi and Abdullah [5] have studied the different compositions of tin based alloys (Sn80Al10Sb10, Sn80Al10Bi10, Sn80Al10Bi5Sb5, Sn76Al10Sb10Cu2Zn2 and Sn76Al10Bi10Cu2Zn2. Sn76Al10Sb10Cu2Zn2 alloy was the best alloy for bearing applications because of the high values of corrosion resistance, hardness, thermal diffusivity and low internal friction. They have also investigated at the same year the microstructure and mechanical properties of Sn80Al20, Sn70Al20Bi5Zn3Cu2, Sn65Al20Sb5Pb5Cd5, Sn70Al20Sb5Ag3Zn2 and Sn63Al20Sb10Pb5Zn2 and found that Sn70Al20Sb5Ag3Zn2 alloy has the best properties for automotive industries. Moreover, Dawood [6] studied the properties of Sn80Sb15X (X=Cu2.5Al2.5 or Cu2.5Pb2.5 or Pb2.5Zn2.5 or Pb2.5Bi2.5) and stated that Sn80Sb15Sn80Cu2.5Al2.5 alloy was the best one due to its low internal friction, high thermal diffusivity and temperature coefficient of resistivity values. Finally, El-Bediwi, Samir and Kamal [7] detected the structural, mechanical and thermal properties of several bearing alloys such as Sn82Bi15Zn3, Sn77Bi15Zn3Sb5, Sn79Bi15Zn3Ag3 and Sn81.3Bi15Zn3Cu0.7 and proved that Sn77Bi15Zn3Sb5 has the lowest corrosion rate value. Also, the melting temperature and contact angle of the alloy decreased after adding an amount of bismuth.
The aim of this research is to investigate the effect of adding different portions of aluminum on the structural, mechanical and physical properties of tin-antimony Sn87Sb13 bearing alloy. Investigations the properties of Sn-based alloys are crucial for many engineering applications such as in die casting alloys, cable casing, battery grids, automobile and shipbuilding industry, Jiang et al. [8].
Materials and Methods
Sn87−xSb13Alx (x= 5, 10, 15 and 20) alloys were prepared using tin, antimony and aluminium with a purity of 99.5%. The alloys were first melted in a muffle furnace. Next, the formed ingots were re-melted again to increase the homogeneity. From these alloys, long ribbons of approximately 4 mm width and 80 μm thicknesses were prepared by single roller melt spinning technique. Finally, the samples were cut by a double knife cuter to the required dimensions. The representative stream sediment sample was collected from different locations of wadi El Reddah of ore grade 380 ppm U3O8 for carrying out the study. The stream sediment sample was ground to desired particle size. After sample preparation, the sample was subjected to analysis and leaching study.
The microstructure of the samples was investigated by Shimadzu X-ray Diffractometer, (Dx–30, Japan), Cu–Ka radiation with l=1.54056 Å at 45 kV and 35 mA and Ni–filter, in an angular range 2q ranging from 0℃ to 100℃ in a continuous mode with a scan speed 5 deg/min. X-ray diffraction is an important tool used to identify phases, quantify changes in the cell parameters, orientation, crystallite size and other structural parameters. It is also used to determine the (crystallographic) structure (i.e. cell parameters, space group and atomic coordinates) of novel or unknown crystalline materials.
Differential scanning calorimetry (DSC) thermographs were obtained by SDT [Q600 (V20.9 Build 20), U. S. A] instrument with a heating rate of 10 k/min at a temperature range 0-400℃. Furthermore, a digital Vickers micro-hardness tester, (Model-FM-7- Japan), was used to measure the hardness of the samples. Moreover, the internal friction Q-1 was determined using the dynamic resonance method according to Cullity [9] and J.N [10] by plotting the amplitude of vibration against the frequency of vibration. Finally, thermal diffusivity Dth was derived and calculated from Berry and Pritchett equation according to Eichler et al. [11].
Finally, double-bridge method was used for measuring the electrical resistance of melt spun alloys. This method provides high accuracy for measuring small resistance owing to the fact that the series resistances of the contacts and current conductors have no effect on the potentials at the points (f) and (c) to which a nanometer is connected. Since the arm resistances R1, R2, R3 and R4 are substantially greater than these series resistances. Measurements are made as follow: by varying the resistances R2, R4 while resistances R1, R3 are left unchanged with a constant reference resistance RN until the potentials at points (f) and (c) are equalized which correspond to the zero reading of the nano-ammeter. At this moment the voltage drops across sections (af) and (fe) are equal to the voltage drops across sections (ac) and (ce) respectively. Then the resistance of the specimen (x) was calculated from the equation:
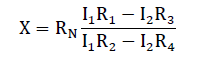
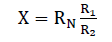
If R1=R3 and R2=R4 then:
To check that the bridge circuit readings are corrected a known reference resistance RF is connected into the bridge instead of the measured unknown resistance X. The actual value Xact of the unknown resistance can then be found from the proportion,
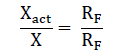
Where X' = circuit reading with resistance X connected into it. RF’ = reading with X replaced by RF.
This checking can reduce substantially the measuring error of the double-bridge circuit (approximately from 0.1- 0.2 to 0.001 - 0.002 per cent).
Results and Discussion
According to the phase diagram of SnSb alloy (Figure 1), Sn87Sb13alloy forms two phases Sn and Sb-Sn.

Figure 1: The phase diagram of tin-antimony system Source: Zu et al (2006) [12].
The results of X-ray diffraction patterns showed Sn87−xSb13Alx (x= 5, 10, 15 and 20) alloys having lines corresponding to β Sn, Al, Sb and Al-Sn phases, (Figure 2-6).

Figure 2: X-ray diffraction pattern of Sn87Sb13 based alloy.

Figure 3: X-ray diffraction pattern of Sn82Sb13Al5 alloy.

Figure 4: X-ray diffraction pattern of Sn77Sb13Al10 alloy.

Figure 5: X-ray diffraction pattern of Sn72Sb13Al15 alloy.

Figure 6: X-ray diffraction pattern of Sn67Sb13Al20 alloy.
Table 1-5 identifies changes in the cell parameters, orientation, crystallite size (2q, intensity, d Å, full width at half maximum of peak, phases and Miller indices) of Sn87−xSb13Alx alloys. The results showed that the started baseline, peak intensity (crystallinity), peak broadness (crystal size) and position (orientation) changed by adding different ratios of Al to the base alloy Sn87Sb13 since Al atoms dissolved in the Sn-Sb matrix alloy and formed a solid solution. Other accumulated Al atoms formed (Al or AlSn intermetallic phases).
| Sn87Sb13 | |||||
|---|---|---|---|---|---|
| 2θ° | dA° | Int.% | FWHM | phase | h k l |
| 29.0531 | 3.07356 | 7.27 | 0.2362 | SbSn | 200 |
| 30.3267 | 2.92847 | 100 | 0.3755 | Sn | 200 |
| 31.9769 | 2.7989 | 23.56 | 0.2755 | Sn | 101 |
| 41.5862 | 2.17169 | 0.67 | 0.4724 | SbSn | 220 |
| 43.6756 | 2.06847 | 1.36 | 0.2362 | Sn | 220 |
| 44.8178 | 2.02232 | 6.25 | 0.2755 | Sn | 211 |
| 55.199 | 1.66405 | 1.86 | 0.3149 | Sn | 301 |
| 62.4496 | 1.48716 | 1.78 | 0.2755 | Sn | 112 |
| 63.5228 | 1.46459 | 1.5 | 0.2362 | Sn | 400 |
| 64.4542 | 1.44566 | 1.26 | 0.3149 | Sn | 321 |
| 72.2359 | 1.30789 | 0.9 | 0.3936 | Sn | 420 |
| 72.9821 | 1.29635 | 1.19 | 0.3149 | Sn | 411 |
| 79.3806 | 1.20716 | 0.77 | 0.3936 | Sn | 312 |
| 89.1198 | 1.09874 | 0.61 | 0.4723 | Sn | 431 |
| 95.4227 | 1.04128 | 0.37 | 0.576 | Sn | 332 |
Table 1. X-ray analysis of Sn87Sb13 alloy.
| Sn82Sb13Al5 | |||||
|---|---|---|---|---|---|
| 2θ° | dA° | Int.% | FWHM | phase | h k l |
| 30.6267 | 2.91914 | 81.16 | 0.2558 | Sn | 200 |
| 31.9715 | 2.79935 | 100 | 0.2755 | Sn | 101 |
| 43.9372 | 2.06079 | 24.28 | 0.2952 | Sn | 220 |
| 44.951 | 2.01664 | 57.06 | 0.3149 | Sn | 211 |
| 55.3554 | 1.65972 | 13.86 | 0.3542 | Sn | 301 |
| 62.5501 | 1.48501 | 23.55 | 0.2755 | Sn | 112 |
| 63.888 | 1.4571 | 8.11 | 0.3149 | Sb | 107 |
| 64.5886 | 1.44298 | 23.75 | 0.1771 | Al | 220 |
| 72.4516 | 1.30453 | 17.45 | 0.2558 | Sb | 18 |
| 73.3289 | 1.29108 | 13.24 | 0.1968 | Sn | 411 |
| 79.5548 | 1.20495 | 18.24 | 0.1968 | Sn | 312 |
| 89.522 | 1.09485 | 8.56 | 0.2755 | AlSb | 440 |
| 95.6097 | 1.0406 | 6.56 | 0.2558 | Sn | 103 |
| 97.4467 | 1.02497 | 2.82 | 0.768 | Sn | 440 |
Table 2. X-ray analysis of Sn82Sb13Al5 alloy.
| Sn77Sb13Al10 | |||||
|---|---|---|---|---|---|
| 2θ° | dA° | Int.% | FWHM | phase | h k l |
| 30.6511 | 2.91686 | 100 | 0.1574 | Sn | 200 |
| 31.9932 | 2.7975 | 70.35 | 0.2165 | Sn | 101 |
| 43.85 | 2.06468 | 26.89 | 0.2362 | Sn | 220 |
| 44.888 | 2.01932 | 60.92 | 0.1771 | Sn | 211 |
| 55.262 | 1.66231 | 14.11 | 0.3542 | Sn | 301 |
| 62.4759 | 1.48659 | 16.09 | 0.1968 | Sn | 112 |
| 63.6812 | 1.46133 | 8.04 | 0.1968 | Sb | 107 |
| 64.4967 | 1.44481 | 16.09 | 0.2362 | Al | 220 |
| 72.2788 | 1.30722 | 9.12 | 0.3542 | Sb | 18 |
| 73.0861 | 1.29476 | 9.96 | 0.1968 | Sn | 411 |
| 79.4119 | 1.20676 | 14.29 | 0.1574 | Al | 311 |
| 89.3354 | 1.09665 | 7.38 | 0.1574 | Al Sb | 440 |
| 95.5146 | 1.04138 | 4.62 | 0.3149 | Sn | 103 |
| 97.3492 | 1.02574 | 3.78 | 0.192 | Sn | 440 |
Table 3. X-ray analysis of Sn77Sb13Al10 alloy.
| Sn72Sb13Al15 | |||||
|---|---|---|---|---|---|
| 2θ° | dA° | Int.% | FWHM | phase | h k l |
| 30.5958 | 2.92201 | 100 | 0.2755 | Sn | 200 |
| 31.9724 | 2.79928 | 60.19 | 0.2558 | Sn | 101 |
| 43.8521 | 2.06459 | 32.21 | 0.2952 | Sn | 220 |
| 44.8974 | 2.01892 | 46.75 | 0.3149 | Sn | 211 |
| 55.3074 | 1.66105 | 12.17 | 0.1968 | Sn | 301 |
| 62.4523 | 1.4871 | 11.76 | 0.2165 | Sn | 112 |
| 63.7942 | 1.45902 | 6.73 | 0.2165 | Sb | 107 |
| 64.5237 | 1.44427 | 12.35 | 0.2952 | Al | 220 |
| 72.3975 | 1.30537 | 8.97 | 0.2362 | Sb | 18 |
| 73.1023 | 1.29452 | 6.81 | 0.1771 | Sn | 411 |
| 79.4668 | 1.20607 | 8.8 | 0.2165 | Al Sb | 422 |
| 89.3437 | 1.09657 | 4.63 | 0.1574 | Al Sb | 440 |
| 95.5064 | 1.04145 | 2.74 | 0.3149 | Sn | 103 |
| 96.6565 | 1.03209 | 1.22 | 0.2362 | Sn | 411 |
Table 4. X-ray analysis of Sn72Sb13Al15 alloy.
| Sn67Sb13Al20 | |||||
|---|---|---|---|---|---|
| 2θ° | dA° | Int.% | FWHM | phase | h k l |
| 30.5701 | 2.92441 | 100 | 0.1968 | Sn | 200 |
| 31.9706 | 2.79943 | 71.55 | 0.2165 | Sn | 101 |
| 43.7868 | 2.06752 | 32.42 | 0.2952 | Sn | 220 |
| 44.8501 | 2.02094 | 63.1 | 0.2362 | Sn | 211 |
| 55.2836 | 1.66171 | 17.89 | 0.2362 | Sn | 301 |
| 62.4416 | 1.48733 | 18.89 | 0.1968 | Sn | 112 |
| 63.7165 | 1.46061 | 13.19 | 0.1771 | Sb | 107 |
| 64.4835 | 1.44508 | 19.67 | 0.2165 | Al | 220 |
| 72.334 | 1.30636 | 13 | 0.1968 | Sb | 18 |
| 73.1141 | 1.29434 | 15.64 | 0.2755 | Sn | 411 |
| 79.4265 | 1.20658 | 15.94 | 0.2165 | Sn | 312 |
| 89.2799 | 1.09719 | 9.17 | 0.1968 | Al Sb | 440 |
| 95.5006 | 1.04149 | 6.83 | 0.1968 | Sn | 103 |
| 97.4871 | 1.02465 | 3.64 | 0.576 | Sn | 440 |
Table 5. X-ray analysis of Sn67Sb13Al20 alloy.
The crystal size was given by measuring the diffraction pattern broadening using Scherer formula mentioned in Cullity (1959). Table 6 shows the calculated lattice parameters, (a and c), unit volume cell (V) and crystal size (t) of the tetragonal tin phase. It can be clearly seen that adding different ratios of Al to Sn87Sb13 alloy led to a little variation in the lattice parameters and unit cell volume of the tetragonal tin phase in addition to a significant change in the crystal size.
| Alloys | a Ǻ | c Ǻ | c/a | V Ǻ3 |  |
|---|---|---|---|---|---|
| Sn87Sb13 | 5.857 | 3.17 | 0.541 | 108.74 | 282.56 |
| Sn82Sb13 Al5 | 5.838 | 3.183 | 0.545 | 108.5 | 390.5 |
| Sn77Sb13Al10 | 5.834 | 3.187 | 0.546 | 108.47 | 689.28 |
| Sn72Sb13Al15 | 5.844 | 3.188 | 0.546 | 108.87 | 432.55 |
| Sn67Sb13 Al20 | 5.849 | 3.188 | 0.545 | 109.06 | 532.35 |
Table 6. Lattice parameter, unit cell volume and crystal size of β- Sn in Sn87-xSb13Alx alloys.
Resonance technique was used by taking the first amplitude of the ribbon at which the frequency appears, which is used to calculate the elastic modulus, thermal diffusivity, internal friction of the alloys, Figure 7.

Figure 7: Resonance curves of Sn87-xSb13Alx alloys.
Figure 8 states the calculated internal friction and thermal diffusivity values of Sn87−xSb13Alx alloys as follows:

Figure 8: Internal friction (Q-1x10⁻³) and thermal diffusivity (Dth x10-8 m2/sec) values of Sn87-xSb13Alx alloys.
Internal friction = 0.57735026 * full width at half maximum of peak (FWHM)/Frequency (f)
Thermal diffusivity =2*thickness ^2 * frequency/ 3.14159
The results reveal that the internal friction of the base alloy decreases a lot after adding the different ratios of Al nevertheless, thermal diffusivity values are approximately stable at the same rate.
Figure 9 illustrates the calculated elastic modulus, shear modulus and balk modulus of Sn87−xSb13Alx (x= 5, 10, 15 and 20 wt. %) alloys using Minitab17. The results show that Sn67Sb13Al20 has the highest values concerning the three modules.

Figure 9: E (GPa), μ (GPa) and B (GPa) Statistics of Sn87-xSb13Alx alloys.
The modules were calculated as follows:
E= 38.32* (density (ρ)*(Poisson’s ratio (ν) ^4) *Frequency (f) ^2)/ (thickness of the sample ^2)
The density (ρ) of the sample= (mass)/ (0.04*0.004* thickness)
Poisson’s ratio (ν) of an alloy = summation of the Poisson’s ratio (ν) of elements * % per cent of the element in the compound.
Shear modulus = young modulus / (2*(1+Poisson ratio))
Bulk modulus= young modulus / (3*(1-2* Poisson ratio))
Furthermore, the results show that the hardness at a load (10 g) and indentation time (5 sec) and minimum shear stress of the Sn87Sb13 alloy increased after adding the Al proportions, Table 7. It seems that the intermetallic phase (Al Sb) formed after adding aluminum portions increased the hardness of the alloy as it’s harder than the matrix. Increasing the hardness improves wear resistance which is important in dry sliding condition.
| Alloys | HV (Kg/mm2) | tm (Kg/µµ2) |
|---|---|---|
| Sn87Sb13 | 23.033 ± 2.1 | 7.6 |
| Sn82Sb13 Al5 | 33.23 ± 3.44 | 11.01 |
| Sn77Sb13Al10 | 34.47 ± 2.35 | 11.38 |
| Sn72Sb13Al15 | 38.85 ± 4.68 | 12.66 |
| Sn67Sb13 Al20 | 43 ± 4.1 | 14.32 |
Table 7. Vickers hardness and minimum shear stress of Sn87-xSb13Alx alloys.
Moreover, Figure 10 exhibits the values of electrical resistivity of Sn87−xSb13Alx (x= 5, 10, 15 and 20 wt. %) alloys. Generally, the electrical resistivity of the base alloy increased after adding Al content as dissolved Al atoms work as a scattering center for conduction electrons, which changed the measured electrical resistivity. In many applications, the electrical behavior of a material is more critical than its mechanical behavior: El-Bediwi et al. [13]. In order to select and use the alloys for industrial applications, we must understand how properties such as electrical resistivity is produced and controlled.

Figure 10: Electrical resistivity of Sn87-xSb13Alx alloys.
In general, plastic deformation raises the electrical resistivity as a result of increasing the number of electron scattering centers. Crystalline defects serve as scattering center for conduction electrons in metals. This depends on temperature composition and the degree of cold working. Electrons scattering may be caused by several types of lattice defects: by phonon scattering, impurities and by mechanical deformation. An experimental fact, known for a long time, is that the contributions to the resistivity ρ from these several sources are additive. This rule, known as Mathiessens rule that can be written as:
ρ total = ρ temperature + ρ impurities + ρ deformation
For this reason, increasing the rate of electrical resistivity with temperature is dependent of the small amount of present alloying elements and the state of deformation. The actual cause of resistivity must therefore be sought in deviations from the periodicity of the potential in which the electron moves that cause resistivity due to: (1) boundaries (2) lattice defect (3) lattice vibration (4) foreign impurity atoms.
Finally, DSC thermographs were obtained with a heating rate of 10℃ /min at a temperature range of (0 – 400℃). DSC thermographs of Sn87−xSb13Alx (x= 5, 10, 15 and 20 wt. %) alloys are shown in Figure 11-15. Thermal analysis is used to study solid-state transformations as well as solid-liquid reactions. They depend on the nature of solid phase and its temperature. As it shown, a little variation in the shape of the thermal peak of SnSb13 alloy caused by adding the different ratios of aluminum.

Figure 11: DSC graphs of Sn87Sb13 alloy.

Figure 12: DSC graphs of Sn82Sb13Al5 alloy.

Figure 13: DSC graphs of Sn77Sb13Al10 alloy.

Figure 14: DSC graphs of Sn72Sb13Al15 alloy.

Figure 15: DSC graphs of Sn67Sb13Al20 alloy.
The melting temperatures of Sn87−xSb13Alx alloys are presented in Figure 16. It can be clearly seen that the melting temperature of Sn87Sb13 alloy decreased after adding the different ratios of aluminum.

Figure 16: Melting temperatures of Sn87-xSb13Alx alloys.
Conclusion
In conclusion, it can be clearly seen that adding different ratios of Al to Sn-Sb based alloy indicated forming new phases and differences in the lattice parameters and the unit cell volume of the tetragonal tin phase in addition to a substantial change in the crystal size. In terms of the mechanical properties, Sn67Sb13Al20 alloy has the highest values of elastic, shear and balk modules. The hardness and minimum shear stress of the base alloy increased after adding the Al proportions. Moreover, the results showed that the internal friction of the origin alloy significantly decreased after adding the different fractions of Al, however, thermal diffusivity values were nearly settled at a fixed rate. The addition also increased the electrical resistivity and clearly decreased the melting temperature of the base alloy. Sn77Sb13Al10 alloy is the most interesting alloy due to its low melting point and acceptable hardness, lowest internal friction, highest thermal diffusivity and electrical resistivity for bearing applications.
Competing Interests
No conflict of interest
Acknowledgements
The authors would like to acknowledge the high ministry of education and scientific research for support.
References
- Xie J, Zheng YX, Pan RJ, et al. Sb-based alloy (NiSb, FeSb2) nanoparticles decorated graphene prepared by one-step solvothermal route as anode for Li-ion batteries. Int J Electrochem Sci. 2011;6:4811-21.
- Wang A, Li Y, Yang B, et al. Vacuum. 2014.127–34.
- El-Bediwi AB, Al-Bawee A, Kamal M. Corrosion behavior and physical properties of modified tin-antimony bearing alloy. Mat Sci Ind J. 2015;13(4):136–44.
- El-Bediwi AB, Grayb M, Kamal M. Influence of Titanium Oxide on Creep Behavior, Microstructure and Physical Properties of Tin-Antimony and Tin-Aluminum-Antimony Based Bearing Alloys. IREA. 2015;4(2):64-70.
- El-Bediwi AB. Study microstructure, hardness, internal friction, electrochemical corrosion and thermal behavior of tin-aluminum-antimony or tin-aluminum-bismuth based alloys. GJP. 2016;4(3):445-60.
- Dawood F. Study the structure and physical properties of tin-antimony basedbearing alloys. Global Journal of Physics. 2017;5(2):554-61.
- El-Bediwi AB, Samir R, Kamal M. Electrochemical Corrosion Behavior, Microstructure and Soldering Properties of Tin Based Alloys. Mat Sci Res India. 2018;15(1):12-22.
- Jiang Z, Lu Y, Zhao S, Gu W, et al. Effect of some elements on the performance of lead-antimony alloys for lead/acid batteries. J Power Sources. 1990;31(1-4):169-75.
- Cullity B. Elements of X-Ray Diffraction, 2nd edn. Addison-Wesley Publishing Company, Inc. 1959.
- S T, JN G. Theory of elasticity. McGraw-Hill Book Co, New York- Toronto-London. 1951.
- Eichler H, Salje G, Stahl H. Thermal diffusion measurements using spatially periodic temperature distributions induced by laser light. J Appl Phys.1973;44(12):5383-8.
- Zu FQ, Shen RR, Xi Y, et al. Electrical resistivity of liquid Sn–Sb alloy. J Phys Condens Matter. 2006;18(10):2817.
- El-Bediwi AB, El-Shishtawi NA, Abdullah MM. Electrochemical Corrosion Behavior, Microstructure, Mechanical and Thermal Performance of Tin-Aluminum Based Bearing Alloys.