Original Article
, Volume: 12( 2)Comparative Studies on the Reaction Mechanism of Ceftazidime with Trypsin by Fluorescence Spectroscopy and Synchronous Fluorescence Spectroscopy
- *Correspondence:
- Baosheng Liu Key Laboratory of Analytical Science and Technology of Hebei Province, College of Chemistry and Environmental Sciences, Hebei University, Baoding 071002, Hebei Province, P.R. China Tel: +86-312-5079385; E-mail: lbs@hbu.edu.cn
Received Date: June 23, 2017 Accepted Date: July 22, 2017 Published Date: July 28, 2017
Citation: Liu B, Wang J, Bian G, et al. Comparative Studies on the Reaction Mechanism of Ceftazidime with Trypsin by Fluorescence Spectroscopy and Synchronous Fluorescence Spectroscopy. Inorg Chem Ind J. 2017;12(2):116
Abstract
The reaction mechanism of ceftazidime (CFD) with trypsin (TRP) was investigated using fluorescence spectroscopy and synchronous fluorescence spectroscopy at different temperatures (298, K 303 K and 310 K). The results showed that electrostatic force played a major role on the conjugation reaction between TRP and CFD, and the type of quenching was static quenching. The binding constants obtained using the above methods were of the same order of magnitude and very similar. Static electric forces played a key role in the interaction between CFD and TRP, and the number of binding sites in the interaction was close to 1. The donor-to-acceptor distance r<7 nm indicated that the static fluorescence quenching of TRP by CFD was also a non-radiation energy transfer process. The results of two methods were consistent that showed the synchronous fluorescence spectroscopy could be used to study the reaction mechanism between drug and protein, and was a useful supplement to the conventional fluorescence quenching method.
Keywords
Fluorescence spectroscopy; Synchronous fluorescence spectroscopy; Ceftazidime; Trypsin; Reaction mechanism
Introduction
Ceftazidime (CFD) is the third-generation cephalosporin whose structure, antibacterial activity, and stability to β-lactamases have been described and researched extensively (the structure shown in Figure 1). A number of studies have documented its broad spectrum of antibacterial activity against aerobic, anaerobic gram-positive and gram-negative bacteria effectively. CFD is suitable for the following infections caused by sensitive bacteria: lower respiratory tract infection, urinary tract infection, septicemia, skin and soft tissue infections, bone and joint infection and it also can be used in surgery to prevent infection.

Figure 1: Chemical structure of CFD.
Trypsin (TRP), a serine protease, is the most abundant proteases in nature and plays an essential role in digestion and deconstruction of food proteins and other physiological processes including hemostasis, apoptosis, signal transduction, reproduction, and immune response [1]. The molecular weight of TRP is 23,300 Dalton and it consists of 223 amino acid residues [2]. The individual chains are held together by six disulfide bridges. It is composed of two domains of nearly equal size, the major constituent of each domain being a set of six anti-parallel strands of polypeptide chain tied together into a β-sheet unit by a network of H-bonds [3]. TRP has four amino acids (Trp51, Trp141, Trp215, and Trp237) that can be used as intrinsic fluorophores [4]. Due to its essential physiological function, it has often been chosen as target protein to study the structural effects of small molecules to TRP and thereby the function [5]. At present, the molecular interactions between TRP and many ligands have been investigated successfully in biochemistry domain. However, the interaction between CFD and TRP has not been investigated. In this paper, the interaction of CFD with TRP under different temperature conditions by used fluorescence spectroscopy and molecular docking technology. Furthermore, the thermodynamic parameters of the reaction between CFD and TRP were obtained by the Van't Hoff equation. This study is expected to provide important insight into the essence, potential toxicity between drugs and protein in real terms, and can also provide a useful clinical reference for future combination therapy.
Experimental Procedure
Apparatus
All fluorescence spectra were recorded with a Shimadzu RF-5301PC spectrofluorophotometer. Absorption was measured with an UV-VIS recording spectrophotometer (UV-265, Shimadzu, Japan). All pH measurements were carried out with a pHS-3C precision acidity meter (Leici, Shanghai, China). All temperatures were controlled by a SYC-15B superheated water bath (Nanjing Sangli Electronic Equipment Factory).
Materials
Trypsin was purchased from Sigma Co. and was of the purity grade inferior 99%. Ceftazidime (CAS#, 78439-06-2) was obtained from Monitor of Chinese Veterinary Medicine (the purity grade inferior 99%). Stock solutions of TRP (1.0 × 10⁻⁴ M) and CFD (1.0 × 10⁻³ M) were prepared. All the stock solutions were further diluted for use as working solutions. Tris-HCl buffer solution containing 0.15 M NaCl was used to maintain the pH of solutions at 7.40 and NaCl solution was used to maintain the ionic strength of the solution. All other reagents were of analytical grade and all aqueous solutions were prepared with newly double-distilled water and stored at 277 K.
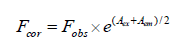
The fluorescence intensities were corrected for the absorption of excitation light and re-absorption of emitted light to decrease the inner filter using the following relationship:
 (1)
(1)
Where, Fcor and Fobs are the corrected and observed fluorescence intensities, respectively. Aex and Aem are the absorbance values of CFD at excitation and emission wavelengths, respectively. The fluorescence intensity utilized in this study is the corrected intensity.
Procedures
Fluorescence measurements: In a typical fluorescence measurement, 1.0 mL of Tris-HCl solution, 1.0 mL of 1.0 × 10⁻⁵ M TRP solution and different concentrations of CFD were successively added to a 10 mL colorimetric tube. The samples were diluted to scaled volume with water, mixed thoroughly by shaking, and kept static for 30 min at different temperatures (298, 303 and 310 K). The excitation and emission slits were set at 5 nm. The excitation wavelength for TRP was 280 nm and 295 nm, respectively, with a 10 nm path length cell. We recorded the intensity of fluorescence at 340 nm.
Synchronous fluorescence measurements: Solution preparation was as detailed above. The difference between excitation wavelength and emission wavelength Δλ was set at 15 nm and 60 nm, respectively. Then we recorded the intensity of synchronous fluorescence at 300 nm and 340 nm, respectively.
UV-VIS measurements: 0.5 mL of Tris-HCl solution, 1.0 mL of 1.0 × 10⁻⁵ M TRP solution and different concentrations of CFD were successively added to a 10 mL colorimetric tube, and the reference solutions were the corresponding concentration of CFD solutions. The samples were diluted to scaled volume with water, mixed thoroughly by shaking, and kept static for 30 min at 298 K. The UV-VIS absorption spectrum of CFD in the presence and absence of TRP were scanned with 1cm quartz cells over the range from 190 nm to 300 nm.
Results and Discussion
UV-VIS absorption spectra studies
The UV-VIS absorption spectra of TRP in the absence and presence of CPD are shown in Figure 2. It can be seen that TRP has two absorption peaks, which is at 208 nm and at 280 nm. With the increasing concentration of CFD, Figure 2 show that the intensity of absorption peak at 208 nm decreases with red shifted. The results suggest that the interaction between CFD and TRP resulted in the formation of a new complex, and the content of α- helix was changed resulting in conformational changes of TRP. The intensity of the absorption peak at 280 nm was reduced, illustrating that the interaction between CFD and TRP happened in the ground-state molecules. That is to say, non-luminous complex formed in ground state of CFD and TRP, which led to the change of UV-VIS absorption spectra of TRP. Dynamic quenching only affects the excited states of fluorescent molecule, and does not alter the absorption spectra of the fluorescent substance. So we can get preliminary inference that type of fluorescence quenching of CFD with TRP was static quenching.

Figure 2: Absorption spectrum of TRP-CFD system (T=298 K). CTRP=2.0 × 10⁻⁵ mol/L, 1~6: CCFD=(0, 5.0, 6.0, 8.0, 10.0, 30.0) × 10-5 mol/L.
Fluorescence quenching spectra of TRP-CFD system
The fluorescence spectra of TRP-CFD system were shown in Figure 3 (similar to 295 nm). As shown in Figure 3, the fluorescence intensity of TRP decreased regularly with the addition of CFD when the excitation wavelength was 280 nm, which indicated that CFD could quench the intrinsic fluorescence of TRP strongly and there was an interaction between CFD and TRP.

Figure 3: Fluorescence emission spectra of TRP-CFD system (T=298 K, λex=280 nm). CTRP=2.0 × 10⁻⁶ mol/L, 1~10: CCFD= (0, 0.2, 0.4, 1.0, 2.0, 3.0, 4.0, 5.0, 6.0, 10) × 10-5 mol/L.
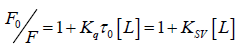
In order to obtain a clear insight into the quenching mechanism, the fluorescence quenching dates are analyzed by the Stern-Volmer equation (2):
 (2)
(2)
Where, F0 and F represent the steady-state fluorescence intensities in the absence and presence of quencher, respectively. τ0 is the fluorescence lifetime without a quencher present (τ0=10–8 s). Ksv is the Stern-Volmer quenching constant. Kq is the quencher rate coefficient of the biological macro-molecule, and [L] is the concentration of the quencher. Based on the linear fit plot of F0/F versus [L], the values of Ksv and Kq could be obtained at different temperatures are given in Table 1. It was observed that Ksv declines with rising temperature, which infers that a complex formed. In addition, the values of Kq was much greater than the maximum scatter collision quenching constant of various quenchers (2 × 10¹⁰ M-1·s-1) under different temperatures, which suggested that the quenching was a static process. This conclusion is consistent with the UV-VIS absorption spectra.
| λex (nm) | T/(K) | Kq /(L/mol·s) | Ksv /(L/mol) | r1 | Ka /(L/mol) | n | r2 |
|---|---|---|---|---|---|---|---|
| 280 | 298 | 1.49 × 10¹² | 1.49 × 10⁴ | 0.9937 | 1.40 × 10⁴ | 0.96 | 0.9976 |
| 303 | 1.36 × 10¹² | 1.36 × 10⁴ | 0.9932 | 1.35 × 10⁴ | 0.91 | 0.9984 | |
| 310 | 1.20 × 10¹² | 1.20 × 10⁴ | 0.9986 | 1.24 × 10⁴ | 1.01 | 0.9997 | |
| 295 | 298 | 1.11 × 10¹² | 1.11 × 10⁴ | 0.9991 | 1.14 × 10⁴ | 1.02 | 0.9991 |
| 303 | 1.09 × 10¹² | 1.09 × 10⁴ | 0.9930 | 1.01 × 10⁴ | 0.96 | 0.9929 | |
| 310 | 9.73 × 10¹¹ | 9.73 × 10³ | 0.9949 | 9.85 × 10³ | 0.93 | 0.9936 |
Kq is the quenching rate constant; Ka is the binding constant; n is the number of binding site; r1 is the linear relative coefficient of F0/F∼ [L]; r2 is the linear relative coefficient of log (F0−F)/F∼log{[Dt]-n[Bt](F0−F)/F0}.
Table 1. Quenching reactive parameters of TRP-CFD system at different temperatures.
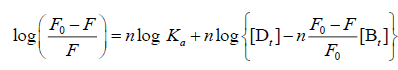
For the static quenching interaction, when small molecules bind independently to a set of equivalent sites on a macromolecule, the binding constant (Ka) and the number of binding sites (n) can be obtained from the following Eq. (3):
 (3)
(3)
Where [Dt] and [Bt] are the overall concentrations of CFD and TRP, respectively. Ka and n represent the binding constant and the number of binding sites of the CFD-TRP complex, respectively, which were calculated from the intercept and slope of the regression curve of log [(F0-F)/F] versus log {[Dt]-[Bt] (F0-F)/F0}. As seen in Table 1, the values of n at the experimental temperatures were approximately equal to 1, which suggested that just one binding site for CFD existed in TRP. Meanwhile, the binding constants Ka decreased with increasing temperature, the stability of ground-state complex was reduced with rising temperature, further suggesting that the quenching was a static process [6].
The primary binding site studies
At 280 nm wavelength, the tryptophan (Trp) and tyrosine (Tyr) residues in TRP are excited, whereas the 295 nm wavelength excites only Trp residues [7]. Based on the Stern-Volmer equation, comparing the fluorescence quenching of protein excited at 280 nm and 295 nm allows to estimate the participation of Trp and Tyr groups in TRP-CFD system. As seen in Figure 4, in the presence of CPMS, the quenching curves of BHb excited at 280 nm and 295 nm no overlap, and the extent of fluorescence quenching at 280 nm was larger than the extent of fluorescence quenching at 295 nm. This phenomenon showed that Tyr and Trp residue both participated in the interaction of CFD with TRP.

Figure 4: Quenching curves of TRP-CFD system (T=298 K) at λex=280 nm and 295 nm. CTRP=2.0 × 10⁻⁶ mol/L, 1~10: CCFD= (0.2, 0.4, 1.0, 2.0, 3.0, 4.0, 5.0, 6.0, 10) × 10-5 mol/L.
Synchronous fluorescence spectra studies
When the value of Δλ between the excitation and emission wavelengths is stabilized at either 15 nm or 60 nm, synchronous fluorescence gives characteristic information for tyrosine or tryptophan residues, respectively [8]. The location change of maximum emission wavelength of synchronous fluorescence can reflect the change of polarity of group molecules. It could be seen in the Figure 5 that when Δλ=15 nm, the fluorescence intensities of TRP-CFD showed obvious decrease, and had no shifts with increasing the concentration of CFD. When Δλ=60 nm, the synchronous fluorescence intensities of TRP-CFD decreased regularly with blue shifts, which indicated that the microenvironment of tryptophan was changed due to the interaction of CFD with TRP, and the polarity of the hydrophobic environment was reduced and hydrophobicity was enhanced in the TRP cavity due to changes in the microenvironment of the tryptophan residues on insertion of CFD. This led to the conformational changes of TRP. When the value of Δλ between the excitation and emission wavelengths was stabilized at either 15 nm or 60 nm, the synchronous fluorescence intensity was reduced, which further suggested the tryptophan and tyrosine were involved in the interaction of TRP and CFD. For the quenching process, we calculated the combinational parameters of system using equation (2), (3), and the results were listed in Table 2. As seen in Table 2, the Stern-Volmer quenching constant Ksv decreased with the increase of temperature, indicating that the quenching process was static quenching. At the same time, the values of Kq were much greater than the maximum scatter collision quenching constant of various quenchers (2 × 10¹⁰ M-1·s-1) under different temperatures, which proved that the quenching process was a static quenching process with the formation of a new complex. The number of binding bites (n) was about 1, indicating that one molecule of CFD combines with one molecule of TRP. With increasing temperature, the values of Ka were reduced, which suggested the stability of ground-state complex was reduced with increasing temperature and also showed that quenching process was a static quenching process. The quenching mechanism obtained by synchronous fluorescence method was coincident with that obtained by fluorescence quenching method. The change tendency was the same as the excitation wavelength 280 nm. Meanwhile, comparing Tables 1 and 2, you could see that the quenching parameters of TRP-CFD by two methods were in the same order of magnitude.

Figure 5: Fluorescence spectrum of TRP-CFD system (T=298 K) (A) Δλ=15 nm; (B) Δλ=60 nm. CTRP=2.0 × 10⁻⁶ mol/L, 1~10: CCFD=(0, 0.2, 0.4, 1.0, 2.0, 3.0, 4.0, 5.0, 6.0, 10) × 10-5 mol/L.
| Δλ (nm) | T/(K) | Kq /(L/mol·s) | Ksv /(L/mol) | r1 | Ka /(L/mol) | n | r2 |
|---|---|---|---|---|---|---|---|
| 15 | 298 | 1.61 × 10¹² | 1.61 × 10⁴ | 0.9953 | 1.69 × 10⁴ | 0.98 | 0.9972 |
| 303 | 1.59 × 10¹² | 1.59 × 10⁴ | 0.9997 | 1.67 × 10⁴ | 0.93 | 0.9993 | |
| 310 | 1.56 × 10¹² | 1.56 × 10⁴ | 0.9936 | 1.58 × 10⁴ | 0.91 | 0.9968 | |
| 60 | 298 | 1.12 × 10¹² | 1.12 × 10⁴ | 0.9983 | 1.14 × 10⁴ | 1.03 | 0.9986 |
| 303 | 1.06 × 10¹² | 1.06 × 10⁴ | 0.9986 | 1.08 × 10⁴ | 0.95 | 0.9994 | |
| 310 | 8.62 × 10¹¹ | 8.62 × 10³ | 0.9956 | 9.93 × 10³ | 0.91 | 0.9970 |
Kq is the quenching rate constant; Ka is the binding constant; n is the number of binding site; r1 is the linear relative coefficient of F0/F∼ [L]; r2 is the linear relative coefficient of log (F0−F)/F∼log{[Dt]-n[Bt](F0−F)/F0}.
Table 2. Quenching reactive parameters of TRP-CFD system at different temperatures
Type of interaction force of TRP-CFD system
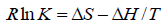
The type of interaction force of TRP-CFD systems can be gained through the thermodynamic parameters of reaction of CFD with TRP. If the temperature changes little, the value of ΔH is regarded as a constant. According to the values of Ka of TRPCFD system at different temperatures from Tables 1 and 2, the thermodynamic parameters can be calculated on the basis of equations (4) and (5):
 (4)
(4)
 (5)
(5)
The results were shown in Table 3. The negative value of ΔG clarified a spontaneous reaction between TRP and CFD. The negative value of ΔH and positive value of ΔS showed that CFD mainly bound to TRP by the electrostatic attraction [9]. As seen in Table 3, the conclusions drawn from the synchronous fluorescence method were consistent with the fluorescence quenching method, which suggested that synchronous fluorescence method could replace the fluorescence quenching method to determine the type of interaction force of TRP-CFD system.
| Variables | T /(K) | Ka /(L·mol-1) | ΔH /(KJ·mol-1) | ΔS/(J·mol-1·K-1) | ΔG/(KJ·mol-1) |
|---|---|---|---|---|---|
| λex=280 nm | 298 | 1.40 × 10⁴ | -8.08 | 52.22 | -23.64 |
| 303 | 1.35 × 10⁴ | 52.38 | -23.95 | ||
| 310 | 1.24 × 10⁴ | 52.23 | -24.27 | ||
| λex=295 nm | 298 | 1.14 × 10⁴ | -8.96 | 47.55 | -23.13 |
| 303 | 1.01 × 10⁴ | 47.10 | -23.23 | ||
| 310 | 9.85 × 10³ | 47.50 | -23.69 | ||
| Δλ=15 nm | 298 | 1.69 × 10⁴ | -4.41 | 66.11 | -24.11 |
| 303 | 1.67 × 10⁴ | 66.28 | -24.49 | ||
| 310 | 1.58 × 10⁴ | 66.13 | -24.91 | ||
| Δλ=60 nm | 298 | 1.14 × 10⁴ | -8.84 | 47.97 | -23.14 |
| 303 | 1.08 × 10⁴ | 48.04 | -23.39 | ||
| 310 | 9.93 × 10³ | 47.97 | -23.71 |
Table 3. The thermodynamic parameters of TRP-CFD system at different temperatures.
Hill's coefficient of TRP-CFD system
According to the Hill's coefficient of TRP-CFD system, we can make a quantitative analysis for cooperative binding between protein and ligands on the basis of the following equation [10]:
 (6)
(6)
Where Ka is the binding constant, Y is the fractional binding saturation, and nH is the Hill's coefficient. Hill's coefficient is greater than 1, which exhibits positive cooperativity and its role is enhanced with increasing nH. Conversely, Hill's coefficient is less than 1, which exhibits negative cooperativity and its role is enhanced by decreasing nH. A coefficient of 1 indicates non-cooperative reaction.
For fluorescence measurement:
 (7)
(7)
 (8)
(8)
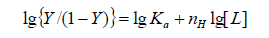
Where 1/Qm is intercept of the plot 1/Q versus 1/[L]. According to the equation (6), Hill's coefficient of TRP-CFD system can be gained from the slope of the plot of log[Y/ (1−Y)] versus log [L]. The results were presented in Table 4. We could see that the values of nH were both equal to 1 approximately at different temperatures by synchronous fluorescence method and fluorescence quenching method, which indicated that there was non-cooperative reaction between TRP and CFD. Meanwhile, it illustrated the synchronous fluorescence method could replace the fluorescence quenching method to determine the cooperative binding between CFD and TRP.
| T / (K) | λex = 280 nm | λex = 295 nm | Δλ=15 nm | Δλ=60 nm | ||||
|---|---|---|---|---|---|---|---|---|
| nH | r5 | nH | r5 | nH | r5 | nH | r5 | |
| 293 | 0.89 | 0.9969 | 0.936 | 0.9981 | 0.883 | 0.9988 | 0.949 | 0.9970 |
| 303 | 0.91 | 0.9905 | 0.918 | 0.9997 | 0.843 | 0.9963 | 0.914 | 0.9973 |
| 310 | 0.87 | 0.9908 | 0.874 | 0.9915 | 0.861 | 0.9944 | 0.86 | 0.9921 |
Table 4. Hill coefficient of TRP-CFD system at different temperatures.
Binding distances between TRP and CFD
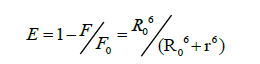
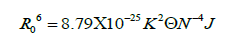
According to Förster's non-radiative energy transfer theory, the distance(r) between the donor and the acceptor, critical energy transfer distance R0 when the transfer efficiency is 50%, and the energy-transfer efficiency E can be calculated by the formulas:
 (9)
(9)
 (10)
(10)
 (11)
(11)
Where F0 is the fluorescence intensity of donor, F is the fluorescence intensity for the donor in presence of same concentration acceptor, K2 is the orientation factor, Φ is the fluorescence quantum yield of the donor in the absence of acceptor, N is a refractive index of the medium, F (λ) is the fluorescence intensity of the fluorescence donor at wavelength λ and ε (λ) is the molar absorption coefficient of the acceptor at this wavelength. Under these experimental conditions, it has been reported that K2=2/3, N =1.336 and Φ=0.118 [11]. J is the overlap integral between the fluorescence emission spectrum of the donor and the absorption spectrum of the acceptor. Thus J, E, R0 and r were calculated and shown in Table 5. As seen in Table 5, the donor-to-acceptor distance r<7 nm indicated that the energy transfer from TRP to CFD occurred with high possibility. The distance r increased and the energy efficiency E decreased with increasing temperature, which resulted in the reduced stability of the binary systems and the values of Ka. Moreover, the value of r was greater than R0 in this study which suggested that CFD could strongly quench the intrinsic fluorescence of TRP by a static quenching mechanism [12]. In addition, from Table 5, the data obtained using the synchronous fluorescence spectrometry (Δλ=60 nm) and fluorescence quenching method were basically consistent, and the conclusions also were the same. So we could take advantage of synchronous fluorescence (Δλ=60 nm) to calculate the combined distance of TRP-CFD system (Figure 6).

Figure 6: The UV absorbance spectra of CFD (1) and fluorescence emission spectra (2) and synchronous fluorescence spectra (Δλ=60 nm) (3) (T=298K); CCFD=CTRP=2.0 × 10⁻⁶ mol/L.
| System | λex = 280 nm | Δλ=60 nm | ||||||
|---|---|---|---|---|---|---|---|---|
| T/K | E (%) | J/(cm3·L·mol-1) | R0/nm | r/nm | E (%) | J/(cm3·L·mol-1) | R0/nm | r/nm |
| 298 | 2.96 | 7.76 × 10⁻¹⁶ | 1.60 | 2.86 | 3.62 | 7.58 × 10⁻¹⁶ | 1.59 | 2.76 |
| 310 | 1.92 | 7.02 × 10⁻¹⁶ | 1.57 | 3.03 | 2.83 | 6.88 × 10⁻¹⁶ | 1.56 | 2.83 |
| 318 | 1.58 | 6.45 × 10⁻¹⁶ | 1.55 | 3.09 | 2.17 | 5.72 × 10⁻¹⁶ | 1.52 | 2.87 |
Table 5. Binding parameters between TRP-CFD systems at different temperatures.
Conclusion
This paper studied the interaction mechanism between CFD and TRP, and compared the traditional fluorescence quenching method and synchronous fluorescence spectrometry. The results showed that the data of two methods were in the same order of magnitude, and were very close to each other. Additionally, the quenching mechanism and type of interaction force were consistent, which indicated that synchronous fluorescence spectrometry could study the binding mechanism between ligands and protein, and was a useful supplement to the conventional method. Moreover, synchronous fluorescence has some advantages such as good selectivity, high sensitivity, simplified spectrum, narrowed bands and less interference, which makes it more useful than conventional fluorescence quenching in studying the reaction mechanism of ligands with proteins.
Acknowledgement
The authors gratefully acknowledge the financial support of National Science Foundation of China (Grant no. 20675024) and Hebei University 2016 laboratory open project (Grant no. sy201658).
References
- Gombos L, Kardos J, Patthy A, et al. Probing conformational plasticity of the activation domain of trypsin: The role of glycine hinges. Biochemistry. 2008;47:1675-84.
- Ghosh S. Interaction of trypsin with sodium dodecyl sulfate in aqueous medium: A conformational view. Colloids Surf B Biointerfaces. 2008;66:178-86.
- Stroud RM, Kay LM, Dickerson RE. The structure of bovine trypsin: electron density maps of the inhibited enzyme at 5 Angstrom and at 2-7 Angstron resolution. J Mol Biol. 1974;83:185-208.
- Li H, Pu J, Wang Y, et al. Comparative study of the binding of Trypsin with bifendate and analogs by spectrofluorimetry. Spectrochim Acta A Mol Biomol Spectrosc. 2013;115:1-11.
- Wang YQ, Tan CY, Zhuang SL, et al. In vitro and in silico investigations of the binding interactions between chlorophenols and trypsin. J Hazard Mater. 2014;278:55-65.
- Toprak M, Arik M. The investigation of the interaction between orientin and bovine serum albumin by spectroscopic analysis. Luminescence. 2014;29:805-09.
- Venkateshrao S, Manoharan PT. Conformational changes monitored by fluorescence study on reconstituted hemoglobins. Spectrochim Acta A Mol Biomol Spectrosc. 2004;60:2523-26.
- Wang Q, Zhang SR, Ji X. Investigation of interaction of antibacterial drug sulfamethoxazole with human serum albumin by molecular modeling and multi-spectroscopic method. Spectrochim Acta A Mol Biomol Spectrosc. 2014;124:84-90.
- Ross PD, Subramanian S. Thermodynamics of protein association reactions: Forces contributing to stability. Biochemistry. 1981;20:3096-102.
- Bojko B, Su?kowska A, Maciazek-Jurczyk M, et al. The influence of dietary habits and pathological conditions on the binding of theophylline to serum albumin. J Pharm Biomed Anal. 2010;52:384-90.
- Bertucci C, Domenici E. Reversible and covalent binding of drugs to human serum albumin: methodological approaches and physiological relevance. Curr Med Chem. 2002;9:1463-81.
- Mandal P, Bardhan M, Ganguly T. A detailed spectroscopic study on the interaction of Rhodamine 6G with human hemoglobin. J Photochem Photobiol B. 2010;99:78-86.