Original Article
, Volume: 13( 6)Betalain Pigment Extraction from Malabar Spinach Fruit Using Ultrasound: Modeling and Validation
- *Correspondence:
- Karchiyappan T, Department of Chemical Engineering, State University of Maringá, Av. Colombo 5790, 87020-900, Maringá-PR, Brazil, Tel: +91-9843086090, E-mail: thirusambath5@gmail.com
Received: October 10, 2017; Accepted: December 23, 2017; Published: December 29, 2017
Citation: Karchiyappan T. Betalain Pigment Extraction from Malabar Spinach Fruit Using Ultrasound: Modeling and Validation. Environ Sci Ind J. 2017;13(6):158.
Abstract
Ultrasound assisted extraction process (UE) was employed to extract the betalain from Malabar spinach fruit using response surface methodology (RSM). Extraction process variables such as temperature, mass of the sample, extraction time was investigated using Box-Behnken design (BBD). Quadratic polynomial model was developed. Numerical optimization shows that sample mass of 9 g, temperature of 35°C and extraction time of 18 min, were yield maximum betalain. Under these conditions, 18 mg of betalain was extracted.
Keywords
Betalain; Ultrasound; Extraction; Malabar spinach fruit; Model development; Optimization; Validation
Introduction
Betalain is a class of natural pigments comprising yellow betaxanthins and betacyanins. The distribution of betalain in nature is limited to confined plant species of caryophylalles, red beet (Chenopodiaceae) and certain fungi such as fly-agaric mushroom (Amanita muscaria). Several edible sources of betalain are red and yellow beetroot (Beta vulgaris L. sp. vulgaris, Chenopodiaceae), coloured Swiss chard (Beta vulgaris L. sp. cicla, Chenopodiaceae), grain or leafy amaranth (Amaranthus sp., Amaranthaceae) and cactus fruits (Cactaceae) [1-3]. Among various plants, Basella rubra L. (Basellaceae) commonly known as Malabar spinach is a leafy vegetable which accumulates pigments in its fruits. Malabar spinach is a succulent, smooth, annual, climbing and herbaceous vine found in tropical and sub-tropical areas and one of the commonly consumed leafy vegetable. The fruit of Malabar spinach contains lot of betalain pigments. Hence, the interest of the Malabar spinach fruit processing industry in betalain has grown since they were identified as natural antioxidants, which may have positive health effects in humans.
A plenty numbers of research information are available on the extraction of betalain from various fruits such as solvent extraction [4], microwave [5], ultrasound assisted extraction (UE) and soxhlet [6,7]. Among these except UE, other methods show the low extraction efficiency, complex nature, higher extraction time and large capital [8]. Ultrasound-assisted extraction (UE) is a narrative and green extraction technique that can present high reproducibility, simplified exploitation, reduced solvent consumption and lower energy input without decreasing the extraction yield. Moreover, the optimization of process variables in UE process such as mass of the sample, temperature and extraction time may enhance the extraction efficiency [9].
The conventional optimization technique of changing one variable at a time to study the effects of process parameters on the response is time consuming and expensive, particularly for multivariable systems. Empirical design of experiment namely response surface methodology (RSM) is one of the statistical tools which mainly used to model and investigate the multivariable process in which a response is influenced by several process parameters [10]. The most common design under RSM is Behnken response surface design (BBD); it is well-organized and supple, providing adequate data on the effects of process variables and overall experiment error with reduced amount of experiments [11].
Hence, in this work an effort has been made to investigate the individual and interactive effect of ultrasound assisted extraction process (UE) parameters such as mass of the sample, temperature and extraction time on the betalain extraction from Malabar spinach fruit using RSM coupled BBD.
Materials and Methods
Raw materials and chemicals
Malabar spinach fruits were collected from Mysore, India. They were dried in the oven (hot air) at 40°C until it attains the constant weight. Then the dried samples were crushed and filtered through a 40-mesh sieve to get the samples in powdered form. The dried powder was stored in dark bags and kept in dry climate prior to conduct the experiments.
Extraction procedure
For the UE experiments, preferred weight of dried Malabar spinach fruit powder was assorted with a known amount of water (distilled) in a 600-ml beaker. Experiments were with ultrasound power of 100 W according to the standard method. During the extraction of betalain, temperature was controlled at a desired level within ± 1°C and the experiments were carried out according to Table 1. After the UE process, the homogenate was centrifuged at 6000 rpm for 10 min. The supernatant was collected as it is after centrifugation and the same was repeated for 2 more times to ensure maximum extraction of betalain. The supernatant was further used for determination of betalain.
| Level | -1 | 0 | 1 |
|---|---|---|---|
| Mass of sample (g) | 5 | 10 | 15 |
| Temperature (°C) | 25 | 35 | 45 |
| Extraction time (min) | 5 | 15 | 25 |
Table 1: Ranges of independent variables and their levels.
Analytical method
The extracted betalain was calculated as follows [12]:
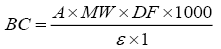 (1)
(1)
where, A is the absorbance; MW is the molecular weight; DF is the dilution factor; ? is the molar absorptivity and 1 is path length.
Modeling procedure
Design-Expert 8.0.7.1 (State-Ease Inc., Minneapolis, MN, USA) statistical package was employed for modeling and optimization of ultrasound extraction process with independent variables namely mass of the sample (A), temperature (B) and extraction time (C). Box-Behnken design (BBD) was employed to evaluate the betalain content (mg) with respect to process variables. Seventeen experiments were designed with five replications by BBD. The correlation between the response and independent variables were evaluated by mathematical model and the generalized form of equation was given below [13]:
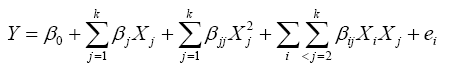 (2)
(2)
Later, developed mathematical model was used to plot the three-dimensional response surface contour plots. Validation of developed model was carried out by plotting actual versus predicted graph and ANOVA analysis. Finally, numerical optimization method was used to optimize the extraction process variables for the maximum betalain from Malabar spinach fruit.
Results and Discussion
BBD modeling
The BBD design with results of RSM experiments including as mass of the sample (A), temperature (B) and extraction time (C) were shown in Table 2. This experimental data was fitted to the various models (linear, interactive (2FI), quadratic and cubic) to obtain second order polynomial model. Sequential model sum of squares (Table 3) and model summary statistics (Table 4) were examined to find out the model fitness. They indicate, linear and interactive (2FI) models were shown lower R2, adjusted R2, predicted R2 when compared with second order polynomial model. Cubic model was found to be not fitted. Hence, the quadratic model incorporating linear, interactive and quadratic terms was chosen to describe the effects of process variables on the extraction of betalain. Developed second-order polynomial equation as follows:
| S.No | A | B | C | Betalain (mg) |
|---|---|---|---|---|
| 1 | 10 | 35 | 15 | 18.58 |
| 2 | 10 | 35 | 15 | 18.81 |
| 3 | 10 | 35 | 15 | 18.81 |
| 4 | 15 | 35 | 5 | 15.54 |
| 5 | 15 | 25 | 15 | 13.47 |
| 6 | 5 | 35 | 25 | 17.39 |
| 7 | 10 | 45 | 25 | 16.69 |
| 8 | 15 | 35 | 25 | 14.88 |
| 9 | 10 | 25 | 5 | 16.39 |
| 10 | 10 | 35 | 15 | 18.81 |
| 11 | 5 | 35 | 5 | 14.43 |
| 12 | 10 | 35 | 15 | 18.55 |
| 13 | 10 | 25 | 25 | 17.39 |
| 14 | 5 | 25 | 15 | 17.37 |
| 15 | 5 | 45 | 15 | 14.13 |
| 16 | 15 | 45 | 15 | 17.58 |
| 17 | 10 | 45 | 5 | 17.07 |
Table 2: BBD and their experimental results.
| Source | Sum of squares | Df | Mean square | F Value | Prob>F | Remarks |
|---|---|---|---|---|---|---|
| Betalain (mg) | ||||||
| Mean | 4807.83 | 1.00 | 4807.83 | |||
| Linear | 1.58 | 3.00 | 0.53 | 0.14 | 0.9319 | |
| 2FI | 17.26 | 3.00 | 5.75 | 1.89 | 0.1958 | |
| Quadratic | 29.86 | 3.00 | 9.95 | 109.35 | <0.0001 | Suggested |
| Cubic | 0.56 | 3.00 | 0.19 | 10.39 | 0.0233 | Alised |
| Residual | 0.07 | 4.00 | 0.02 | |||
| Total | 4857.17 | 17.00 | 285.72 | |||
Table 3: Sequential model sum of squares for response.
| >Model | >Model summary statistics | |||||
|---|---|---|---|---|---|---|
| >Std.Dev. | >R2 | >Adjusted R2 | >Predicted R2 | >PRESS | >Remarks | |
| Betalain (mg) | ||||||
| >Linear | >1.9166 | >0.0321 | >-0.1913 | >-0.6737 | >82.6 | |
| >2FI | >1.7463 | >0.3819 | >0.0110 | >-0.7110 | >84.4 | |
| >Quadratic | >0.3017 | >0.9871 | >0.9705 | >0.8146 | >9.1473 | >Suggested |
| >Cubic | >0.1346 | >0.9985 | >0.9941 | >+ | >Aliased | |
Table 4: Model summary statistics for response.
 (3)
(3)
Statistical analysis of the developed mathematical model was evaluated using ANOVA. The ANOVA for the model is shown in Table 5. The second order polynomial model shows that R2=0.97, which ensure that 97% of the variations can explained by the model. Adj-R2 should be close to R2 for good model, as shown in Table 5, adj-R2 was greater than 0.95, which implied that only less 5.0% of the total variations, were not explained by the developed model. A low value of CV indicated a good reliability of the experiments values. From the results, it is found that the developed model shows high F-value and low p-value, which indicates the ability of developed mathematical model. Also, the adequacy of model to represent the UE process was examined by constructing diagnostic plot namely predicted versus actual plot (Figure 1). The plot points lie very close to the diagonal line confirms the good relationship between experimental and predicted values [14].
| Source | Response | |||||
|---|---|---|---|---|---|---|
| Sum of squares | df | Mean square | F value | P value | Remarks | |
| Model | 48.7004 | 9 | 5.41116 | 59.4535 | <0.0001 | Significant |
| A | 0.42781 | 1 | 0.42781 | 4.70046 | 0.0668 | |
| B | 0.09031 | 1 | 0.09031 | 0.99228 | 0.3524 | |
| C | 1.0658 | 1 | 1.0658 | 11.7102 | 0.0111 | |
| AB | 13.5056 | 1 | 13.5056 | 148.389 | <0.0001 | |
| AC | 3.2761 | 1 | 3.2761 | 35.9952 | 0.0005 | |
| BC | 0.4761 | 1 | 0.4761 | 5.23101 | 0.0560 | |
| A2 | 20.3743 | 1 | 20.3743 | 223.857 | <0.0001 | |
| B2 | 3.22184 | 1 | 3.22184 | 35.399 | 0.0006 | |
| C2 | 3.81802 | 1 | 3.81802 | 41.9494 | 0.0003 | |
| CV% | 6.48 | |||||
| AP | 29.54 | |||||
Table 5: ANOVA table for response.

Figure 1: Model adequacy plot.
Effect of process variables on the betalain content
The relationship between extraction process parameters and response (Betalin) was described by the plotting the surface contours plots generated by the second order polynomial model (Figure 2). In this study, the model has more than two factors. So, the plots are drawn by maintaining one factor at a constant level (in turn at its central level), whereas the other two factors were varied in their range.

Figure 2: 3D plots for UE process.
Effect of mass of sample: The UE process is greatly affected by mass of sample, because it is acting a crucial role in extraction of betalain. In order to evaluate the effect of its effect, experiments were carried at different mass of sample and the results are shown in Figure 2. From the Figure 2A-2C, it is observed that the betalain is increased with increasing mass of sample.
This is due to the fact that increase in mass of sample increases the larger surface area to the UE process and increases the extraction of betalain from Malabar spinach fruit [15].
Effect of temperature: The temperature is one of the key parameter in UE process, which influences the extraction efficiency significantly. To determine its effect, the experiments were done in various temperature and the results were shown in Figure 2. From the Figure 2A-2B, it is confirmed that betalain is increased with increasing temperature up to 35°C. Beyond this temperature shows insignificant effect on the extraction of betalain from Malabar spinach fruit using UE technique [16].
Effect of extraction time: The extraction time is a primary factor to calculate the efficiency of UE process to extract the betalain. In order to find out its effect, experiments were carried out at various extraction time and the results are depicted in Figure 2. From the results (Figure 2B-2C), it is found that the betalain is increased with increasing extraction time up to 15 min. This phenomenon due to an initial stages ultrasound irradiation promoted the thermal accumulation, which leads to the effective extraction of betalain [17,18]. Thereafter, there is a negligible effect of extraction time on UE process. Figure 3 also confirms the effect of extraction process variables on extraction of betalain.

Figure 3: Perturbation plot for UE process.
Optimization of UE process parameters for betalain extraction: According to the BBD results, the optimal extraction conditions to obtain maximum betalain content from Malabar spinach fruit were determined by Derringer’s desired function methodology [19] as follows; mass of the sample of 9 g, temperature of 35°C and extraction time of 18 min. Under these conditions, 18 mg of betalain was extracted, which is confirmed by real experiment [20].
Conclusion
RSM coupled with BBD were applied to model the UE process for extraction betalain from Malabar spinach fruit. Second order polynomial mathematical model was developed with good coefficient of determination values (R2>0.95) and analysis of variance (ANOVA) showed the significant effect of each process variables on extraction of betalain. Optimum conditions for this UE process were found to be; mass of the sample of 9 g, temperature of 35°C and extraction time of 18 min. Under these conditions, 18 mg of betalain was extracted. This result confirms the ability of UE process as an effective extraction technique to extract betalain from Malabar spinach fruit.
References
- Kumar SS, Manoj P, Shetty NP, et al. Characterization of major betalain pigments-gomphrenin, betanin and isobetanin from Basellarubra L. fruit and evaluation of efficacy as a natural colourant in product (ice cream) development. J Food Sci Technol. 2014;52(8):4994-5002.
- Anusuya N, Gomathi R, Manian S, et al. Evaluation of Basellarubra L., RumexnepalensisSpreng and Commelinabenghalensis L. for antioxidant activity. Int J Pharm Pharm Sci. 2012;4(3):714-20.
- Khan MI, Sri Harsha PSC, Giridhar P, et al. Pigment identification, nutritional composition, bioactivity and in vitro cancer cell cytotoxicity of Rivinahumilis L. berries, potential source of betalains. LWT-Food Sci Technol. 2012;47(2):315-23.
- VahidiE, Zhao F. Environmental life cycle assessment on the separation of rare earth oxides through solvent extraction. J Environ Manage. 2017;203(1):255-63.
- Vinatoru M, TMason TJ, Calinescu I. Ultrasonically assisted extraction (UAE) and microwave assisted extraction (MAE) of functional compounds from plant materials. Trends Analyt Chem. 2017;97:159-78.
- Subramanian R, SubbramaniyanP, NoorulAmeen J, et al. Double bypasses soxhlet apparatus for extraction of piperine from Piper nigrum. Arabian J Chem. 2016;9(1):S537-S540.
- Oliveira R, Oliveira V, KK-Rodrigues A. Effects of the extraction conditions on the yield and composition of rice bran oil extracted with ethanol-A response surface approach. Food and Bio-products Processing. 2012;90(1):22-31.
- Koocheki A, Taherian AR, Razavi S-Bostan A. Response surface methodology for optimization of extraction yield, viscosity, hue and emulsion stability of mucilage extracted from Lepidiumperfoliatum seeds. Food Hydrocoll. 2009;23(8):2369-79.
- Diwaniyan S, Sharma KK-Kuhad RC. Laccase from an alkali tolerant basidiomycetesCrinipellis sp.RCK-1: Production optimization by response surface methodology. J Basic Microbiol. 2012;52(4):397-407.
- ElMekawy A, El-Baz A, Soliman E, et al. Statistical modeling and optimization of chitosan production from Absidiacoerulea using response surface methodology. CurrBiotechnol. 2013;2(2):125-33.
- Chan YH, Yusup S, Armando T,et al. Fractionation of pyrolysis oil via supercritical carbon dioxide extraction: Optimization study using response surface methodology (RSM). Biomass Bioenergy. 2017;107:155-63.
- Anuar N, Mohd Adnan AF, Saat N, et al. Optimization of extraction parameters by using response surface methodology, purification and identification of anthocyanin pigments in Melastomamalabathricumfruit. Int J BiolMacromol. 2014;66:113-24.
- Rajkumar K, Muthukumar M. Optimization of electro-oxidation process for the treatment of Reactive Orange 107 using response surface methodology. Environ SciPollut Res. 2012;19(1):148-60.
- Rodriguez-Gonzalez V, Femenia A, Minjares-Fuentes R, et al. Functional properties of pasteurized samples of Aloe barbadensis Miller: Optimization using response surface methodology. LWT-FoodSciTechnol. 2012;47(2):225-32.
- Merabet S, Robert D, WeberJV, et al. Photocatalytic degradation of indole in UV/TiO2: Optimization and modeling using the response surface methodology (RSM). Environ ChemLett. 2009;7(1):45-9.
- Sinha K, Saha PD, Datta S. Extraction of natural dye from petals of Flame of forest (Buteamonosperma) flower: Process optimization using response surface methodology (RSM). Dyes Pigm. 2012;94(2):212-6.
- Quanhong L, Caili F. Application of response surface methodology for extraction optimization of germinant pumpkin seeds protein. Food Chem. 2005;92(4):701-6.
- Ravikumar K, Krishnan S, Ramalingam S, et al. Optimization of process variables by the application of response surface methodology for dye removal using a novel adsorbent. Dyes and Pigments.2007;72(1):66-74.
- Cai YZ, Sun M, Corke H. Characterization and application of betalain pigments from plants of the Amaranthaceae. Trends Food Sci Technol. 2005;16(9):370-6.
- Gomes T, Barradas C, Dias T, et al. Optimization of mead production using response surface methodology. Food ChemToxicol. 2013;59:680-6.

