Original Article
, Volume: 12( 2)Batch and Column Studies for Phenol Removal from Aqueous Solutions using Laboratory prepared Low-Cost Activated Carbon as an Adsorbent
- *Correspondence:
- Arvind Kumar, Department of Chemical Engineering, National Institute of Technology, Rourkela-769008, Odisha, India, Tel: +91661246 2268; Fax: +91 661 247 2999; E-mail: arvindkumar@nitrkl.ac.in
Received: August 8, 2017; Accepted: September 8, 2017; Published: September 12, 2017
Citation: Lallan SY, Bijay KM, Arvind K. Batch and Column Studies for Phenol Removal from Aqueous Solutions using Laboratory prepared Low-Cost Activated Carbon as an Adsorbent. Chem Technol Ind J. 2017;12(2):114
Abstract
The removal of phenol was studied using laboratory prepared activated carbons namely crab eye activated carbon (CEAC) using as a precursor crab eye (Abrus Precatorios) in a batch and column process. The effects of various parameters such as adsorbent dose, pH and temperature and contact time were investigated. Five kinetic models (pseudo-first-order, pseudo-second-order, intraparticle diffusion, Elovich and Bangham models) were tested to fit the experimental data. Among them Pseudo-second-order kinetic model was found to best fit representing the adsorption kinetic data. The Freundlich, Langmuir, Tempkin and Redlich-Peterson isotherm models were fitted to the experimental data of phenol adsorption. The different thermodynamic parameters such Gibbs free energy, enthalpy and entropy have also been estimated. The effects of important factors namely the flow rate (5 ml/min-15 ml/min), bed height (15 cm–25 cm) and influent concentration of phenol (50–15 mg/l) were studied in continuous fixed-bed adsorption for the removal of phenol from aqueous solution in crab eye activated carbon bed. Thomas, Adams-Bohart and Yoon-Nelson kinetics models were tested to experimental data for the prediction of the breakthrough point and to determine the characteristic parameters of the column.
Keywords
Adsorption; phenol; Crab eye activated carbon; Kinetics; Isotherm; Column study
Introduction
Phenol is frequently encountered in wastewater from various sources [1]. Phenol is considered as a priority pollutants due to its toxicity to organism [2]. Table 1 shows the concentration of phenol in various industrial effluents. The ingestion of 1 g of phenol may cause fatality to human [3]. The presence of phenol in wastewater causes adverse impacts on environmental health [4]. Therefore, several environmental regulating agencies of the world have set maximum permissible limit (Table 2) for phenol discharge into various water bodies [5-13]. Several conventional chemical, physical and biological methods have been established for the treatment of phenolic wastewater [11]. Adsorption of environmental pollutants from wastewaters onto activated carbon is still considered to be the best option due to several reasons [12,14-15]. However, use of activated carbon as an adsorbent presents several disadvantages [1,16-20]. During past decade, several low-cost renewable materials have been used as an activated carbon after altering their surface characteristic for use in the treatment of wastewater. These low cost adsorbents have been made from lignocellulosic materials such as agricultural waste materials, industrial waste and plant residues [20].
| Industries | Concentrations (mg/l) |
|---|---|
| Oil refineries | 6-500 |
| Coking operations | 28-3900 |
| Coal processing | 9-6800 |
| Petrochemicals | 2.8-1220 |
| pharmaceutical, plastics, wood products, paint and pulp and paper industries | 0.1-1600 |
Table 1: Phenol concentrations in industrial effluents.
| Agency | Type of water | Maximum permissible limit |
|---|---|---|
| USEPA | Surface water | <0.1 ppb |
| BIS | Drinking water | 1.0 ppb |
| WHO | Drinking water | 1.0 ppb |
| MoEF | Industrial effluent | 1.0 ppm |
| Italy | Potable and mineral waters | 0.5 ppb |
| Surface waters | 0.5 ppm | |
| Sewerage system | 1 ppm |
Table 2: Maximum permissible limits of phenol in water.
This paper first time reports usage of crab eye activated carbon (CEAC) prepared from crab eye seeds as a precursor for the adsorption of phenol from aqueous solutions using batch and fixed bed operations. Several experimental factors which affect the removal of phenol such as adsorbate-adsorbent contact time, initial solution pH, adsorbent dosage, adsorbate concentration and adsorption temperature were optimized. The effects of parameters as flow rate, initial phenol concentration and bed height on the breakthrough curves were investigated. The maximum sorption capacity of CEAC onto phenol was also determined using Thomas model.
Materials and Methods
Preparation of activated carbon
The high carbon content, cost and availability of raw materials are the some of the important criteria for their selection [21]. In the present work, new adsorbent has been explored that has good adsorption capacity as compare to the commercial grade activated carbon. The raw material (Figure 1a) for the development of activated carbon was obtained from the campus of National Institute of Technology (NIT), Rourkela.

Figure 1a: Photograph of (a) raw crab eye.
The tubular reactor (rectangular horizontal furnace having crossectional area 3 × 3 in square and length 30) was used for the production of activated carbon. The precursor sample was pyrolyzed at 750 K for 5 h under the N2 atmosphere. The sufficient amount of carbonized material was treated with saturated solution of NaOH for activation. In some cases the alkali treatment has increased adsorption capacity [22-24]. However, various researchers have used others chemical agent also for activation of biomass such as formaldehyde [25], sodium hydroxide [23,24, 26-28], washing with cold or hot water [24,26,28], with sulfuric acid [29], phosphorus (V) oxychloride [30], ac tivation of corn cobs using potassium hydroxide [31] etc for the surface modification of adsorbent. The sample was then dried in an oven at temperature of 115°C for 8 h. This mixture was then heated to 450°C–650°C for 2–3 h in a nitrogen atmosphere in the horizontal furnace with a heating rate of 5°C/min. The material was taken out from the furnace and allowed to cool to ambient conditions. After chemical activation, the final products were washed with double distillated water (DDW) to remove chemicals from the final products and to reach the pH=6-7 of the residual solution. All the water soluble impurities were removed by washing with DDW [32-33]. Immediately after washing, the sample was dried in the oven at the temperature of 110°C for 120 min. Activated carbon thus prepared was named as crab eye activated carbon (CEAC) and was preserved for end use (Figure 1b). The physico-chemical characterizations (Table 3) of CEAC were done using standard methods [34-36].

Figure 1b: Photograph of (b) carbonized crab eye.
| Characteristics | CEAC |
|---|---|
| Proximate analysis | |
| Moisture (%) | 1.91 |
| Volatile matter (%) | 33.33 |
| Ash (%) | 8.66 |
| Fixed Carbon (%) | 58.01 |
| Bulk density (kg/m3) | 0.7701 |
| Dry density | 0.7610 |
| Porosity | 0.2286 |
| Specific gravity | 0.9864 |
| Void ratio | 0.1660 |
| Heating value (cal./g) | 5929 |
| Average particle size (μm) | 478.73 |
| Chemical analysis of ash | |
| Insoluble (%) | 65.17 |
| SiO2 (%) | 12.6 |
| Fe2O3& Al2O3 (%) | 3.38 |
| CaO (%) | 17.4 |
| MgO (%) | 0.96 |
| Others | 0.49 |
| Ultimate analysis of adsorbents | |
| Carbon (%) | 60.77 |
| Hydrogen (%) | 3.53 |
| Nitrogen (%) | 4.08 |
| Sulfur (%) | 1.20 |
| EDX Analysis | |
| Carbon | 51.61 |
| Nitrogen | 23.84 |
| Oxygen | 21.15 |
| Magnesium | - |
| Phosphorus | 2.15 |
| Sulfur | 0.01 |
| Potassium | - |
| Calcium | - |
| Surface area of pores (m2/g) | |
| (i) BET | 265 |
| (ii) BJH (adsorption/desorption) | 121/84 |
| BJH cumulative pore volume (cm3/g) | |
| (i) Single point total | 0.0388 |
| (ii) BJH adsorption | 0.0386 |
| (iii) BJH desorption | 0.0352 |
| Average pore diameter (?) | |
| (i) BET | 34.66 |
| (ii) BJH adsorption | 43.27 |
| (iii) BJH desorption | 58.34 |
| Iodine No. | 315 |
| Methylene blue No. | 150 |
| Boehm Titration | |
| Surface acidity (mmol/g) | 6.53 |
| Surface alkalinity (mmol/g) | 3.00 |
Table 3: Physico-chemical characteristics of adsorbent.
Preparation of adsorbate stock solutions and analytical measurement
The stock solutions of phenol concentration 1000 mg/L were prepared by dissolving appropriate amount of phenol in distilled water. Desired concentrations were prepared from the respective stock solutions, making fresh dilutions for each adsorption study. The concentration of phenol was determined by measuring the absorbance of the aqueous solution at λmax=470 nm using a UV/vis spectrophotometer. The calibration plot of absorbance vs. concentration for phenol showed a linear variation up to a phenol concentration of 50 mg/l. Because the value of Co was kept between 25 and 150 mg/l, the samples were subsequently diluted with distilled water, whenever necessary, so that the phenol concentrations of the samples could be determined accurately using the linear portion of the calibration curve.
Point of zero charge and surface groups quantification
The pH at which the surface charge of adsorbent is zero, is called the point of zero charge (PZC). The surface is positively charged at pH<pHPZC and negatively charged at pH>pHPZC [37-39]. The PZC of CEAC was determined to be 6.25 as per the method presented [40]. Surface groups (acidic and basic) present on the adsorbent surfaces (Table 3) was determined using Boehm titration [41].
Adsorption studies
In the batch adsorption study, the q=(%R x Co)/(100 × m) was used to determine the uptake capacity of phenol. Where, Co is the initial concentration of phenol, m is mass of adsorbent and %R is the percentage phenol removal. Phenol adsorption rate onto the adsorbent was determined by analyzing residual phenol after different contact intervals of 15 min to 360 min. The concentrations of adsorbent were varied between 0.2 to 7 g/l to determine the optimum dosages. To elucidate the effect of pH on phenol adsorption, the initial pH of phenol solution was varied in the range of 2–12 using 0.1 M HCl or 0.1 M NaOH. The effect of temperature on phenol adsorption on adsorbent was also studied in the range of 303K-333 K. For the fixed bed column study of phenol onto CEAC, the experiments were carried out in plexiglass column of 25 cm length having inside diameter (2 cm). Schematic diagram of experimental set up is shown in Figure 2. The column was provided with a feed port at the bottom centre of the column.

Figure 2: Experimental set up for column study.
Results and Discussion
Characterization of CEAC
The nitrogen adsorption-desorption isotherm and pore size distributions of the CEAC is shown in Figure 3 and 4, respectively. BJH method is the most popular method used for the evaluation of the mesoporous structure of the CEAC. Pore sizes are classified in accordance with the classification adopted by the International Union of Pure and Applied Chemistry (IUPAC) [42], that is, micro-pores (diameter (d)<20 Å), meso-pores (20 Å<d<500 Å) and macro-pores (d>500 Å). Micro-pores can be divided into ultra micro-pores (d<7 Å) and super micro-pores (7 Å<d<20 Å). Because of the larger sizes of liquid molecules, the adsorbent for liquid phase adsorbates should have predominantly mesoporous in the structure [43].

Figure 3: Nitrogen adsorption-desorption isotherm for CEAC.

Figure 4: BJH Pore size distribution for CEAC.
Pore size distributions of CEAC results are given in Table 3. The determination of specific surface areas (SSA) (m2/g) of CEAC was calculated using the BET equation as proposed in 1938 [44]. The determination of SSA was done using N2 as adsorptive by estimating the volume of the adsorbed monolayer. As shown in Figure 5, the plot 1/[Q (po/p-1)] vs. (po/p) provide straight lines at low pressure range, usually 0.05<(P/Po)<0.25, depending on the sample. While the Langmuir specific surface area of the CEAC was estimated by plotting p/Q vs. pressure as shown in Figure 6. The BET surface area of CEAC was 265 m2/g.

Figure 5: BET specific surface areas of CEAC.

Figure 6: Langmuir surface areas of the adsorbents.
Effect of adsorbent concentrations
To find out the optimum dosage of adsorbents, the adsorbent concentrations were varied from 0.2 to 7 g/l at fixed initial phenol concentration of 100 mg/l (Figure 7). It was observed that on increasing the adsorbent dosage the uptake capacity of phenol decreases, while the %R increases because m is inversely proportional to the uptake capacity. The point where these two curves cut together is regarded as optimum adsorbent dosage, which was found to be 0.4 for CEAC. Beyond this dosage, there is limited availability of adsorption sites and do not contribute much for further removal of phenol. Various authors have been reported similar finding for phenol adsorption onto activated carbon prepared from various materials [2,18,45].

Figure 7: Effect of adsorbents dosage on the removal of phenol CEAC (Co =100 mg/l, pHo=6, T =303 K, t =5 h).
Effect of pH
pH of the solution is key factor and play very important role for the removal of pollutants from waste stream. Adsorption of phenol by CEAC (0.4 g/L) was studied in the pH range of 2-12 (Figure 8). Phenol removal was maximum and constant for pH ≤ 8. Further, increase in pH (>8) lead to decrease in phenol removal. This decrease in phenol removal with increase in pH can be explained based on the point of charge. As explained in section 2.3, the surface of CEAC at higher pH became negatively charged and therefore repelled C6H5O- ions because of which the adsorption of phenol got reduced [37,39,49]. Thus, pH=8 was taken as an optimum pH for phenol-CEAC system.

Figure 8: Effect of initial pH on the equilibrium uptake of phenol(Co=100 mg/l, m=0.4 g/l for CEAC T=303 K, t=5h).
Effect of contact time and initial concentrations
To find out the optimum contact time for maximum adsorption of phenol onto adsorbent, experiments were done for varying time periods between 5 min and 360 min at optimum pH and dosage by fixing the phenol concentration in solution to 100 mg/l (Figure 9). The adsorption rate for phenol was initially very fast, such that adsorption of ~12-30 mg/g was observed within the first 15 min of phenol–adsorbent contact time. After that, adsorption rate slowed down due the competition among C6H5OH2+ to grab the remaining available adsorption sites. Adsorption equilibrium was achieved after 5 h resulting in more than ~28-43 mg/g removal of phenol, indicating the saturation of available adsorption sites. Hence, 2 h were taken as optimum contact time for phenol-CEAC system.

Figure 9: Effect of contact time and initial concentrations on the removal of phenol onto CEAC(Co=50-150 mg/l, m=0.4 g/l,pHo=8, T=303 K).
The batch experiments were conducted to elucidate the effect of Co on the adsorption of phenol onto CEAC. It was observed that the uptake of phenol increases with an increase in Co . The increase in adsorption uptake with an increase in Co is attributed to an increase in the driving force for adsorption and a decrease in resistance to the uptake of phenol by the adsorbent from the solution [50].
Adsorption kinetic study
Several kinetic models (Table 4) have been used in the present study to investigate the adsorption process of phenol. The details of all these kinetic models are presented elsewhere [50-52]. Pseudo-first and second-order equations have been solved by using non-linear technique and ks and qe were obtained. Figure 9, shows a representative plot of qt vs. t (experimental and calculated) for adsorption of phenol onto CEAC for Co =50-150 mg/l at the optimum dosage, pH and temperature. The bestfit values of h , qe and kS along with the correlation coefficients for the pseudo-first-order and pseudo-second-order models are given in Table 4. The qe,exp and qe,cal values (Table 4) from the pseudo-second-order kinetic model are very close to each other. The calculated correlation coefficients are equal to unity for pseudo-second-order kinetics than that for the pseudo first-order kinetic model. Therefore, the sorption of phenol can be approximated more appropriately by pseudo-second-order kinetic model than the other kinetic models for the adsorption.
Pseudo-first-order:  kf=1st order adsorption rate constant qe=equilibrium uptake |
||||
|---|---|---|---|---|
| Concentration (mg/l) | 50 mg/l | 75 mg/l | 100 mg/l | 150 mg/l |
| qe,exp(mg/g) | 12.16 | 21.34 | 28.87 | 32.96 |
| qe,calc(mg/g) | 10.91 | 21.10 | 25.83 | 32.64 |
| kf (min-1) | 0.0185 | 0.0196 | 0.0186 | 0.0170 |
| R2 | 0.9751 | 0.9965 | 0.9719 | 0.9679 |
| MPSD | 15.38 | 7.77 | 16.02 | 27.87 |
Pseudo-second-order:  ks=2nd order rate constant |
||||
| qe,calc (mg/g) | 14.20 | 25.51 | 33.90 | 35.64 |
| h (mg/g. min) | 0.2357 | 0.4769 | 0.5574 | 0.9968 |
| ks(g/mg. min) | 0.0012 | 0.0007 | 0.0005 | 0.0008 |
| R2 | 0.9902 | 0.9812 | 0.9888 | 0.9676 |
| MPSD | 11.46 | 14.59 | 12.18 | 20.03 |
Intra particle diffusion:  kint=intra-particle diffusion rate constant (mg g-1 min0.5) C=boundary layer effect |
||||
| kint1(mg/g. min1/2) | 0.7545 | 0.9604 | 1.2956 | 7.3305 |
| C1(mg/g) | 24.49 | 46.44 | 63.61 | 41.90 |
| R2 | 0.6246 | 0.739 | 0.6909 | 0.9622 |
| kint2 (mg/g. min1/2) | - | - | - | 0.2394 |
| C2 (mg/g) | - | - | - | 104.86 |
| R2 | - | - | - | 0.8237 |
Elovich:  a=initial rate (mg/g.min) b=parameter (g/mg) related to the extent of surface coverage and activation energy |
||||
| b (g/mg) | 0.216 | 0.193 | 0.141 | 0.082 |
| a (mg/g. min) | 83.91 | 3283 | 4480 | 400 |
| R2 | 0.8218 | 0.8908 | 0.8543 | 0.9006 |
Bangham: 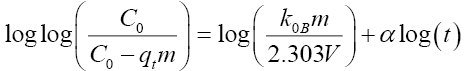 (<1) and are constants |
||||
| α | 0.30 | 0.81 | 0.20 | 0.25 |
| ko | 11.075 | 13.50 | 20.72 | 13.59 |
| R2 | 0.911 | 0.965 | 0.967 | 0.965 |
Table 4: Kinetics parameters constants for pseudo-first-order, pseudo-second-order, intraparticle diffusion, Elovich and Bangham models.
If the Weber-Morris plot of qt vs. t0.5 does not satisfies the linear relationship with the experimental data, then the sorption process is not found be controlled by intra-particle diffusion. However, if the data exhibit multi-linear plots, then two or more steps influence the sorption process. The constants of Elovich equation are determined from the plot of qt vs. ln t. All the constants of Elovich are given in Table 4.
Since, the plot of  plot for phenol adsorption onto CEAC for Co =50-150 mg/l at 303 K and at optimum pH, did not yield linear curves and the values of R2≠1. This shows that the diffusion of phenol into the pores of adsorbents is not the only rate-controlling [53].
Adsorption diffusion and mass transfer study
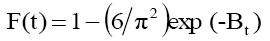
In order to estimate whether the sorption process is rate limiting step mean either pore diffusion or surface diffusion or external mass transfer means boundary layer diffusion. The kinetic data as obtained by conducting batch experiments have been tested by the model given by Boyd [54]:
 (1)
(1)
and
 (2)
(2)
Where qt and qe are the amount of phenol adsorb at any time t and equilibrium (mg/g). F(t) is fractional amount of phenol adsorb and Bt is a function of F (t).
Substituting eqn. 1 in eqn. 2, it simplifies to:
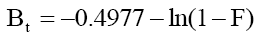 (3)
(3)
The fitting of data plot (linear lines) Bt vs. t (min) for all phenol initial concentrations did not pass through the origin (Figure 10) indicating that the adsorption of phenol onto adsorbents was mainly due to external mass transport where particle diffusion (exterior surface of the adsorbent) was the rate limiting step [55].

Figure 10: Boyd plot for the removal of phenol by CEAC(Co=50-150 mg/l, t=5h; m=0.4 g/l,pHo=8).
The Bt values were also used to calculate the effective diffusivity, De (cm2/s) using the relation [56]:
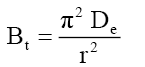 (4)
(4)
Where, r represents the particle radius estimated by sieve analysis by assuming as spherical particles. The value of average effective diffusion coefficient De =5.84 x 10⁻¹³ m2/s was determined for Co =50-150 mg/l using eqn. (3).
A mass transfer phenomenon was studied with the help of following equation,
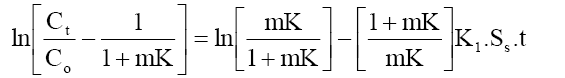 (5)
(5)
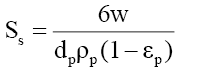 (6)
(6)
Where, Co and Ct are the initial phenol concentration (mg/L) and concentration at time of t of the adsorbate respectively; m (g/L) is the mass of adsorbent. K (L/g) is the Langmuir constant, K1 (cm/s) is the mass transfer coefficient and Ss (L/cm) is the outer surface of the adsorbent per unit volume. According to above equation, surface mass transfer is controlling when tends to zero. A plot of  vs. t results in a straight line (Figure 11). The value of K1 =1.02×10-7,0.483×10-7 and 0.316×10⁻⁷ cm/s were obtained at temperature 303, 313 and 323 K, respectively for Co =100 mg/l from slope and intercept of the straight line indicating that the transfer of phenol from bulk of the liquid to adsorbent surface is very rapid and the adsorbent is suitable for removal of phenol from aqueous solution. Similar finding related to determination of mass transfer coefficient has been reported earlier [57].

Figure 11: Mass transfer plot for adsorption of phenol onto CEAC system (Co=100 mg/I, t=5h; w=0.4 g/l,pHo=8).
Adsorption equilibrium studies
The most appropriate equilibrium isotherm equation needs to be established to optimize the design of an adsorption system for the removal of adsorbates, which represents the experimental equilibrium sorption data. Several isotherm equations are available. The Freundlich and Langmuir isotherm equations have been used extensively to represent the equilibrium adsorption data obtained from activated carbon–organic contaminants systems, despite the fact that these equations have serious limitations on their usage [58-59]. Temkin isotherm equation contains a factor that explicitly takes into account the interactions between adsorbing species and the adsorbate. This isotherm assumes that (i) the heat of adsorption of all the molecules in the layer decreases linearly with coverage due to adsorbate–adsorbate interactions and (ii) adsorption is characterized by a uniform distribution of binding energies, up to some maximum binding energy [60]. The Redlich–Peterson (R–P), a three-parameter-equation is often used for sorption data on heterogeneous surfaces and can be reduces to Freundlich equation at high concentrations and to Henry’s equation at very low concentrations [61].
Langmuir, Freundlich, Tempkin and Redlich-Peterson adsorption isotherms were tested for their fitness (Figure 12) over temperature range of 303 K-333 K. Calculated constants of all the isotherms and their corresponding non-linear regression coefficients at various temperatures are presented in Table 5. KF is the adsorption capacity at unit concentration and 1/n is the adsorption intensity. 1/n value indicates the type of isotherm to be irreversible (1/n=0), favorable (0<1/n<1) and unfavorable (1/n>1). Higher the value of 1/n, the higher will be the affinity between the adsorbate and the adsorbent and the heterogeneity of the adsorbent sites. The 1/n value indicates the relative distribution of energy sites and depends on the nature and strength of the adsorption process. For example, 1/n=0.57 refers to the fact that 57% of the active adsorption sites have same energy level [62]. It is found from Table 5 that the CEAC is more heterogeneous in nature. Since 1/n<1, phenol is favorably adsorbed CEAC at all temperatures.

Figure 12: Equilibrium isotherm plot for the removal of phenol onto CEAC (Co=50-150 mg/I, t=2h; m=0.4 g/l,pHo=8, T=303K).
| Freundlich |  |
|||||
|---|---|---|---|---|---|---|
| Temperature (K) | KF[(mg/g)/(mg/l)1/n] | 1/n | R2 | |||
| 303K | 7.6577 | 0.5900 | 0.9741 | |||
| 313K | 8.7655 | 0.5276 | 0.9876 | |||
| 323K | 6.6652 | 0.5709 | 0.9846 | |||
| 333K | 5.8573 | 0.5747 | 0.9980 | |||
| Langmuir |  |
|||||
| Temperature (K) | qm(mg/g) | KL(l/mg) | R2 | |||
| 303K | 169.3391 | 0.0175 | 0.9805 | |||
| 313K | 141.9685 | 0.0201 | 0.9974 | |||
| 323K | 143.4776 | 0.0161 | 0.9902 | |||
| 333K | 139.3689 | 0.0138 | 0.9979 | |||
| Temkin |  |
|||||
| Temperature (K) | KT(l/mg) | BT | R2 | |||
| 303K | 0.1370 | 41.4906 | 0.9891 | |||
| 313K | 0.1562 | 34.7158 | 0.9975 | |||
| 323K | 0.1271 | 34.9357 | 0.9929 | |||
| 333K | 0.1153 | 32.8701 | 0.9971 | |||
| Redlich-Peterson | 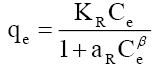 |
|||||
| Temperature (K) | KR(l/g) | aR(l/mg) | β | R2 | ||
| 303K | 1.9833 | 0.0000 | 4.3023 | 0.9451 | ||
| 313K | 1.900 | 0.0000 | 3.3796 | 0.9471 | ||
| 323K | 14.184 | 1.6551 | 0.4694 | 0.9751 | ||
| 333K | 121.43 | 20.2302 | 0.4292 | 0.9964 | ||
Table 5: Isotherm parameters for the removal of phenol onto CEAC at different temperatures ( Co =50-150 mg/l; t =2 h; m=0.4 g/l; pHo 8).
The qm is the monolayer saturation at equilibrium, whereas KL corresponds to the concentration at which the amount of phenol bound to the adsorbent is equal to qm /2. This indicates the affinity of the phenol to bind with the CEAC. A high KL value indicates a higher affinity. The data in Table 6 also indicate that the values of qm and KL decreased with an increase in temperature confirming the exothermic nature of the overall sorption process. From Table 5, it can be seen that the value of regression coefficient is highest for Tempkin isotherm at all the temperatures indicating the fitness of Tempkin isotherm.
| qe (mg/g) | ?Hst, a (kJ/kg) |
|---|---|
| 15 | -15.70 |
| 20 | -15.71 |
| 30 | -15.73 |
| 40 | -15.75 |
| 50 | -15.76 |
Table 6: Isosteric enthalpy of phenol onto CEAC.
Effect of temperature
The effect of temperature on adsorption of phenol onto CEAC was investigated at 303 K, 313 K and 323 K, as shown in Figure 13. It can be seen that the adsorption capacity of CEAC decreases as the temperature increases. It can, therefore, be inferred that the adsorption is exothermic in nature.

Figure 13: Equilibrium adsorption isotherms at different temperatures for adsorption of phenol onto CEAC (Co=50-150 mg/I, m=0.4 g/l,pHo=8, t=2h).
Estimation of thermodynamic parameters
The thermodynamic parameters such as free energy of adsorption  , enthalpy
 and entropy
 changes were estimated for the phenol adsorption onto CEAC by using equations presented in earlier publications [63-64]:
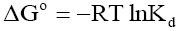 (7)
(7)
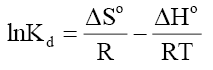 (8)
(8)
Where, Kd is known as the distribution coefficient of the adsorbate, is equal to (qe / Ce ) . R is the gas constant (8.314J/mol.K) and T is the temperature in Kelvin. The plot of lnKd vs. 1/T is linear with the slope and the intercept giving values of and
and  . These values were used to estimate
  .The Van’t Hoff plots for the adsorption of phenol onto CEAC are shown in Figure 14. The estimated values for were found to be negative at the various temperature for various concentrations indicating that spontaneous physical adsorption [64-65]. The negative value of change in enthalpy confirms that the adsorption of phenol to adsorbents is an exothermic process [66].

Figure 14: Van’t Hoff plot for the adsorption of phenol onto CEAC (Co =50-150 mg/l; t =2 h; m=0.4 g/l;pHo 8).
These thermodynamic parameters are given in Table 7. The heat of adsorption values between 0 and -20 kJ/mol are frequently assumed as to indicate physical nature of adsorption. Value for was found to be −9.19 to 13.65 kJ/mol for phenol adsorption onto CEAC [67]. It is obvious from the value that physio-sorption is mainly taking part in the adsorption process.
| Co(mg/l) | ΔHo(kJ/mol) | ΔSo(kJ/mol.K) | ΔGo (kJ/mol K) | |||
|---|---|---|---|---|---|---|
| 303K | 313K | 323K | 333K | |||
| 50 | -9.88 | 31.25 | -19.44 | -19.95 | -20.12 | -20.42 |
| 75 | -13.28 | 19.55 | -19.04 | -19.12 | -19.49 | -19.50 |
| 100 | -13.65 | 17.45 | -19.04 | -19.12 | -19.49 | -19.50 |
| 125 | -11.71 | 22.15 | -18.56 | -18.69 | -19.00 | -19.20 |
| 150 | -9.19 | 28.35 | -17.94 | -18.18 | -18.47 | -18.79 |
Table 7: Thermodynamic parameters for phenol adsorption onto CEAC ( Co =50-150 mg/l; t =2 h; m=0.4 g/l; pHo 8).
Isosteric heat of adsorption
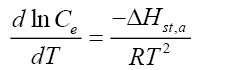
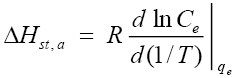
Apparent isosteric heat of adsorption  at constant surface coverage (by considering the range of qe values obtained in each experiment) is calculated using Clausius-Clapeyron equation [68].
 (9)
(9)
or
 (10)
(10)
For this purpose, the equilibrium concentration ( C e ) at a constant equilibrium amount of adsorbed solute, qe , is obtained from the adsorption isotherm data at different temperatures.  is calculated from the slope of the
 plot for different qe of phenol onto CEAC. The isosters corresponding to different equilibrium adsorption uptake of phenol by CEAC is shown through Figure 15. The results shown in Table 7, suggest that eqn. (9) represents the experimental data very well.

Figure 15: Adsorption isosters for determining isosteric heat of adsorption.
The variation of for the adsorption of phenol with the surface loading is presented in Figure 16. The is increasing with increasing surface loading indicating that CEAC has homogeneous surface. The dependence of heat of adsorption with surface coverage is usually observed to display the adsorbent-adsorbate interaction. The negative values of isosteric heat of adsorption for the adsorbate-adsorbent system shows that the sorption of phenol is an exothermic process [52].

Figure 16: Variation of ΔHst,a with respect to surface loading of phenol adsorption.
Column study
The effectiveness of adsorption process is measured based on maximum adsorption capacity of adsorbate onto adsorbent. Batch study of phenol removal onto laboratory prepared low cost CEAC demonstrated the highest phenol uptake onto (~170 mg/g) onto CEAC. In the column study, the applicability of CEAC as an adsorbent in a packed column under continuous-flow conditions was evaluated for the phenol removal from industrial point of view due to several advantages such as high yield operations and relatively easy scaling up from a laboratory process etc. [69-70]. The effects of parameters such as flow rate, packed bed height and initial sorbate concentration were studied. Although a number of researchers have recently reported on column behavior with respect to the removal of several adsorbates from aqueous solutions, only a few articles have reported on the dynamics of phenol adsorption on packed beds [71-76].
The most important criterion in the design of a column adsorber is the prediction of the column breakthrough, which determines the bed length and the operating lifespan and regeneration time of the bed [77-78]. Factors that affect the column breakthrough include both operating variables and characteristics of the sorbate and the sorbent. Thomas, Adams-Bohart and Yoon-Nelson kinetics models have been used for the prediction of breakthrough times. The details along with limitations of these models are presented elsewhere [79].
Effect of various parameters on breakthrough curves: The effect of flow rate (5 ml/min, 10 ml/min and 15 ml/min) for the phenol adsorption onto the CEAC was studied using an inlet phenol concentration of 100 mg/l and bed height of 150 mm is shown in Figure 17a. The phenol uptake is observed fast in the initial stages and rate become slower thereafter and finally reached to saturation. As flow rate increased, the breakthrough curves become steeper and reached the breakthrough quickly. This is because of the residence time of the adsorbate in the column, which is long enough for adsorption equilibrium to be reached at high flow rate. This means that the contact time between the phenol and CEAC is minimized. Increasing the flow rate gave rise to a shorter time for saturation [79]. The adsorption capacity of the CEAC was exhausted after 4-5 h of column operation. The breakthrough time for CEAC was found to be ~1.5 h for phenol.

Figure 17: Effect of (a) flow rate on breakthrough curve for phenol adsorption on CEAC (Inlet phenol concentration=100 mg/l; Bed height=150 mm), (b) bed height on breakthrough curve for phenol adsorption on CEAC (Bed Inlet phenol concentration=100 mg/l; Flow rate=10 ml/min), (c) initial ion concentration on breakthrough curve for phenol adsorption on CEAC (Bed height=150 mm; Flow rate=10 ml/min).
Figure 17b shows the breakthrough curves for the adsorption of phenol onto CEAC at various bed heights (15 cm, 20 cm and 25 cm) using the inlet concentration of 100 mg/l and flow rate of 10 ml/min. The results indicate that the throughput volume of the aqueous solution increased with increase in bed height, due to the availability of more number of sorption sites [79-80]. The equilibrium sorption capacity decreased with increase in bed height. The adsorption capacity of the CEAC was exhausted after 4-5 h of column operation. The breakthrough time for CEAC was found to be ~30 min for phenol.
The effect of inlet phenol concentration on the breakthrough curves at bed height of 150 mm and flow rate of 10 ml/min is shown in Figure 17c. It is seen that as the initial ion concentration increased from 50 mg/l, 100 mg/l and 150 mg/l, the break point time decreased. On increasing the initial ion concentration, the breakthrough curves became steeper and breakthrough volume decreased because of the lower mass-transfer flux from the bulk solution to the particle surface due to the weaker driving force [80-82]. At higher concentration the availability of the phenol for the adsorption sites is more, which leads to higher uptake of phenol at higher concentration even though the breakthrough time is shorter than the breakthrough time of lower concentrations. The adsorption capacity of the CEAC was exhausted after 5 h of column operation. The breakthrough time for CEAC was found to be ~80 min for phenol.
Column kinetic study: Thomas, Adams-Bohart and Yoon-Nelson kinetics models were tested to experimental data to predict the breakthrough curves by linear regression and to determine the characteristic parameters of the column that are useful for process design. The linear form of these three models is presented as follows:
Thomas model: 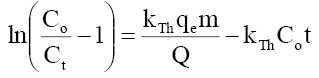 (11)
(11)
Yoon-Nelson model: 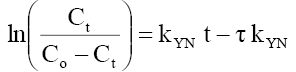 (12)
(12)
Adams-Bohart model: 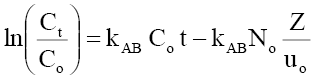 (13)
(13)
Where Ct, Co =the effluent and inlet solute concentrations (mg/l), qe =the predicted adsorption capacity (mg/g), m=the total mass of the adsorbent (g), Q=volumetric flow rate (ml/min), V=the throughput volume (ml), kTh=Thomas rate constant (ml/min/mg), kYN the rate constant (l/min), τ is the time required for 50% adsorbate breakthrough (min), t is the breakthrough (sampling) time (min), kAB (l/min.mg) is rate constant of Adams-Bohart model, Z (cm) is the bed depth, No (mg/L) is maximum phenol adsorption capacity per unit volume of adsorbent column and uo (cm/min) is the linear velocity of influent solution.
The kinetic coefficient, kTh and adsorption capacity and Q for Thomas model were determined from plot of ln[(Co/Ce)-1] against t (Figure 18 a-c). The result of kTh , R2 and qo are given in Table 8. Thomas rate constant, kTh increases (0.0232-0.0335 ml/min/mg) as the flow rate increases, while its value decreases as initial phenol concentration (Co) and bed height increases. The maximum adsorption capacity, qt (mg/g) increased with increase in flow rate, initial ion concentration and bed height. The high values of regression coefficients were determined indicating that the kinetic data conformed well to Thomas model. It is interesting to note that so far none has reported such a high adsorption capacity (~890 mg/g) of phenol onto any low cost adsorbent in column study.

Figure 18: Linear plot of Thomas model with experimental data at (a) different flow rates (b) bed heights (c) different concentrations.
| Kinetics Model | Flow rate | Bed height | Initial concentration | ||||||||
|---|---|---|---|---|---|---|---|---|---|---|---|
| 5 ml/min | 10 ml/min | 15 ml/min | 15 cm | 20 cm | 25 cm | 50 mg/l | 100 mg/l | 150 mg/l | |||
| Thomas | |||||||||||
| kTh (ml/min/mg) |
0.0232 | 0.0289 | 0.0335 | 0.0293 | 0.0203 | 0.0224 | 0.0307 | 0.0179 | 0.0142 | ||
| qT(mg/g) | 342.82 | 538.91 | 665.83 | 618.77 | 712.62 | 815.44 | 413.28 | 701.55 | 889.5 | ||
| R2 | 0.9792 | 0.995 | 0.9939 | 0.9841 | 0.9739 | 0.9722 | 0.9978 | 0.9982 | 0.9799 | ||
| Yoon & Nelson | |||||||||||
| KYN(min-1) | 0.0384 | 0.0478 | 0.55 | 0.0484 | 0.0335 | 0.0375 | 0.0267 | 0.0296 | 0.0352 | ||
| τ (min) | 165.69 | 130.33 | 106.52 | 149.83 | 172.73 | 197.44 | 190.08 | 169.7 | 145.29 | ||
| qYN (mg/g) | 2.0608 | 4.1217 | 6.1826 | 4.1217 | 3.2974 | 2.5364 | 2.171 | 4.1217 | 6.1707 | ||
| R2 | 0.9792 | 0.995 | 0.9939 | 0.9841 | 0.9739 | 0.9722 | 0.9978 | 0.9982 | 0.9799 | ||
| Adam-Bohart | |||||||||||
| KAB (ml/min.mg) |
0.0178 | 0.0163 | 0.0181 | 0.0121 | 0.0097 | 0.0133 | 0.017 | 0.0083 | 0.0047 | ||
| Madc(mg/L) | 105.88 | 188.9161 | 240.4475 | 230.24 | 203.237 | 165.42 | 156.98 | 291.04 | 427.05 | ||
| R2 | 0.9927 | 0.9579 | 0.9461 | 0.8292 | 0.8087 | 0.8206 | 0.9271 | 0.8874 | 0.8713 | ||
Table 8: Calculated columns Kinetics Parameters for phenol adsorption onto CEAC.
The kinetic parameters kYN (min-1), τ (min), qYN (mg/g) and regression coefficient R2 for Yoon-Nelson model were obtained by a plot of In Ce/(Co-Ce) vs. t gives a straight line with slope of kYN and intercept of –τ. kYN (Figure 19 a-c). The values of kYN , τ and adsorption capacity, qYN obtained are listed in Table 8. The results show that the rate constant, kYN increased with increased inlet phenol concentration and bed height but decreases with flow rate. Also, adsorption capacity, qYN increased with increase in flow rate and initial ion concentration but decreased with increase in bed height. The time required for 50% breakthrough, τ decreased with increase in flow rate, flow rate and initial ion concentration. High values of correlation coefficients indicate that Yoon and Nelson model fitted well to the experimental data.

Figure 19: Linear plot of Yoon-Nelson model with experimental data at (a) different flow rates, (b) different bed heights, (c) different concentrations.
Table 8 represents the linear regression results for Adams-Bohart model parameters. Linear plot of Adams-Bohart model in different heights, flow rates and concentrations is shown through Figure 20(a-c). The lower values of R2 as compare to the other models indicate that the Adams-Bohart model is not fitted well for the breakthrough curve.

Figure 20: Linear plot of Adams-Bohart model with experimental data at (a) different flow rates, (b) different bed heights, (c) different concentrations.
Conclusion
Present study showed that CEAC was effective in removing phenol from aqueous solutions and thus can be used as low cost adsorbent. Removal of phenol was found to be strongly pH and temperature dependent. The experimental data were best fitted to pseudo-second-order kinetic model. The maximum sorption capacity of CEAC for phenol adsorption was found to be ~170 mg/g in batch experiments while it is remarkably very high ~890 mg/g in packed bed column study. The effect of temperature pronounced the negative effect on phenol adsorption. The adsorption experimental data fitted well to Temkin isotherm. The negative value of enthalpy of adsorption indicated that the adsorption of phenol onto crab eye activated carbon was exothermic in nature. In the column study of phenol removal onto CEAC, the breakthrough time was found to be significantly high as compare to other low cost adsorbents reported in literature. The low value of R2 as compare to the other models indicates that the Adams-Bohart model is not fitted well for the breakthrough curve.
Funding Sources
The Authors are highly thankful to the Director of NIT Rourkela for providing financial assistance.
Acknowledgement
The authors thank the Department of Chemical Engineering, National Institute of Technology and the head of the department for providing research facilities and constant encouragement.
Nomenclature
| Co | Initial concentration of adsorbate (phenol) in solution, mg/l |
| Ce | Equilibrium liquid phase concentration, mg/l |
| Ct | Equilibrium liquid phase concentration after time t, mg/l |
| aR | Constant of Redlich-Peterson isotherm, l/mg |
| qe | Equilibrium adsorption capacity, mg/g |
| qt | Equilibrium adsorption capacity after time t, mg/g |
| qm | Maximum adsorption capacity of adsorbent, mg/g |
| ks | Pseudo-second-order rate constant, g/mg.min |
| %R | Adsorption yield, % |
| kf | Pseudo 1st order rate constant, min-1 |
| kint. | Intra-particle diffusion rate constant, mg/g min1/2 |
| C | Constant that gives idea about the thickness of boundary layer, mg/g |
| KR | R-P isotherm constant, l/mg |
| KF | Freundlich constant, l/mg |
| 1/n | Mono-component (non-competitive) Freundlich heterogeneity factor of the single component, dimensionless |
| KL | Langmuir adsorption constant, l/mg |
| KT | Equilibrium binding constant, l/mol |
| BT | Temkin Isotherm constant, related to the heat of adsorption |
| R2 | Regression coefficient |
| pHPZC | Point of zero charge |
| ΔHst,a | Isosteric heat of adsorption at constant surface coverage |
| a | Initial rate (mg/g.min) |
| b | Parameter (g/mg) related to the extent of surface coverage and activation energy |
| T | Temperature, oC or K |
| αT | Bangham constant |
| koB | Bangham constant |
| oC | Degree Celsius |
| t | Time, min |
| kd | Distribution coefficient |
| V | Volume of the solution, l |
| m | Mass of the adsorbent, g/l |
| R | Universal gas constant, 8.314 J/mol K |
| F(t) | Fractional amount of phenol adsorb |
| r | Particle radius |
| De | Effective diffusion coefficient |
| Ss | Outer surface of the adsorbent per unit volume |
| K1 | Mass Transfer coefficient (cm/s) |
| KB | Boltzmann constant |
| qe,cal | Calculated value of solid phase concentration of adsorbate at equilibrium, mg/g |
| qe,exp | Experimental value of solid phase concentration of adsorbate at equilibrium, mg/g |
| β | Exponent (0< <1) (in Redlich-Peterson isotherm) |
| ΔSo | Change in the entropy for adsorption, kJ/mol |
| ΔHo | Enthalpy of adsorption, kJ/mol |
| ΔGo | Gibbs free energy of adsorption, kJ/mol |
| Q | Volumetric flow rate (ml/min) |
| kTh | Thomas rate constant (ml/min/mg) |
| qT | The maximum adsorption capacity (mg/g) for Thomas model |
| kYN | Yoon-Nelson rate constant |
| τ | Time required for 50% adsorbate breakthrough (min) |
| No | Maximum phenol adsorption capacity per unit volume |
| kAB | The rate constant of Adams-Bohart model |
| uo | linear velocity of influent solution (cm/min) |
| Z | Bed depth (cm) |
References
- Ahmaruzzaman Md. Adsorption of phenolic compounds on low-cost adsorbents: A review. Adv Colloid Interf Sci. 2008;43:48-67.
- Kilic M, Varol EAM, Putun AE. Adsorptive removal of phenol from aqueous solution on activated carbon prepared from tobacco residues equilibrium, kinetics and thermodynamics.J Hazard Mater.2011;189:397-403.
- ATSDR (Agency for Toxic Substances and Disease Registry), Toxicological Profile for Phenol, US Department of Health and Human Services, USA, 1998.
- Radhika M, Palanivelu K. Adsorptive removal of chlorophenols from aqueous solution by low cost adsorbent-kinetics and isotherm analysis. J Hazard Mater.2006;138:116-24.
- USEPA, Technical Support Document for Water Quality Based Toxics Control. EPA/440/485032 United States Environmental Protection Agency, Washington, DC, USA, 1985.
- Salame II, Bandosz TJ. Role of surface chemistry in adsorption of phenol on activated carbons. J Colloid Interf Sci. 2003;264:307-12.
- BIS, Tolerance Limit for Industrial Effluents Discharged into Inland Surface Waters: Coke Oven. IS 2490 (Part 1), Bureau of Indian Standards, New Delhi, 1974.
- Ozkaya B. Adsorption and desorption of phenol on activated carbon and a comparison of isotherm models. J Hazard Mater B. 2006;129:158-63.
- Kamble SP, Mangrulkar PA, Bansiwal AK, et al. Adsorption of phenol and o-chlorophenol on surface altered fly ash based molecular sieves. ChemEngJ. 2008;138:73-83.
- WHO. Guidelines for drinking-water quality WHO/SDE/WSH/0304/47, vol. 2, 2nd edn. Geneva, Switzerland: World Health Organization 1996.
- Kumar S, Zafar M, Prajapati JK, et al. Modelling studies on simultaneous adsorption of phenol and resorcinol onto granular activated carbon from simulated aqueous solution. J Hazard Matter. 2011;185:287-94.
- Mohanty K, Das D, Biswas MN. Adsorption of phenol from aqueous solutions using activated carbons prepared from Tectonagrandis sawdust by ZnCl2 activation. ChemEngJ. 2005;115:121-31.
- Busca G, Berardinelli S, Resini C, et al. Technologies for the removal of phenol from fluid streams: A short review of recent developments. J Hazard Mater. 2008;160:265-88.
- Wang SL, Tzou YM, Lu YH, et al. Removal of 3-chlorophenol from water using rice-straw-based carbon. J Hazard Mater. 2007;147:313-18.
- Lin S-H, Juang R-S. Adsorption of phenol and its derivatives from water using synthetic resins and low-cost natural adsorbents:A review.J EnvManag.2009;90:1336-49.
- Babel S, Kurniawan TA. Low cost adsorbent for heavy metals uptake from contaminated water: A review. J Hazard Mater.2003;97:219-43.
- Kalderis D, Koutoulakis D, Paraskeva P, et al. Adsorption of polluting substances on activated carbons prepared from rice husk and sugarcane bagasse. ChemEngJ. 2008;144:42-50.
- Tan IAW, Ahmad AL, Hameed BH. Adsorption, isotherms kinetics, thermodynamics and desorption studies of 2,4,6-trichlorophenol on oil palm empty fruit bunch-based activated carbon. J Hazard Mater. 2009;164:473-82.
- Streat M, Patrick JW, Camporro Pérez. Sorption of phenol and para-chlorophenol from water using conventional and novel activated carbons. Wat Res. 1995;29:467-72.
- Mubarik S, Saeed A, Mehmood Z, et al. Phenol adsorption by charred sawdust of sheesham (Indian rosewood; Dalbergiasissoo) from single, binary and ternary contaminated solutions. J Tai InstChemEng. 2012;43:926-33
- Rodriguez-Reinoso F, Marsh H, Heintz EA. Activated carbon: Structure characterization preparation and applications In, Introduction to Carbon Technologies.1997;2:35.
- Mameri N, Boudries N, Addour L. Batch zinc biosorption by a bacterial nonliving Streptomyces rimosus biomass. Wat Res. 1999;33(6):1347-54.
- Min S-H, Park JK, Han James S, etal. Proceedings of the IAWPS 2003 International Conference on Forest Products: Better Utilization of Wood for Human, Earth and Future : Daejeon, Korea, April 21-24, 2003. Volume 1. [S.l.]: The Korean Society of Wood Science and Technology, International Association of Wood Products Societies, 2003;pp: 607-14.
- ZhangL, ZhaoL,Yu Y et al.Removal of lead from aqueous solution by nonliving Rhizopusnigricans. Wat Res.1998;32(5):1437-44.
- Deshkar AM, Bokade SS, Dara SS.Modified Hardwickiabinata bark for adsorption of mercury (II) from water. Water Res.1990;24(8):1011-16.
- Seki K, Saito N, Aoyama M. Removal of heavy metal ions from solutions by coniferous barks. Wood Sci Technol. 1997;31:441-47.
- Rios JV,Bess-ObertoL,TiemannKJ, et al.Investigation of metal ion binding by agricultural by-products, in: Proceedings of the 1999. ConferenceonHazardous Waste Research, St. Louis. 121-130.
- Lee BG, Rowell RM. Removal of heavy metals ions from aqueous solutions using lignocellulosic fibers. J Nat Fibers. 2004;1:97-108.
- Baes AU, Umali SJP, Mercado RL. Ion exchange and adsorption of some heavy metals in a modified coconut coir cation exchanger. Water Sci Technol.1996;34(11):193-200.
- Maranon E, Sastre H. Modified hardwood sawdust as adsorbent of heavy metal ions from water. J WoodSci Technol. 1992;40(3):217-27.
- Narges B, Jalal A. Preparation of high surface area activated carbon from corn by chemical activation using potassium hydroxide.ChemEngg Res Des.2009;87:1059-64.
- Rodriguez-ReinosoF, Lopez-Gonzalez J, Berenguer C. ActivatedCarbon
from AlmondShells-I: Preparation and Characterization by nitrogen adsorption. Carbon. 1982;20:513-18. - Ahmadpour D, Do D. Thermogravimetric analysis of corn cob impregnated with zinc chloride for preparation of activated carbon. J Therm Anal Calorim. 2000;63:351-57.
- I S I. Activated carbon, powdered and granular-methods of sampling and tests;” IS 877. New Delhi: Bureau of Indian Standards, 1989.
- Eaton D, Clesceri LS, Greenberg AE. Standard methods for the examination of water and wastewater; 21st ed., Washington, DC, USA: APHA, 2005.
- Vogel, I. A text book of quantitative inorganic analysis; 3rd edn., ELBS. London, 1969.
- Liu T, Li YH, Du Q, et al. Adsorption of methylene blue from aqueous solution by grapheme. Colloid Surf B. 2012;90:197-203.
- Dabrowski A, Podkoscielny P, Hubicki Z, et al. Adsorption of phenolic compounds by activated carbon: A critical review. Chemosphere. 2005;58:1049-70.
- Yanhui L, Qiuju D, Tonghao L, et al. Equilibrium, kinetic and thermodynamic studies on the adsorption of phenol onto grapheme. Mater Res Bull.2012;47:1898–1904.
- Saeed M, Iqbal WH. Kinetics, equilibrium and mechanism of Cd2+removal from aqueous solution by mungbean husk. J Hazard Mater.2009;168:1467-75.
- Boehm HP. Surface oxides on carbon and their analysis: A critical assessment. Carbon. 2002;40:40145-149.
- IUPAC. Manual of Symbols and Terminology of Colloid Surface; Butterworths: London, 1982.
- Kumar A, Prasad B, Mishra IM. Isotherm and kinetics study for acrylic acid removal using powdered activated carbon.J Hazard Mater. 2010;176:774–83
- Brunauer S, Emmet PH, Teller E. Adsorption of gases in multimolecular layers. J Am ChemSoc.1938;60:309-19.
- Dutta S, Basu JK, Ghar RN. Studies on adsorption of p-nitrophenol on charred saw-dust. Sep PurifTechnol. 2001;21:227-35.
- Nadavala SK, Swayampakula K, Boddu VM, et al. Biosorption of phenol and o-chlorophenol from aqueous solutions on to chitosan calcium alginate blended beads. J Hazard Mater.2009;162:482-89.
- Kumar NS, Min K. Phenolic compounds biosorption onto Schizophyllum commune fungus: FTIR analysis, kinetics and adsorption isotherms modeling. ChemEngJ.2011;168:562-71.
- Altenor S, Carene B, Emmanuel E, et al. Adsorption studies of methylene blue and phenol onto vetiver roots activated carbon prepared by chemical activation. J Hazard Mater. 2009;165:1029-39.
- Carlos MC. Adsorption of organic molecules from aqueous solutions on carbon materials. Carbon. 2004;42:83-94.
- Mall ID, Srivastava VC, Agarwal NK. Removal of Orange-G and Methyl Violet dyes by adsorption onto bagasse fly ash-Kinetic study and equilibrium isotherm analyses. Dyes and Pigments. 2006;69(3):210-23.
- Mall ID, Srivastava VC, Agarwal NK, et al. Removal of Congo red from aqueous solution by bagasse fly ash and activated carbon: Kinetic study and equilibrium isotherm analyses. Chemosphere. 2005;61(4):492-501.
- Srivastava VC, Swamy MM, Mall ID, et al. Adsorptive removal of phenol by bagasse fly ash and activated carbon: Equilibrium, kinetics and thermodynamics. Colloid Surf A: Physicochemical and Engineering Aspects. 2006;272(1-2):89-104.
- Tutem E, Apak R, Unal CF. Adsorptive removal of chlorophenols from water by bituminous shale. Water Res. 1998;32:2315-42.
- Boyd GE, Adamson AE, Meyers LS. The exchange of adsorption ions from aqueous solutions by organic zeolites II kinetics. J Am ChemSoc. 1947;69:2836-48.
- Kalavathy MH, Karthikeyan T, Rajgopal S, et al. Kinetic and isotherm studies of Cu (II) adsorption onto H3PO4-activated rubber wood sawdust. J Colloid InterfSci.2005;292:354-62.
- Kumar KV, Ramamurthi V, Sivanesan S. Biosorption of malachite green, a cationic dye onto Pithophora sp., fresh water algae. Dyes and Pigments. 2006;69:102-7.
- Mondal MK, Singh S, Umareddy M, et al. Removal of Orange G From aqueous solution by hematite: Isotherm and mass transfer studies. Koe J ChemEng. 2010;27:1811-15.
- Freundlich HMF. Over the adsorption in solution. J Phys Chem. 1906;57:385–470.
- Langmuir I. The adsorption of gases on plane surfaces of glass, mica and platinum. J Am ChemSoc. 1918;40:1361-1403.
- Temkin MJ, Pyzhev V. Kinetics of ammonia synthesis on promoted iron catalysts. ActaPhysicochimURSS. 1940;12:327-56.
- Redlich O, Peterson DL. A useful adsorption isotherm. J Phys Chem. 1959;63:1024-36.
- Srivastava VC, Mall ID, Mishra IM. Equilibrium modelling of single and binary adsorption of cadmium and nickel onto bagasse fly ash. ChemEngJ. 2006;117(1):79-91.
- Parfitt GD, Rochester CH. Adsorption from Solution at the Solid/Liquid Interface. Academic Press, Orlando, 1983.
- Jain AK, Gupta VK, Suhas Jain S. Removal of chlorophenols using industrial wastes. Environ Sci Technol.2004;38:1195-1200.
- Roig MG. Sorption Processes, in: Kennedy, J, F.; Cabral, J.M.S. (Eds.) C.; RecoveryProcesses for Biological Materials.Wiley Chic ester 2008, 15, 369-414.
- Longhinotti E, Pozza F, Sanchez LMN, et al. Adsorption of anionic dyes on the biopolymer chitin. J Brazilian ChemSoc.1998;9:435.
- Sahu AK, Srivastava VC, Mall ID, et al. Adsorption of furfural from aqueous solution onto activated carbon: Kinetic, equilibrium and thermodynamic study.SepSciTechnol. 2008;43(5):1239-59
- Young DM, Crowell AD. Physical Adsorption of Gases. Butterworths: London, 1962.
- Chern JM, Chien YW. Adsorption of nitrophenol onto activated carbon: isotherms and breakthrough curves. Water Res. 2002;36(3):647-55.
- Srivastava VC, Prasad B, Mishra IM, et al. Prediction of breakthrough curves for sorptive removal of phenol by bagasse fly ash packed bed.IndEngChemRes.2008;47(5):1603-13.
- Rao JR, Viraraghavan T. Biosorption of phenol from an aqueous solution by Aspergillusnigerbiomass. Bioresour Technol.2002;85:165-171.
- Juang RS, Lin SH, Tsao KH. Sorption of phenols from water in column systems using surfactant-modified montmorillonite. J Colloid Interface Sci. 2004;269:46-52.
- Adak A, Pal A. Removal of phenol from aquatic environment by SDS-modified alumina: Batch and fixed bed studies. Sep PurifTechnol. 2006;50:256-62.
- Aksu Z, Gonen F. Binary biosorption of phenol and chromium-(VI) onto immobilized activated sludge in a packed bed: Prediction of kinetic parameters and breakthrough curves. Sep PurifTechnol. 2006;49:205-16.
- Vazquez G, Alonso R, Freire S, et al. Uptake of phenol from aqueous solutions by adsorption in a Pinuspinasterbark packed bed. J Hazard Mater. 2006;133(1-3),61-7.
- Vazquez I, Rodriguez-Iglesias J, Maranon E, et al. Removal of residual phenols from coke wastewater by adsorption. J Hazard Mater. 2007;147(1-2):395-400.
- Vázquez G, Alonso R, Freire S, et al. Uptake of phenol from aqueous solutions by adsorption in a Pinus pinasterbark packed bed. J Hazard Mater B. 2006;133:61–7.
- Walker GM, WeatherleyLR.Adsorption of acid dyes onto granular activated carbon in fixed beds. Water Res. 1997;31:2093–101.
- Singh S, Srivastava VC, Mall ID. Fixed-bed study for adsorptive removal of furfural by activated carbon. Colloid Surface. A. 2009;332:50–6
- Sivakumar P, Palanisamy PN. Adsorption studies of basic Red 29 by a nonconventional activated carbon prepared from Euphorbia antiquorum L. Int J Chem Tec Research. 2009;1(3):502-10.
- GoelJ, KadirveluK, RajagopalC, et al. Removal of lead(II) by adsorption using treated granular activated carbon: Batch and column studies. JHazardMater. 2005;125:211–20.
- Baek K, Song S, Kang S, et al. Adsorption kinetics of boron by anion exchange resin in packed column bed. J IndEngChem. 2007;13(3):452-56.