Original Article
, Volume: 16( 1)Synthesis of Fe2O3 Using Emblica officinalis Extract and its Photocatalytic Efficiency
- *Correspondence:
- C Malarkodi , Materials Chemistry Group, Department of Chemistry, University of Delhi, Delhi-110007, India, Tel: +254721857685; E-mail: cmalarkodi@chemistry.du.ac.in
Received: January 25, 2018; Accepted: February 21, 2018; Published: February 28, 2018
Citation: Malarkodi C, Malik V, Uma S, et al. Synthesis of Fe2O3 Using Emblica officinalis Extract and its Photocatalytic Efficiency. Mat Sci Ind J. 2018;16(1):125
Abstract
We identified a green method for the synthesis of Fe2O3 using the plant extract of the fruit E. officinalis. The fresh fruit extract reacted with a solution of ferric chloride at room temperature to form FeOOH initially. Homogeneous Fe2O3 crystallites were obtained after 24 h and were confirmed by the presence of prominent reflections in the PXRD pattern. The presence of various aliphatic amines, alkene and primary amines present in the E. officinalis extract is expected to be responsible for the precipitation of FeOOH and subsequent formation of Fe2O3. The FTIR spectra of Fe2O3 indicated the presence of the bands corresponding to different organic amine and alkene functional groups. The band gap energy of the resultant Fe2O3 investigated by the UV-vis absorption spectroscopy was found to be in the range of 1.97-2.05 eV. The photocatalytic efficiency of Fe2O3 nanoparticles was evaluated by the degradation of Rhodamine 6G (Rh-6G) under visible light irradiation.
Keywords
E. officinalis; Green synthesis; Fe2O3 nanoparticles; Photocatalytic activity
Introduction
Metals, bimetallic alloys, binary and ternary metal chalcogenides in nano-size dimensions with well-defined shapes and structures along with unique properties have been widely researched in the past decades because of their vital role in nanotechnology and catalysis [1]. Among the vast majority of materials that are available, Fe2O3 deserves special mention because of its easy accessibility with potential applications such as targeted drug delivery, sensors, photo catalysis, and biomedicines and most commonly for water purification etc. [2-7]. The synthesis of Fe2O3 in Nano dimensions using naturally occuring reagents available from plants will be significant for special biological related applications. Although many biological based methods are available for the synthesis of magnetic nanoparticles of α-Fe2O3 [8], research efforts are continued to find non-toxic, environmental friendly alternate methods [9]. Usually, the reported methods make use of the plant extracts as reagents and some of the previously known plant sources include Hibiscus rosa sinensis, Pisum sativum, Psidium guajava, Emblica officinalis, Aloe vera extract and Piper nigrum [10-15]. Table 1 lists the literature data on the various plant reagents that are used for the synthesis of different metal and metal oxide materials [16-31]. Phyllanthus emblica (Emblica officinalis) commonly known as Indian “gooseberry” or amla, belonging to family Euphorbiaceae is an important herbal drug used in ayurvedic systems of medicine. E. officinalis has been reported to play a beneficial role to treat diseases such as diabetes, ulcer, and anemia and possesses cardio protective properties [32]. E. officinalis fruit extracts contain chemicals including quercetin, ascorbic acid, gallic acid, tannins, flavonoids, and pectin and polyphenolic compounds [33]. The present work reports the investigation of using E. officinalis fruit extracts as a biological reagent for the synthesis of Fe2O3. The synthesized Fe2O3 has been characterized and explored as a photo catalyst under visible light illumination.
| S. No. | Sources (Common name) | Precursor-Product | References |
|---|---|---|---|
| 1 | Emblica officinalis (Indian goose berry) |
Mg(NO3)2?MgO | 16 |
| 2 | Eucalyptus leaf extract (Tasmanian bluegum) |
FeSO4·7H2O?Fe | 17 |
| 3 | Aspalathus linearis (Rooibos tea) |
RuCl3.H2O?RuO2 | 18 |
| 4 | Cacumen platycladi extract (Oriental thuja) |
RhCl3?RuO | 19 |
| 5 | Acalypha indica (Indian acalypha) |
CuSO4?CuO | 20 |
| 6 | Tabernaemontana divaricate (Crape jasmine) |
CuSO4?CuO | 21 |
| 7 | Thymus vulgaris L (Garden thyme) |
CuCl2?CuO | 22 |
| 8 | Allium sativum(garlic), Alliumcepa (onion)and Petroselinumcrispum (parsley) |
Zn(NO3)2?ZnO | 23 |
| 9 | Rosa canina(Dog-rose) | Zn(NO3)2?ZnO | 24 |
| 10 | Plectranthus amboinicus (Indian borage) |
Zn(NO3)2?ZnO | 25 |
| 11 | Azadirachta indica(Neem) | Zn(Ac)2?ZnO | 26 |
| 12 | Sargassum muticum (Japanese wireweed) |
Zn(Ac)2?2H2O)?ZnO | 27 |
| 13 | Trifolium pretense (Beebread) |
Zn(Ac)2?ZnO | 28 |
| 14 | Callistemon viminalis (Weeping Bottlebrush) |
[Sm(CH3COO)3(H2O)2] ?Sm2O3 | 29 |
| 15 | Hibiscus sabdariffa (Roselle) |
Ce(NO3)3?CeO | 30 |
| 16 | Pseudokirchneriella subcapitata (Selenstrum capriconutum) |
Ce(NO3)4?CeO2 | 31 |
Table 1: List of nanomaterials obtained using plant sources.
Materials and Methods
Collection and preparation of plant extract
The fruits sample of E. officinalis was collected from the local market near Mayur vihar phase III, New Delhi, India.
Fresh extract
E. officinalis fruit extract was prepared following a procedure reported earlier [13]. E. officinalis fruits were thoroughly washed with water and finely chopped. The E. officinalis fruit pieces were then crushed into the mortar and pestle through the deionized water in a mass to volume ratio 10 g of fruit pieces to 100 ml of water. The mixture was allowed to stand for 10 minutes and passed through the Whatman No.1 filter paper to remove the solids parts. The filtrate was stored at 4°C and was used for the synthesis.
Boiled extract
10 g of finely chopped E. officinalis fruits was weighed and boiled with 100 ml of double distilled water at 60°C-80°C for 10 minutes. After boiling, the solution was filtered through the Whatman No. 1 filter paper and stored at 4°C for further use.
Reflux condition
10 g of E. officinalis fruits were chopped and refluxed with 100 ml of double distilled water for 1 h, followed by filtering and storing at 4°C for further use.
Synthesis of Fe2O3 nanoparticles using E. officinalis extracts
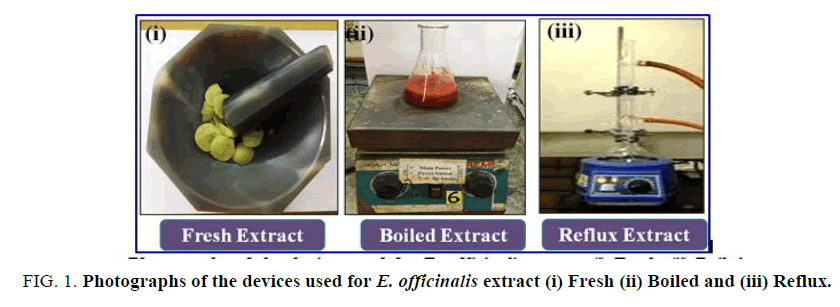
Synthesis of Fe2O3 nanoparticles was carried out using fresh extract of E. officinalis obtained by boiling and reflux procedures as detailed above. 0.4055 g of FeCl3 (1 mM) was dissolved in 90 ml of double distilled water. 10 ml of E. officinalis was added separately to this 90 ml of aqueous solution of FeCl3. The reaction mixtures were stirred for 5 h at room temperature with the formation of brick red color colloidal Fe2O3 particles at the bottom of the flask which were allowed to stand for 24 h. The colloidal solution was centrifuged at 2000 rpm for 20 minutes and washed with double distilled water repeatedly to remove any impurities followed by drying in hot air oven at 60°C for 5 h (FIG. 1).
Figure 1: Photographs of the devices used for E. officinalis extract (i) Fresh (ii) Boiled and (iii) Reflux.
Synthesis of Fe2O3 nanoparticles using ascorbic acid
In a typical experiment, 0.4055 g of FeCl3 (1 mM) was dissolved in 90 ml of double distilled water continuously stirring to form a red solution, and then, 10 ml of 0.4 g ascorbic acid was added to the solution slowly. The reaction mixtures were stirred for 5 h at room temperature with the formation of brick red color colloidal Fe2O3 particles at the bottom of the flask which were allowed to stand for 24 h. The colloidal solution was centrifuged at 2000 rpm for 20 minutes and washed with double distilled water repeatedly to remove any impurities followed by drying in hot air oven at 60°C for 5 h.
Characterization
High resolution X’Pert PANanalytical diffractometer equipped with a Xe Propotional detector employing Cu Kα radiation (λ=1.5418 Å) was employed to obtain data with a scan rate of 1.65 s per step and with a step size of 0.04°C at 298 K (DY3813). The SEM micrograph of the sample was recorded using JEOL 6610 LV. TEM was obtained using FEI Technai G2 20 electron microscope operating at 200 kV. Fourier Transform Infra-Red spectroscopy was recorded using a Perkin Elmer 2000 spectrometer using KBr pellet technique. UV-vis diffuse reflectance data were collected over the spectral range 200−800 nm using Perkin-Elmer Lambda 35 (Waltham, MA, USA) scanning double beam spectrometer equipped with a 50 mm integrating sphere. The data were transformed into absorbance with the Kubelka-Munk function for the estimation of the band gap. The synthesized Fe2O3 has been characterized and explored as a photocatalyst for the degradation of the cationic dye Rhodamine 6G (Rh-6G) under visible light illumination of a 450 W xenon lamp. The details of the photocatalytic set up have been described earlier [34]. 0.1g of catalyst was added to 50 ml aqueous solution of solution of Rh-6G (10-5 M Concentration). Before the measurements, the suspension was stirred in dark for 30 mins to achieve an adsorption-desorption equilibrium. After shining the light, 4 ml of solution was collected at 1 h intervals and the catalyst was separated using centrifugation. The degradation was followed by monitoring decrease in the λmax (540 nm) of Rh–6G.
Results and Discussion
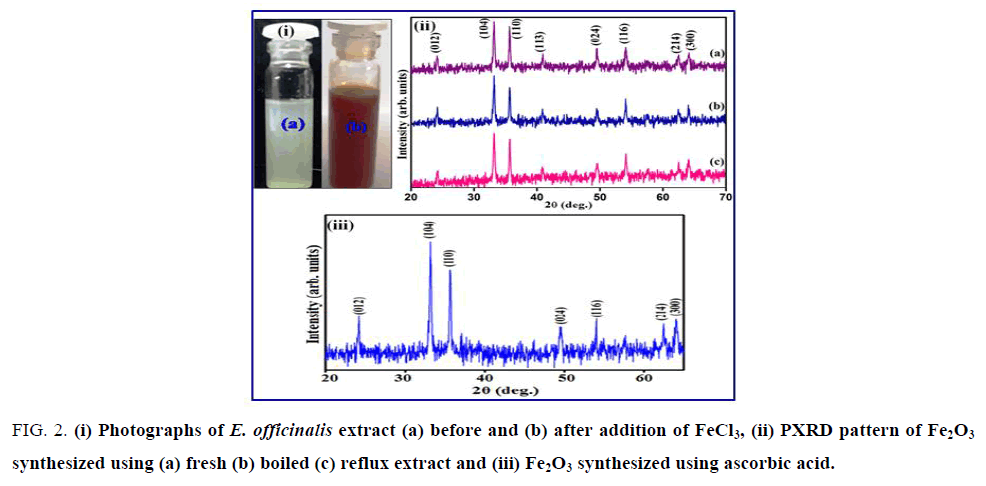
The formation of Fe2O3 nanoparticles of the filtrate was primarily followed by carefully observing the color change during the reaction. The appearance of brick red color after the treatment of clear yellow FeCl3 solution with the extract of E. officinalis fruit suggested possible reaction. FIG. 2 (i) shows the digital photographs of the solution of E. officinalis fruit extract with added FeCl3 solution together with the blank FeCl3 solution in which fruit extract was not added. The color change from yellow to red was observed within 2-10 mins after mixing and after 6-12 h the suspended particles in the solution got settled down at the bottom of the flask. The stability of the brick red color crystallites after 24 h suggested the formation of Fe2O3 possibly from FeOOH that gets precipitated initially. The biomolecule interaction is expected since the hydroxide followed by oxide generation requires change in pH [35]. The PXRD patterns of Fe2O3 nanoparticles synthesize using E. officinalis extracts along with Fe2O3 synthesized independently using ascorbic acid are shown in FIG. 2 (ii) and (iii).
Figure 2: (i) Photographs of E. officinalis extract (a) before and (b) after addition of FeCl3, (ii) PXRD pattern of Fe2O3 synthesized using (a) fresh (b) boiled (c) reflux extract and (iii) Fe2O3 synthesized using ascorbic acid.
The observed reflections were indexed in rhombohedral symmetry with lattice parameters a=5.035 (5) Å and c=13.74 (7) Å (S.G. R¯3c) and matched with the reported pattern (JCPDS File No. 86-0550) [36]. The XRD pattern of these peaks reveals that the Fe2O3 nanoparticles are crystalline in nature. SEM images coupled with TEM revealed the aggregation of rod shaped of Fe2O3 crystallite with diameter ranging between 20 nm to 100 nm (FIG. 3).
Figure 3: SEM, TEM images and EDX spectrum of Fe2O3 nanoparticles synthesized using (a, d and g) fresh, (b, e and h) boiled and (c, f and i) reflux extract.
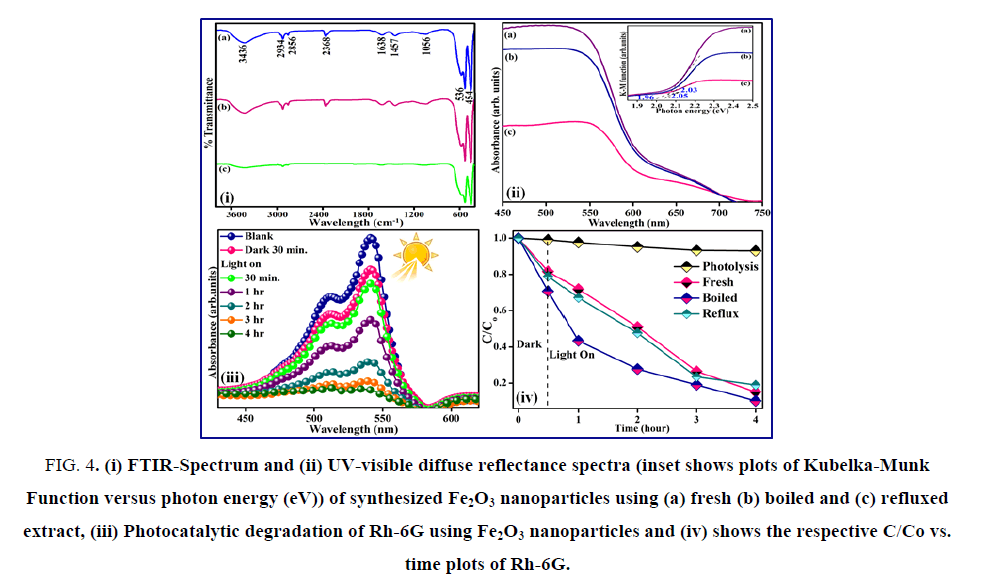
Fe2O3 nanoparticles synthesized using E. officinalis fresh extracts have more uniform distribution, while boiled and refluxed E. officinalis extracts produced much larger aggregation of the Fe2O3 particles. The elemental compositional analysis of the synthesized Fe2O3 was also confirmed using EDX. The FTIR spectra of Fe2O3 obtained using different E. officinalis extracts indicated the presence of finger print bands corresponding to aliphatic amine, alkene and primary amines (FIG. 4 (i)). The band in the region of 3436 cm-1 is ascribed to the N-H stretching vibrations of primary amines (R-NH2). The bands at 2934 and 2856 cm-1 are due to the presence of C-H bonds. Thus, FTIR results confirm the presence of primary amines that are mostly responsible for the formation of Fe2O3 particles. The presence of 1056 and 1457 cm-1 can be assigned to C-O and C-C stretching of alcohols respectively [37,38]. Finally the bands due to Fe-O stretching at 536 and 454 cm-1 were also observed. The UV-visible diffuse reflectance spectrum consisted of the strong absorption of Fe2O3 at 530 nm (FIG. 4 (ii)). The band gap energy was evaluated by plotting the Kubelka-Munk function with photon energy (eV) and was found to vary from 1.97-2.05 eV and these observed values were in close agreement with the earlier reported [39].
Figure 4: (i) FTIR-Spectrum and (ii) UV-visible diffuse reflectance spectra (inset shows plots of Kubelka-Munk Function versus photon energy (eV)) of synthesized Fe2O3 nanoparticles using (a) fresh (b) boiled and (c) refluxed extract, (iii) Photocatalytic degradation of Rh-6G using Fe2O3 nanoparticles and (iv) shows the respective C/Co vs. time plots of Rh-6G.
The photocatalytic activity of Fe2O3 synthesized using fresh, boiled and reflux extract were evaluated for the degradation of aqueous Rh-6G under visible 400 nm<λ>800 nm radiation. The concentration of the dye solution was not decreased in the presence of the catalysts in dark. Also, photolysis of the dye solution under light irradiation was carried out without the addition of the catalysts in order to separate the noticeable degradation due to photo catalysis by the catalysts under visible light irradiation. The fact that only negligible decrease occurred in the concentration of the dye in the absence of the catalyst, suggested that certainly photo catalysis has taken place in the presence of Fe2O3 catalyst within four hours under visible light irradiation as shown by the decrease in the absorbance intensity at 540 nm. Appreciable decomposition was noticed only by photocatalysis using Fe2O3 under visible light (FIG. 4 (iii)). Further, the Fe2O3 obtained using boiled extract showed better photocatalytic abilities as compared to the Fe2O3 obtained using the fresh or refluxed E. officinalis extracts (FIG. 4 (iv)).
Conclusion
Fe2O3 nanoparticles have been successfully synthesized using the extract obtained from E. officinalis and the formation was confirmed by a variety of analytical techniques. This approach offers a novel ecofriendly and cost effective method probably. The extract containing possibly different stabilizing and capping agents is responsible for the formation of Fe2O3 from ferric chloride solution. Fe2O3 nanocrystallites are found to be useful to degrade aqueous solution of Rh-6G under visible light irradiation.
Acknowledgements
Authors thank DST (SR/S1/PC-07/2011), DU-DST Purse Grant phase-II and University of Delhi under the “Scheme to Strengthen RandD Doctoral Research Program”. Timely help from Prof. R. Nagarajan for encouragement is profusely acknowledged. CM and VM thank UGC woman PDF and CSIR for SPMF fellowship respectively.
References
- Diodati S, Dolcet P, Casarin M, et al. Pursuing the crystallization of mono and polymetallic nanosized crystalline inorganic compounds by low-temperature wet-chemistry and colloidal routes. Chem Rev. 2015;115(20):11449-502.
- Yang L, Cao Z, Sajja HK, et al. Development of receptor targeted magnetic iron oxide nanoparticles for efficient drug delivery and tumor imaging. J Biomed Nanotechnol. 2008;4(4):439-49.
- Drbohlavova J, Hrdy R, Adam V, et al. Preparation and properties of various magnetic nanoparticles. Sensors (Basels). 2009;9(4):2352-62.
- Wang C, Huang Z. Controlled synthesis of α-Fe2O3 nanostructures for efficient photocatalysis. Mater Lett. 2016;164:194-7.
- Zeng J, Li J, Zhong J, et al. Improved Sun light photocatalytic activity of α-Fe2O3 prepared with the assistance of CTAB. Mater Lett. 2015;160:526-8.
- Ren T, He P, Niu W, et al. Synthesis of α-Fe2O3 nanofibers for applications in removal and recovery of Cr (VI) from wastewater. Environ Sci Pollut Res Int. 2013;20(1):155-62.
- Pankhurst QA, Connolly J, Jones SK, et al. Applications of magnetic nanoparticles in biomedicine. J Phys D. 2003;36(13):R167.
- Sarkar J, Mollick MM, Chattopadhyay D, et al. An eco-friendly route of γ-Fe2O3 nanoparticles formation and investigation of the mechanical properties of the HPMC-γ-Fe2O3 nanocomposites. Bioprocess Biosyst Eng. 2017;40(3):351-9.
- Saif S, Tahir A, Chen Y. Green synthesis of iron nanoparticles and their environmental applications and implications. Nanomaterials. 2016;6(11):209.
- Manikandan A, Durka M, Antony SA. Hibiscus rosa-sinensis leaf extracted green methods, magneto-optical and catalytic properties of spinel CuFe2O4 nano-and microstructures. J Inorg Organomet Polym Mater. 2015;25(5):1019-31.
- Mukherjee A, Pokhrel S, Bandyopadhyay S, et al. A soil mediated phyto-toxicological study of iron doped zinc oxide nanoparticles (Fe@ ZnO) in green peas (Pisum sativum L.). Chem Eng J. 2014;258:394-401.
- Santhoshkumar T, Rahuman AA, Jayaseelan C, et al. Green synthesis of titanium dioxide nanoparticles using Psidium guajava extract and its antibacterial and antioxidant properties. Asian Pac J Trop Med. 2014;7(12):968-76.
- Ramesh PS, Kokila T, Geetha D. Plant mediated green synthesis and antibacterial activity of silver nanoparticles using Emblica officinalis fruit extract. Spectrochim Acta A. 2015;142:339-43.
- Manikandan A, Sridhar R, Antony SA, et al. A simple aloe vera plant-extracted microwave and conventional combustion synthesis: Morphological, optical, magnetic and catalytic properties of CoFe2O4 nanostructures. J Mol Struct. 2014 ;1076:188-200.
- Mohapatra B, Kuriakose S, Mohapatra S. Rapid green synthesis of silver nanoparticles and nanorods using Piper nigrum extract. J Alloys Compd. 2015;637:119-26.
- Ramesh PS, Kokila T, Geetha D. Plant mediated green synthesis and antibacterial activity of silver nanoparticles using Emblica officinalis fruit extract. Spectrochim. Acta A. 2015;142:339-43.
- Zhuang Z, Huang L, Wang F, et al. Effects of cyclodextrin on the morphology and reactivity of iron-based nanoparticles using Eucalyptus leaf extract. Ind Crops Prod. 2015 ;69:308-13.
- Ismail E, Diallo A, Khenfouch M, et al. RuO2 nanoparticles by a novel green process via Aspalathus linearis natural extract and their water splitting response. J Alloys Compd. 2016;662:283-9.
- Huang Y, Ma Y, Cheng Y, et al. Biosynthesis of ruthenium nanoparticles supported on nitric acid modified activated carbon for liquid-phase hydrogenation of 2, 2, 4, 4-tetramethylcyclobutane-1, 3-dione. Catal Commun. 2015 Dec 5;72:20-3.
- Sivaraj R, Rahman PK, Rajiv P, et al. Biosynthesis and characterization of Acalypha indica mediated copper oxide nanoparticles and evaluation of its antimicrobial and anticancer activity. Spectrochim. Acta A. 2014;129:255-8.
- Sivaraj R, Rahman PK, Rajiv P, et al. Biogenic copper oxide nanoparticles synthesis using Tabernaemontana divaricate leaf extract and its antibacterial activity against urinary tract pathogen. Spectrochim Acta A. 2014;133:178-81.
- Nasrollahzadeh M, Sajadi SM, Rostami-Vartooni A, et al. Green synthesis of CuO nanoparticles using aqueous extract of Thymus vulgaris L. leaves and their catalytic performance for N-arylation of indoles and amines.J Colloid Interface Sci. 2016;466:113-9.
- Stan M, Popa A, Toloman D, et al. Enhanced photocatalytic degradation properties of zinc oxide nanoparticles synthesized by using plant extracts. Mater Sci Semicond Process. 2015;39:23-9.
- Jafarirad S, Mehrabi M, Divband B, et al. Biofabrication of zinc oxide nanoparticles using fruit extract of Rosa canina and their toxic potential against bacteria: A mechanistic approach. Mater Sci Eng C. 2016;59:296-302.
- Fu L, Fu Z. Plectranthus amboinicus leaf extract-assisted biosynthesis of ZnO nanoparticles and their photocatalytic activity. Ceram Int. 2015;41(2):2492-6.
- Bhuyan T, Mishra K, Khanuja M, et al. Biosynthesis of zinc oxide nanoparticles from Azadirachta indica for antibacterial and photocatalytic applications. Mater Sci Semicond Process. 2015 Apr 1;32:55-61.
- Azizi S, Ahmad MB, Namvar F, et al. Green biosynthesis and characterization of zinc oxide nanoparticles using brown marine macroalga Sargassum muticum aqueous extract. Mater Lett. 2014;116:275-7.
- Dobrucka R, Długaszewska J. Biosynthesis and antibacterial activity of ZnO nanoparticles using Trifolium pratense flower extract. Saudi J Biol Sci. 2016;23(4):517-23.
- Sone BT, Manikandan E, Gurib-Fakim A, et al. Sm2O3 nanoparticles green synthesis via Callistemon viminalis' extract. J Alloys Compd. 2015;650:357-62.
- Thovhogi N, Diallo A, Gurib-Fakim A, et al. Nanoparticles green synthesis by Hibiscus Sabdariffa flower extract: main physical properties. J Alloys Compd. 2015;647:392-6.
- Booth A, Størseth T, Altin D, et al. Freshwater dispersion stability of PAA-stabilised cerium oxide nanoparticles and toxicity towards Pseudokirchneriella subcapitata. Sci Total Environ. 2015 Feb 1;505:596-605.
- Khan KH. Roles of Emblica officinalis in medicine-A review. Botany Research International. 2009;2(4): 218-28.
- Hossain MM, Mazumder K, Hossen SM, et al. In vitro studies on antibacterial and antifungal activities of Emblica officinalis. Int J Pharm Sci Res. 2012; 3(4): 1124.
- J Singh, S Uma. Efficient photocatalytic degradation of organic compounds by ilmenite AgSbO3 under visible and UV light irradiation. J phys Chem. C 2009; 113: 12483.
- Pardha-Saradhi P, Yamal G, Peddisetty T, et al. Plants fabricate Fe-nanocomplexes at root surface to counter and phytostabilize excess ionic Fe. Biometals. 2014; 27(1): 97-114.
- Ahmmad B, Leonard K, Islam MS, et al. Green synthesis of mesoporous hematite (α-Fe2O3) nanoparticles and their photocatalytic activity. Adv Polym Tech. 2013; 24(1): 160-7.
- Ramanujam K, Sundrarajan M. Antibacterial effects of biosynthesized MgO nanoparticles using ethanolic fruit extract of Emblica officinalis. J Photochem Photobiol. 2014; 141: 296-300.
- Mohamed GF, Shaheen MS, Khalil SK, et al. Application of FT-IR spectroscopy for rapid and simultaneous quality determination of some fruit products. Nat Sci. 2011; 9(11): 21-31.
- Xia C, Jia Y, Tao M, et al. Tuning the band gap of hematite α-Fe2O3 by sulfur doping. Phys Lett. 2013 Oct 30;377(31-33): 1943-7.
