Original Article
, Volume: 18( 1)Parametric and Kinetics Study of Hybrid Dye Uptake by Activated Mango Seed Endocarp
- *Correspondence:
- Abonyi MN
Department of Chemical Engineering,
Nnamdi Azikiwe University,
Awka,
Nigeria,
Tel: 2348037674859;
E-mail: mn.abonyi@unizik.edu.ng
Received: January 23, 2023, Manuscript No. TSCT-23-89381; Editor assigned: January 25, 2023, PreQC No. TSCT-23-89381 (PQ); Reviewed: February 08, 2023, QC No. TSCT-23-89381; Revised: March 28, 2023, Manuscript No. TSCT-23-89381 (R); Published: April 05, 2023, DOI: 10.37532/0974-7443.2023.18(1).179
Citation: Abonyi MN, Nwabanne JT, Umembamalu CJ, et al. Parametric and Kinetics Study of Hybrid Dye Uptake by Activated Mango Seed Endocarp. Chem Technol Ind J. 2023;18(1):179.
Abstract
The study investigated the parametric, isotherm and kinetic modeling of the uptake of Hybrid Dye (HD) from synthetic textile effluent using Mango seed Endocarp Activated Carbon (MEAC). The activated adsorbent (MEAC) employed was obtained from an endocarp of mango seed. Scanning Electron Microscopy (SEM), proximate analysis, Branauer-Emmett-Teller (BET), Fourier Transform Infrared (FTIR) analysis was done on the activated carbon produced. The influences of factors such as pH, initial concentration of Hybrid Dye (HD), dosage, pH and the solution temperature on HD removal were investigated. The SEM images and FTIR spectra indicated significant porosity and relevant functional groups involved in HD dye adsorption. The results obtained from BET analysis revealed that the specific surface area of MEAC before and after activation and after adsorption were 452.36 m2/g, 892.16 m2/g and 687.894 m2/g, respectively. The results indicate that adsorption process was better described by Langmuir isotherm and pseudo second order kinetic model. The thermodynamic parameters; enthalpy and Gibb’s free energy values were negative showing that the adsorption process was exothermic and spontaneous. The value of entropy obtained was negative. The negative value of entropy relates to a decrease in the degree of movement of the HD molecules adsorbed which suggest strong affinity between HD and the MEAC. The results obtained reveal potential use of MEAC and suggest its efficacy for the treatment of textile effluent. This potential of MEAC in the removal of HD from textile effluent can find great application in waste water treatment and in the management of solid waste resulting from the consumption of mango.
Keywords
Hybrid; Isotherm; Kinetics; Mango seed; Endocarp
Abbreviations:
BET: Branauer-Emmett-Teller; FTIR: Fourier Transform Infrared; HD: Hybrid Dye; IPD: Intra-Particle Diffusion; MEAC: Mango seed Endocarp Activated Carbon; PFO: Pseudo First Order; PSO: Pseudo Second Order; SEM: Scanning Electron Microscopy
Introduction
Large amount of waste water are generated from textile industries and this waste contain high concentrations of suspended solids, dye, surfactants, high pH and high Chemical Oxygen Demand (COD) resulting from organic compounds in the waste [1]. The discharge of these dyes in high quantities into the aquatic environment causes serious danger to the marine lives since some of the dyes are persistent in nature [2]. Globally, about 700,000 tons of approximately 10,000 different types of dyes and pigments are produced yearly.
Most of these dyes are reported to be carcinogenic, synthetic, chemically and thermally stable and non-biodegradable [3]. On water bodies, dye effluent results to the change in the colour of water, which in turn reduces light penetration and inhibit photosynthesis of aqueous organism and flora. Additionally, dye are not only highly soluble and stable in water but also do not easily degrade in the aqueous solution and this makes removal efforts complicated and difficult [4].
Various techniques based on availability, operability, effectiveness and insensitive to toxic materials have been employed in the removal of dyes from wastewater. They are ion exchange, membrane filtration, flocculation, coagulation, chemical precipitation, electrochemistry and biological degradation [5]. Most industrial wastewater pollutants are most times resistant and toxic to the living organisms and thus, biological systems are not able to treat these wastewaters [6]. Consequently, the adsorption process is a well-known efficient technique and also a highly reported method of dye removal from aqueous solution [7]. It is also reported to be environmentally friendly [8]. The adsorption process shows high efficiency in the removal of dye from aqueous solution, this causes the transfer of synthetic dyes from wastewater to the solid phase of the adsorbent, thereby reducing their content in the effluent wastewater [9]. Various adsorbents produced from different materials have been employed to remove dyes from contaminated water bodies [10].
The amount of solute such as dye molecules adsorbed per unit mass of adsorbent such as MEAC is measured as a function of the equilibrium concentration of the solute (dye molecule) in the bulk solution of dye at a constant temperature by adsorption isotherm. The adsorption mechanism, rate constant and equilibrium adsorption capacity are predicted by adsorption kinetics. Understanding the adsorption kinetics and mass transfer processes in any adsorption system is crucial in the of adsorption treatment systems design.
Mango seed endocarp was employed in the present study to produce activated adsorbent. The choice of mango seed endocarp was informed by a genuine need toward abating the continued environmental pollution problems associated with the consumption of mango fruit yearly in Nigeria. The MEAC was the choice adsorbent employed for the treatment of textile effluent containing dye mixtures such as rhodamine B, safranine, methylene blue and malachite green. The MEAC efficiency in the removal of the HD mixtures was determined by applying Scanning Electron Microscopy (SEM), proximate analysis, BET analysis, bulk density, and Fourier Transform Infrared Spectroscopy (FTIR). The pH of dye, adsorbent dosage, solution temperature and initial concentration were the factors considered. Some adsorption isotherm and adsorption kinetic models were employed to fit the experimental data generated.
Materials and Methods
Material collection and preparation
The mango seeds were fetched from a waste dump at Eke-Awka market in Anambra state Nigeria. The chemicals used were purchased from the chemical and reagent stores at Bridge head market Onitsha, Anambra state, Nigeria and are of analytical grades. The mango seeds collected were washed thoroughly in clean running water and thereafter sun dried. The endocarp was separated from the seed and was dried at 105°C in a convective hot air dryer. The dried endocarp was later carbonized in a muffle furnace at 500°C for 2 hours, crushed with a mortar, and stored in airtight container for further use.
Activation and particle size classification
The essence of chemical activation of the adsorbent is to increase the number of active sites in the adsorbent as well as increase the degree of its porosity. This was achieved by mixing a 1:1 ratio of 60% Orthophosphoric acid (H3PO4) with respect to the carbonized endocarp of the mango seed. The mixture was stirred evenly and transferred to an earthen pot and sealed properly with aluminum foil to prevent entrance of air. The mixture was thereafter allowed to stand for thirty minutes prior to been put in the oven and heated for four hours at 250°C. The resultant adsorbent was allowed to cool to room temperature. The adsorbent produced was washed several times with warm distilled, followed by cold distilled water until a pH of 7.0 was attained. The resultant activated carbon was subsequently dried in a hot air dryer set at 105°C for two hours. The resultant Mango seed Activated Carbon (MEAC) was separated into different sizes using mechanical shaker and stored in an airtight container for use.
Proximate analysis
Standard established methods of proximate analysis were employed to determine some proximate composition of the sample. Such analysis includes ash content moisture content bulk density, volatile matter and fixed carbon content of the adsorbent [11-14].
Instrumental analysis of the adsorbents
The MEAC particles of uniform particle size (150 μm) were characterized using Shimadzu FTIR-8400S spectrophotometer to identify the functional groups present. Also, the surface morphology of MEAC was determined using SEM machine of model JSM6400. The BET surface area of MEAC was done by employing NOVAWin equipment of 11.03 versions.
Preparation of effluent
The simulated textile dye effluent (hybrid dye) was prepared by mixing malachite green, safranine, methylene blue and Rhodamine B dyes in equal ration. 1 g each of the dyes was measures into a 1000 mL volumetric flask in order to prepare 1 g/L concentration of the simulated HD effluent. Thereafter, 200 mL of distilled water was added to the solution which was shaking properly to produce a homogenous solution and thereafter made up to 1000 mark. Serial dilution of different HD concentrations was prepared from the stock solution.
Batch adsorption study
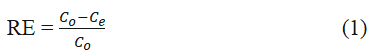
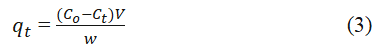
The HD uptake from the aqueous solution using MEAC adsorbent was investigated in this report. The influence of solution pH, initial conc. of HD, dosage of adsorbent and solution temperatures was the factors under study. The dosage of MEAC considered was 0.5 g, 1.0 g, 1.5 g, 2.0 g and 2.5 g. The HD concentrations used were 50 mg/L, 100 mg/L, 200 mg/L, 300 mg/L and 500 mg/L, the solution temperatures used were 30°C, 35°C, 40°C, 50°C and 60°C. Furthermore, the pH of the solution studied where 2.0-12.0 at 2.0 intervals, while keeping the particle size constant at 150 μm. Five different 250 mL conical flask containing 50 ml of HD effluent each was set up and 0.5 g, 1.0 g, 1.5 g, 2.0 g and 2.5 g of MEAC was measured into it respectively. 0.1 N HCl or 0.1 N NaOH was used to adjust the pH of the solution to 4.0, followed by constant agitation of the mixture using a magnetic stirrer set at room temperature (30°C). At time of 5, 10, 20, 30, 40, 50, 60, 70, 80, 100, 120 min test samples were drawn from the flasks into sample bottles. The samples collected were allowed to cool before been analyzed by UV-VIS spectrophotometer at 525 nm to obtain the absorbance of the supernatant. A calibration curve was done to evaluate the HD concentration. The removal percentage of the HD at equilibrium state was determined by employing equation 1 [15,16].
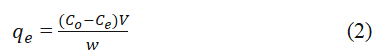
Equally, equilibrium amount of HD qe and the amount adsorbed at time t, qt, were calculated by employing equations 2 and 3. [17].
The whole procedure was repeated for the influence of solution pH, temperature of solution, and initial concentration of HD effluent. The adsorbate (HD) and the adsorbent (MEAC) interactions were evaluated by the application of 3 equilibrium isotherm models, namely; Freundlich, Langmuir and Temkin models. The information on the pathways and reaction mechanisms of the reaction as it relates to the rate of the adsorption of HD with the MEAC in the solution was analyzed by the kinetic study. Kinetic study on the adsorption of HD by MEAC adsorbent was done with the help of Elovich, Pseudo First Order (PFO), Intra Particle Diffusion (IPD) and Pseudo Second Order (PSO) models. The isotherm and kinetics equations as well as the plots made are presented in Table 1.
| Adsorption models | Type | Expression | Plot made | Equation no |
|---|---|---|---|---|
| Isotherm | Langmuir | 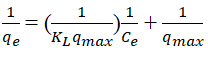 |
 |
(4) |
| Freudlich | 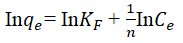 |
 |
(5) | |
| Temkin |  |
 |
(6) | |
| Kinetics | PFO |  |
 |
(7) |
| PSO |  |
 |
(8) | |
| Elovich | 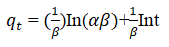 |
 |
(9) | |
| Intra particle diffusion | 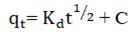 |
 |
(10) |
TABLE 1. List of equilibrium isotherm studied.
Where, qe is the HD ion concentration Ce is the HD concentration in the effleunt solution at equilibrium, KL is the Langmuir isotherm const. qmax is the maximum adsorption capacity KF and n are the Freundlich isotherm constant AT is the Temkin isotherm equilibrium binding constant bT is the Temkin isotherm constant T is the temp of the solution, R is the gas constant is the adsorption capacity of HD at time, t; K1 is the pseudo 1st order rate constant K2 is the pseudo 2nd order rate constant α and βare the Elovich constant.
Results and Discussion
Surface area and proximate analysis
The BET surface area pore diameters of MEAC obtained from the sample were 452.436 m2/g, 892.216 m2/g and 687.894 m2/g for before activation, after activation and after adsorption, respectively. The MEAC had specific surface area of 452.436 m2/g before activation and was enhanced by activation to 892.216 m2/g. The BET surface area was reduced from 892.216 m2/g to 687.894 m2/g after adsorption. Activation treatment given to the adsorbent opened up more pores spaces in the adsorbent and consequently increased its surface area. After adsorption, the surface area reduced as the HD molecules had taken up some of the actives sites on the MEAC. The MEAC has micro pores of less than 2 nm and are classified as micro pore.
However, the proximate analysis results are shown in Table 2. The bulk density obtained was 0.7685 g/ml as shown in table. The sample contains 56.88 of fixed carbon which signify that the sample used is a good adsorbent material with high carbon content.
| Properties | Value |
|---|---|
| Bulk density (g/ml) | 0.7685 |
| Moisture content (%) | 7.081 |
| Volatile matter (%) | 15.058 |
| Ash content (%) | 21.044 |
| Fixed carbon (%) | 56.88 |
TABLE 2. Analysis of the proximate composition of MEAC.
Scanning electron micrograph
The SEM images of MEAC adsorbent done before activation of adsorbent, after activation of adsorbent and after the adsorbent has been used for adsorption are shown in Figure 1a-c. Figure 1a reveals that the pore surfaces of MEAC adsorbent before the adsorbent activation were not well established. The absence of pronounced surface morphology in MEAC before it was activated impedes the penetration of HD molecules into the internals of the adsorbent. Figure 1b shows the formations of several well-developed pores on the MEAC owing to the effects of agent of activation acid at high temperature which usually results to the volatile compounds volatilization. This confirmed that orthophosphoric acid used in the activation resulted in the formation of well-developed pores on the adsorbent surfaces. The essential properties of a good and effective adsorbent is a well-developed porous surfaces coupled with an enhanced surface area. Figure 1c revealed marked closure in the interstitial spaces observed in the MEAC before activation. This could be due to adsorbed HD that filled some of the void spaces present in unused adsorbents. The activation produced a structural defect in the carbonized mango seed endocarp by promoting pore development which enhances the rate of adsorption as well as the capacity of the system.

FIG 1a: SEM image of MEAC before activation.

FIG 1b: SEM image of MEAC after activation.

FIG 1c: SEM image of MEAC after adsorption.
Surface chemistry
The FT-IR spectra images of MEAC before activation, after activation and after adsorption were analyzed over the spectra range of 750 cm-1-4000 cm-1 and are presented in Figure 2a-c. The FTIR spectral of MEAC before adsorption displays some discernable peaks: 3880.3 cm-1, 3826.9 cm-1, 3417.98 cm-1, 2777.59 cm-1, 1820.86 cm-1 and 1635.69 cm-1. The peak at 2777.59 cm-1 can be attributed to methyl, methylene group and the extension vibration of the C-H bond in the aromatic methoxyl group. The peaks in the region ranging between 3417.98 cm-1 and 3880.3 cm-1 are the stretching frequencies of the O-H bond and those of N-H frequencies. The peak at 1820.86 cm-1 can be attributed to the stretching of C=O bonds in ketone or aldehyde groups from hemicellulose. The peak observed at 1635.69 cm-1 could be attributed to the O-H bonds from water molecule present in the sample. FTIR spectra of the MEAC before and after the adsorption are presented in Figure 2b and 2c. These spectra were similarly showing absorption bands around 3356.25 cm-1 which corresponds to the elongation vibration of the O-H bonds. The peak at 1797.2 cm-1 is attributed to the stretching of the C=C bond. The peak at 1041.2 cm-1 is attributed to the C-C-C bond. The spectra of MEAC was characteristic of activated carbons where the bands at 2800.73 cm-1 and 1797.72 cm-1 disappeared leading to a decrease in carbon aliphaticity and complete removal of aldehydes and ketones. The high temperatures employed in the preparation of MEAC gave rise to the disintegration of the functional groups that originally makeup the mango seed endocarp, thus breaking the bonds of carboxyl, alcohol and ether groups that formed the mango seed endocarp. The peaks at 2800.73 cm-1, 2268.36 cm-1 and 1327.72 cm-1 for the activated MEAC shifted to 3070.78 cm-1, 2414.96 cm-1 and 1689.7 cm-1, respectively after adsorption. However, those peaks at 1797.72 cm-1 did not changed after adsorption process with MEAC. These apparent differences observed in the IR spectra show a satisfactory interaction influences and could be attributed to HD uptake from the solution by MEAC.

FIG 2a: FTIR result of mango seed endocarp before activation.

FIG 2b: FTIR result of MEAC after activation.

FIG 2c: FTIR result of MEAC after adsorption.
Effect of adsorbent dosage on the sorption of HD
The effect of MEAC dosage on the uptake of the HD from the aqueous solution was plotted and the graph is presented in Figure 3.According to figure an increase in the amount of the adsorbent in the effluent solution results to increase in the percentageremoval of the HD from the solution. Hence, 30°C and 60 minutes equilibrium time, a variation in MEAC dosage from 0.5 g to2.5 g lead to a comparable rise in the uptake efficiency of HD from 62.62% to 82.59%, respectively. This is so since a rise inMEAC dosage produce a corresponding increment in the amount of binding sites available for the HD uptake; therefore, moreHD will be removed from the solution. Increasing the contact time from 5 to 60 minutes resulted in an increase in the amount ofHD removed. However, the amount of HD removed after 60 minutes remain practically insignificant. Hence, the equilibriumtime determined in this study was 60 minutes. The number of HD molecules available in the solution at high adsorbent dosageswas insufficient to utterly combine with all active adsorption sites on the MEAC. This results to the reduction in the HDadsorption capacity per mass of adsorbent and in a surface equilibrium state. Yu, et al. obtained a similar results using activatedcarbon modified by a surfactant to remove methylene blue from aqueous solution.

FIG 3: Influence of varying adsorbent dosage on adsorption of HD.
Effect of pH of HD on the sorption of HD
The effect of pH of HD solution on the sorption of HD from the aqueous solution is shown in Figure 4. It shows that increase in effluent pH from 2.0 to 8.0 resulted to an increase in the amount of HD removed from the solution. Afterwards, the % HD uptake reduced with more increase in pH of HD from 8.0 to 12.0. At the equilibrium time (60 minutes), the amount of dye removed at pH of 2.0, 4.0, 6.0, 8.0, 10.0 and 12.0 were 34.41, 40.23, 89.02, 91.12, 81.15 and 86.35 percent, respectively. It revealed that the optimum HD ion uptake from the HD solution by MEAC occurred at 8.0 pH. The extent of acidic and basic compounds ionization is controlled by the pH values of the HD solution and affects the surface charge of MEAC. At reduced pH value of the HD solution, the dissociation of H+ by O containing functional groups on the adsorbent surface would be repressed. Furthermore, the MEAC electronegativity together with the electrostatic force of attraction between HD cation and MEAC became reasonably weak. Due to the free H+ inhibition, the adsorption of HD cation onto MEAC active sites by competing adsorption resulted in a decrease in the rate of HD removal. Increase in the concentration of -OH in the HD solution, results in the reduction of the degree of dissociation thereby increasing the overall HD removal rate at higher pH. Additionally, the degree of dissociation of hydrogen ion by the functional group containing oxygen on the surface of the MEAC rises with the increase of pH of HD solution. The electronegativity of MEAC as well as the electrostatic force of attraction between the HD cation in the solution and MEAC surface increased as well. Similarly, the -OH and the C=O on the MEAC surface can as well attract the cationic HD molecules at high pH value. However, above 8.0 pH the amount of HD removal from the solution decreased steadily. This is so because high concentration of HD ions in the bulk HD solutions generates more molecular HD form, which finds it very difficult permeating the internal structures of MEAC at high pH.

FIG 4: Influence of varying the solution pH on adsorption of HD.
Effect of the initial HD concentration on the sorption of HD
The effect of initial HD concentration on the sorption of HD from the aqueous solution is presented in Figure 5. The percentage removal of the HD from the solution decreased as the concentration of the HD increased from 50 mg/L to 500 mg/L. At an equilibrium time of 60 minutes and HD initial concentration of 50 mg/L, 100 mg/L, 200 mg/L, 300 mg/L and 500 mg/L, the percentage removal of the HD was 76.7%, 70.91%, 57.71%, 43.11% and 35.39% respectively. The uptake efficiency of HD declined with an increase in the HD initial concentration. This is caused by insufficient available active sites resulting from high HD initial concentration. At lower concentrations, the ratio of the initial number of the HD molecules to the available surface area was low. If the number of active sites in the surfaced of MEAC remains constant, the number of HD ions adsorbed in the interlayer space of the MEAC will increase resulting to a decrease in the number of ions removed. Similar reports have been documented by other researchers.

FIG 5: Influence of varying the initial concentration of HD on adsorption.
Effect of solution temperature on the sorption of HD
The effect of solution temperature on the sorption of HD ion from the aqueous solution is presented in Figure 6. According to the plot in Figure an increase in the temperature of the HD solution from 30°C to 60°C resulted to a reduction in the percentage uptake efficiency of HD from the aqueous solution. At the equilibrium time of 60 minutes and temperatures of 30°C, 35°C, 40°C, 50°C and 60°C, the percentage removal of the HD from the solution was 92.04%, 84.28%, 80.56%, 71.82%, 57.56% respectively. Increase in the temperature of the solution give rise to a corresponding increase in the kinetic energy of HD molecules, resulting to a reduced interaction between MEAC and HD. Hence, the adsorption process in this study is exothermic in nature. Similar findings have been reported by Boumchita, et al. and Abia, et al. when removing methylene blue from potato peelings and adsorption of Rhodamine B onto orange peel powder, respectively.

FIG 6: Influence of varying solution temperature on adsorption of HD.
Isotherm study
The relationship existing between the quantities of adsorbate adsorbed for any unit amount of the adsorbent and liquid phase equilibrium concentration of adsorbate in the aqueous solution is expressed by the equilibrium isotherm. Isotherm study plays an important role in the evaluation of the optimum capability of an adsorption process. It helps in the development of an equation that correctly represents the results that could be used for design purposes. To investigate the model that best describes the adsorption process, the Langmuir, Freundlich and Temkin isotherms were used to fit the experimental data obtained. The linear regression value (R2) and the maximum adsorption capacity (qm) were used to judge the appropriateness of the isotherm model fitness. The various parameters in the three isotherm models were plotted (not shown) and its R2 values were obtained as shown in Table 3. The slopes and intercepts obtained from these plots were employed to calculate the other isotherm parameters and the results are shown in Table 2. Considering Langmuir isotherm model as shown in Table 1 (Equation 4). If the separation factor (RL) is greater than one the process is unfavorable, if it is equal to one the process is linear if it within 0<RL<1 the process is favorable, and if it is zero, the process is irreversible [17]. According to Table 3 the RL values obtained for this study were 0.8296, 0.6299, 0.4787, 0.06187, -0.6782 for 30, 35°C, 40°C, 50°C and 60°C, respectively. It depicts that the adsorption of HD from the aqueous solution was favored between 30°C-50°C. The maximum adsorption capacity of MEAC was seen to increase with reduction in the values of solution temperatures. The highest qm was obtained at 30°C (45.045 mg/g). The R2 obtained forLangmuir isotherm also revealed increasing values as temperatures decreasing and were all above 0.90 which shows favorability of the process. Hence, the adsorption process of HD at 30°C performed better than other temperatures [18]. Considering the Freundlich isotherm model (Equation 5), the indication of the favourability of the adsorption process is usually determined by the amount of adsorption intensity, n. If n lies in the range of 1-10, the favorability of an adsorption process is achieved. From Table 3, the adsorption intensity (n) varied from 0.734 to 3.156. This values obtained are in conformity with the requirement for physical adsorption process, which shows it is favourable [19].
Temkin isotherm depicts a linear regression of the heat of adsorption as a function of surface coverage of adsorbent provided that the extreme adsorbate concentration is ignored (Equation 6). The Temkin model parameter, B, (J/mol) relates to the adsorption energy variation. The large values obtained which are all positive for all the temperatures considered suggest that the adsorption process is exothermic [20].
Furthermore, to establish the best fit model, R2 with values ranging from 0 to 1 was adopted. R2 value depicts the extent of variance in the dependent factors that can be adjudged from the independent factors under consideration. Hence, an R2 value of 0 indicates a non-prediction, while a value of show a perfect prediction. Judging from Table 3, the Langmuir isotherm model having the best R2 of 0.930 for all the temperatures considered provided the best fit to the adsorption data [21,22]. The next best model was the Freundlich isotherm. It depicts that both models provided above 93% prediction of the adsorption process studied.
It also showed that Temkin isotherm had above 80% prediction of the dependent variable by the independent variable which is quite acceptable.
| Isotherms | Temperature (°C) | |||||
|---|---|---|---|---|---|---|
| 60 | 50 | 40 | 35 | 30 | ||
| Langmuir | Qm | 15.504 | 23.585 | 32.258 | 37.594 | 45.045 |
| Kl (L/g) | -0.1155 | 1.0761 | 0.1120 | 0.07474 | 0.05161 | |
| RL | -0.6782 | 0.06187 | 0.4787 | 0.6299 | 0.8296 | |
| R2 | 0.935 | 0.939 | 0.939 | 0.956 | 0.964 | |
| Freundlich | n | 0.734 | 1.149 | 1.691 | 2.070 | 3.156 |
| Kf (L/g) | 1.5123 | 1.6983 | 1.833 | 1.893 | 1.992 | |
| R2 | 0.909 | 0.9377 | 0.9242 | 0.9304 | 0.9198 | |
| Temkin | AT | 10.542 | 8.165 | 12.009 | 20.601 | 7.419 |
| BT | 0.319 | 0.217 | 0.0034 | 0.0123 | 0.457 | |
| B | 4235.09 | 4672.12 | 5687.90 | 5897.10 | 6576.12 | |
| R2 | 0.8456 | 0.8612 | 0.857 | 0.816 | 0.879 | |
TABLE 3. Regressed isotherm data.
Adsorption kinetics of HD adsorption on MEAC
The rate of adsorption process of HD from the solution was determined by adsorption kinetics. The kinetics of adsorption is essential for the adsorption process modeling as well as determination of the process that controls the mechanism of adsorption. The Pseudo First Order (PFO) kinetic model explains a reversible relationships existing when a liquid and solid phases interacts in a system with an equilibrium being established. However, the pseudo 2nd order model posit that chemical interactions are likely involved in the rate limiting step in an adsorption process and this may result to the adsorbate ion binding to the surface of the adsorbent through a bond that is as strong as covalent bonds. In Elovich kinetic model the actual adsorbent surfaces are assumed to be energetically heterogeneous. At low surface coverage, neither interactions between the adsorbed species and desorption of the adsorbed species could significantly upset the adsorption kinetics at a smaller surface coverage.
The qe and k1 values estimated from the intercepts and slopes of plots between Log (qe-qt) versus t for PFO are shown in Table 1 (Equation 7). Similarly, for PSO the qe and k2 obtained for PSO were evaluated from intercepts and slops of t/q versus t plots as shown in Table 1 (Equation 8). The Elovich model parameters of α and β were calculated from the plot of qt versus t shown in Table 1 (Equation 9).
According to Table 4, the PFO and PSO Kinetic model presented a reasonably high R2 of more than 0.970 at lower solution temperatures (30°C and 35°C), which suggest that the HD adsorption by MEAC performed better at reduced temperatures. The high R2 values achieved for the PFO and the PSO is an indication that the HD adsorption process was pseudo chemical in nature. The PSO model at a lower temperature was adjudged the best fit model since a higher R2 values indicates a better model fit. Although the R2 of PFO were higher than 0.9, the qe,exp did not agree with the qecal. Therefore, PFO kinetic model could notsatisfactorily describe the HD adsorption onto MEAC. However, for PSO, the qe,exp was closer to the qecal value. This depicts that PSO model gave a good correlation for the HD adsorption onto MEAC in comparison to the PFO kinetic model obtained.
In comparison, the Elovich model presented a lower value of R2 among the three kinetic models studied (Table 4). In the Elovich kinetic model equation, parameter β depicts the desorption constant. Therefore, the high values of β at lower temperatures suggest that the adsorption process in this study was reversible. Though, the R2 value obtained for Elovich model showed 80% prediction which is relatively high and acceptable, however, it is not as efficient as the PFO and the PFO in the modeling of HD removal from aqueous solution using MEAC.
| Isotherms | Temperature (°C) | |||||
|---|---|---|---|---|---|---|
| 60 | 50 | 40 | 35 | 30 | ||
| PFO | Qe,exp | 9.571 | 9.720 | 9.805 | 9.847 | 9.923 |
| Qe,cal | 10.220 | 9.860 | 13.411 | 15.072 | 11.304 | |
| K1 | 0.1218 | 0.1222 | 0.1519 | 0.1172 | 0.1262 | |
| R2 | 0.844 | 0.8164 | 0.805 | 0.9417 | 0.9665 | |
| PSO | Qe,exp | 9.571 | 9.720 | 9.805 | 9.847 | 9.923 |
| Qe,cal | 10.432 | 9.690 | 9.899 | 9.910 | 9.892 | |
| K2 | 7.771 | 4.00 | 4.123 | 4.124 | 4.00 | |
| R2 | 0.877 | 0.861 | 0.971 | 0.988 | 0.999 | |
| Elovich | α | 10.1 | 12.0 | 13.3 | 13.4 | 13.7 |
| β | 0.3481 | 0.2701 | 0. 2533 | 4.2522 | 10.2453 | |
| R2 | 0.8047 | 0.8591 | 0.8846 | 0.8622 | 0.8123 | |
| IPD | Kd | 0.0413 | 0.0524 | 0.0552 | 0.0559 | 0.0587 |
| C | 9.184 | 9.206 | 9.259 | 9.30 | 9.364 | |
| R2 | 0.923 | 0.935 | 0.958 | 0.959 | 0.961 | |
TABLE 4. Regressed kinetic data.
Adsorption mechanism
The most important factor governing the adsorption kinetics is the adsorption mechanism. Alkan, et al. posited that the Intra Particle Diffusion (IPD) model examines the influence of mass transfer resistance on an adsorbent affinity towards an adsorbate. It also assumes that in most adsorption process, the adsorbate removal differs almost proportionately with the square root of adsorption time (t1/2) rather than with the adsorption time t. The mass transfers in the adsorption process are controlled by various relationships, which include; initial boundary factors, liquid-solid phase coupling and adsorption mechanism. As shown in Figure 7 the first stage (AB) shows increased uptake of HD by MEAC. This behavior could be attributed to the HD molecules diffusion into the internal pores of MEAC. The second stage (BC), also known as the intra particle diffusion stage depicts a reduction in the rate of HD adsorption unto MEAC surface. The third stage (CD) is the stage of HD diffusion via smaller MEAC pores spaces which are followed by the equilibrium adsorption establishment.
The model constant of IPD, Kd and C were estimated from the plots of qt (mg/g) versus t1/2 and are presented in Table 4 andFigure 7. The plots showed the existence of non-linear relationships. The plots did not pass through the origin which suggests that even though the IPD was involved in the HD sorption, however, it was not the sole rate controlling step. In IPD plot, C, a proportionality relationship with boundary layers having the observable extent of thickness represents the intercept of the qt (mg/g) versus t1/2 plot. The value of C obtained was observed to increase as solution temperatures decreased. This suggests that at high temperature, the HD adsorption on MEAC is not favorable. The high C values evaluated for all the solution temperatures considered suggest an improved HD adsorption capacity. Similar observations have been reported in literatures.

FIG 7: Intra particle diffusion at various solution temperatures.
Adsorption thermodynamics
The thermodynamics of adsorption process are employed to study the driving force of adsorption process. It is used to determine whether the process is favourable, spontaneous or not. The adsorption thermodynamic parameters are enthalpy (ΔH), entropy (ΔS) and Gibb’s free energy (ΔG) and are calculated from the equations 11-14.
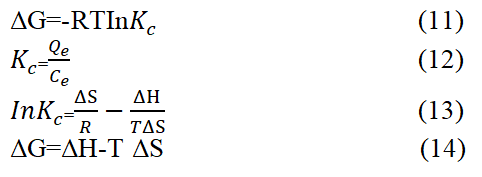
Where qe represent the quantity of adsorbed HD per unit weight of MEAC (g−1), Ce is the equilibrium concentration of HD in thebulk HD solution (mg L−1). Kc represent the thermodynamic constant, the universal gas constant (8.314 J/mol.K) is representedby R and the absolute temperature (K) is represented by T.
The result presented in Table 5 revealed that ΔG values increased negatively as the solution temperature increase. This observation shows that the HD adsorption process was feasible and spontaneous. It is observed in the Table 5 that the ΔG values obtained at a particular solution temperature had close numerical differences suggesting that such spontaneity is independent of the solution temperature during the adsorption process. The values of entropy change (ΔS) were negative and remained constant with temperature. The ΔS value obtained was negative. This negative value corresponds to a reduction in the extent of freedom of the adsorbed HD molecules, which suggests strong interactions existing between the adsorbed HD molecules and the adsorbent, MEAC. There is also greater order of reaction during the HD adsorption onto MEAC surface indicated by the negative ΔS values. This also reflects the affinity of the MEAC adsorbent for HD molecules. The entropy value negative (ΔH) obtained was negative and suggests that the adsorption of HD molecule was exothermic nature. The ΔH values for MEAC were lower than 84 kJ·mol-1 and indicates that the sorption of HD was physical in nature. Overall the HD adsorption onto MEAC was exothermic in nature. Ghadah, et al., Ahlam, et al., have reported similar findings.
| Adsorbent | Temperature (k) | ΔG (KJ/mol) | ΔH (KJ/mol) | ΔS (J/mol K) |
|---|---|---|---|---|
| MEAC | 303 | -12527.4 | -47137.9 | -114.226 |
| 308 | -11956.3 | |||
| 313 | -11385.1 | |||
| 323 | -10242.9 | |||
| 333 | -9100.61 |
TABLE 5. Thermodynamic parameters for HD adsorption.
Comparing the adsorptive capacity of MEAC for HD uptake
The adsorption capacity of MEAC was compared to other adsorbents that have been previously used to remove dye from aqueous solution and the results were presented in Table 6. According to the findings in the Table 6 MEAC is a potential and promising adsorbents for HD uptake from contaminated water. When the finding of this report is compared to other reported adsorbents, it was observed that the present study took place at a lower temperature, 30°C with a comparatively high adsorption capacity (45.045 mg/g). The adsorbent used in this study were cheap and readily available and their use in the treatment of effluent could help remove them from the environment as they constitute pollutant. Based on these results obtained and in comparison with other reported adsorbents, MEAC could be considered among the best promising adsorbents for the HD uptake from wastewater effluent.
| Adsorbent | Adsorbate | Temp. (°C) |
Uptake capacity (mg/g) |
|---|---|---|---|
| Hybrid ion exchanger | Rhodamine B | 50 | 1.23 |
| Kolanut shell | Phenol red | 30 | 24.272 |
| Kolanut shell | Orange G | 30 | 33.113 |
| ZSM-5 | Rhodamin B | 30 | 128.21 |
| ZSM-5 | Methylene blue | 30 | 97.08 |
| Bentonite | Rhodamine B | 25 | 9.434 |
| Bentonite | Malachite green | 25 | 55.556 |
| C7269DR resin | Rhodamin B | 25 | 164 |
| MEAC | HB | 30 | 45.045 |
TABLE 6. Comparative analysis of adsorptive capacity of MEAC with other adsorbents.
Nomenclature
A= Temkpin constant, l/g
Ce= Equilibrium concentration, mg/l
Co= Initial concentration, mg/l
Ct= Concentration at time t, mg/l
ΔG= Free energy change, kJ/mol
ΔH, Enthalpy change, kJ/mol
K1= Pseudo first order kinetic constant
K2= Pseudo second order kinetic constant
Kf= Freundlich constants, l/g
n = Freundlich constants
Q = Adsorption capacity, mg/g
Qe= Adsorption capacity at equilibrium, mg/g
qm= maximum adsorption capacity for a complete monolayer coverage
qt=Adsorption capacity at time t, mg/g
R= Universal gas constants, J/mol K
RL= Dimensional separation factor
ΔS, Entropy change, J/mol K
t=Time, min
T=Temperature, K
W=Weight of adsorbent
Conclusion
Mango seed endocarp was successfully used to produce activated carbon for the adsorption of HD from synthetic textile effluent. The experiment findings showed that the HD adsorption onto MEAC adsorbent was dependent on the initial concentration of HD in solution, solution pH, solution temperature and adsorbent dosage. SEM analysis showed that there was surface deposition of HD molecules onto the pore surface of MEAC after the adsorption process. FTIR spectral showed appearance of some peaks, disappearance of peaks and shifts of some peaks during the adsorption of HD. The BET surface area analysis showed that the specific surface area of the adsorbent before activation process and after activation of the adsorbent and after adsorption were 452.36 m2/g, 892.16 m2/g and 687.894 m2/g, respectively.
The experimental data were best fitted to Langmuir and Freundlich isotherm model. The best kinetic model for the experimental data was pseudo second order kinetic model. The intra particle diffusion model was not the sole rate controlling step of the adsorption of HD molecules from the solution by MEAC. The thermodynamic parameters estimated revealed that the HD adsorption process unto MEAC was feasible, exothermic and spontaneous.
Acknowledgements
We acknowledge the department of chemical engineering, Nnamdi Azikiwe University, Awka Anambra state for their supports in providing laboratory equipment used in this research. We also acknowledge the department of chemical engineering, Ahmadu Bello University Zaria for providing us with FTIR, BET and SEM analysis in this research.
References
- Cardoso NF, Pinto RB, Lima EC, et al. Removal of remazol black B textile dye from aqueous solution by adsorption. Desalination. 2011;269(1-3):92-103.
- Gupta SS, Bhattacharyya KG. Kinetics of adsorption of metal ions on inorganic materials: A review. Adv Colloid Interface Sci. 2011;162(1-2):39-58.
[Crossref] [Google Scholar] [PubMed]
- Rahdar S, Ahmadabadi M, Bazrafshan E, et al. Evaluation of methylene blue removal from aqueous solution using peanut shell powder. Tolooebehdasht. 2016;15(1):36-50.
- Al-Othman ZA, Ali R, Naushad M. Hexavalent chromium removal from aqueous medium by activated carbon prepared from peanut shell: Adsorption kinetics, equilibrium and thermodynamic studies. Chem Eng J. 2012;184:238-247.
- Asfaram A, Ghaedi M, Dashtian K, et al. Preparation and characterization of Mn04Zn06Fe2O4 nanoparticles supported on dead cells of Yarrowia lipolytica as a novel and efficient adsorbent/biosorbent composite for the removal of Azo food dyes: Central composite design optimization study. ACS Sustain Chem Eng. 2018;6(4):4549-4563.
- Cheng ZL, Li YX, Liu Z. Novel adsorption materials based on graphene oxide/Beta zeolite composite materials and their adsorption performance for rhodamine B. J Alloys Compd. 2017;708:255-263.
- Akpomie GK, Ogbu IC, Osunkunle AA, et al. Equilibrium isotherm studies on the sorption of Pb(II) from solution by Ehandiagu clay. J Emerg Trends Eng Appl Sci. 2012;3(2):354-358.
[Crossref]
- Abonyi MN, Aniagor CO, Menkiti MC. Effective dephenolation of effluent from petroleum industry using ionic liquid induced hybrid adsorbent. Arab J Sci Eng. 2019;44(12):10017-10029.
- Nwabanne JT, Mordi MI. Equilibrium uptake and sorption dynamics for the removal of a basic dye using bamboo. Afr J Biotechnol. 2009;8(8):1555-1559.
- Menkiti MC, Aniagor CO. Parametric studies on descriptive isotherms for the uptake of crystal violet dye from aqueous solution onto lignin rich adsorbent. Arab J Sci Eng. 2018;43(5):2375-2392.
- Weber Jr WJ, Morris JC. Kinetics of adsorption on carbon from solution. J Sanit Eng Div. 1963;89(2):31-59.
- Bello OS, Siang TT, Ahmad MA. Adsorption of remazol brilliant violet‐5R reactive dye from aqueous solution by cocoa pod husk based activated carbon: Kinetic, equilibrium and thermodynamic studies. Asia Pac J Chem Eng. 2012;7(3):378-388.
- Ahmad MA, Afandi NS, Adegoke KA, et al. Optimization and batch studies on adsorption of malachite green dye using rambutan seed activated carbon. Desalin Water Treat. 2016;57(45):21487-21511.
- Li Z, Sellaoui L, Dotto GL, et al. Understanding the adsorption mechanism of phenol and 2-nitrophenol on a biopolymer based biochar in single and binary systems via advanced modeling analysis. Chem Eng J. 2019;371:1-6.
- Sills DL, Gossett JM. Using FTIR to predict saccharification from enzymatic hydrolysis of alkali pretreated biomasses. Biotechnol Bioeng. 2012;109(2):353-362.
[Crossref] [Google Scholar] [PubMed]
- Garside P, Wyeth P. Identification of cellulosic fibers by FTIR spectroscopy thread and single fiber analysis by attenuated total reflectance. Stud Conserv. 2003;48(4):269-275.
- Chen X, Jeyaseelan S, Graham N. Physical and chemical properties study of the activated carbon made from sewage sludge. Waste Manag. 2002;22(7):755-760.
[Crossref] [Google Scholar] [PubMed]
- Asadullah M, Asaduzzaman M, Kabir MS, et al. Chemical and structural evaluation of activated carbon prepared from jute sticks for brilliant green dye removal from aqueous solution. J Hazard Mater. 2010;174(1-3):437-443.
[Crossref] [Google Scholar] [PubMed]
- Shirsath DS, Shrivastava VS. Removal of hazardous dye Ponceau-S by using chitin: An organic bioadsorbent. Afr J Environ Sci Technol. 2012;6(2):115-124.
- Bello OS, Lasisi BM, Adigun OJ, et al. Scavenging Rhoda mine B dye using Moringa oleifera seed pod. Chem Speciat Bioavailab. 2017;29(1):120-34.
- Yang J, Yu S, Chen W, et al. Rhodamine B removal from aqueous solution by CT269DR resin: Static and dynamic study. Adsorp Sci Technol. 2019;37(9-10):709-728.
- Akeremale OK, Olaseni SE. Comparative studies on the adsorption of Rhodamine B and malachite green from simulated wastewater onto bentonite clay. Chem Search J. 2019;10(2):30-40.