Original Article
, Volume: 15( 4)Kinetic and Equilibrium Studies of Malachite Green Adsorption by Low Cost Adsorbent
- *Correspondence:
- Saravanan Narayanan , Department of Chemistry, Nandha Engineering College, Erode, Tamil Nadu, India, Tel: 8870455664; E-mail: saranchemistry2002@gmail.com
Received: July 04, 2017; Accepted: August 21, 2017; Published: August 30, 2017
Citation:Narayanan S, Govindasamy R. Kinetic and Equilibrium Studies of Malachite Green Adsorption by Low Cost Adsorbent. Int J Chem Sci. 2017;15(4):189.
Abstract
In the present study, the adsorption capacity of waste materials of copper pod flowers was determined for the removal of Malachite green dye from aqueous solutions. The adsorption capacity was determined as a function of contact time, adsorbent dosage, initial metal ion concentration, pH and temperature. The optimum contact time, adsorbent dosage, pH and temperature were found to be 100 min, 1 g, pH 7 and 30C respectively. The characterization of the adsorbent was identified by using scanning electron microscope and X-Ray diffraction data. The adsorption equilibrium data have been analyzed using Freundlich and Langmuir isotherm model. Equilibrium adsorption data obeyed Freundlich isotherm model. The adsorption kinetic data were studied using pseudo-first order, pseudo-second order kinetic models and intra particle diffusion. It was found that the adsorption of Malachite green dye onto activated carbon followed pseudo-second order kinetic model. The results clearly indicate that the activated carbon produced from copper pod flower could be employed as a low-cost and an easily available adsorbent for the elimination of Malachite green dye from waste water.
Keywords
Copper pod; Dye; Adsorption; Isotherm; Kinetic
Introduction
The various types of dyes are widely used in textile industry in a variety of chemical processes. The dye containing wastewater from the textile industry is directly released into the nearby water bodies [1,2]. These wastewaters have polluted nearby water bodies and have been reported to be slightly toxic even at low concentration [3]. The contamination of water by dye is a worldwide environmental problem [4,5]. Several methods have been used to remove dyes from textile waste water before discharge into the nearby water bodies [6]. Some conventional methods such as membrane process, electrochemical techniques, reverse osmosis, coagulation, flocculation, ultra-filtration, biological process, chemical reaction, photo oxidation, precipitation have been used for eliminating dyes from textile waste water [7,8]. Most of these methods are expensive due to their high capital and operational costs [9,10]. Among these methods, activated carbon is a widely used method for removal of colour from wastewater because of its well-developed porous structure and tremendous surface area [11,12]. In the present study, copper pod flower has been used as a new low-cost adsorbent for removal of dye from textile waste water.
Materials and Methods
Adsorbent preparation
The present studies copper pod flowers were used as adsorbent for the removal Malachite green dye from aqueous solution. They were collected from in around PSG College of Arts and Science, Coimbatore District, Tamil Nadu, India which were available in abundant.
The copper pod flowers were washed thoroughly with ordinary tap water to remove any dust and twice with distilled water. The washed materials were dried in sun light to evaporate the moisture present in it. The dried materials were kept in muffle furnace. The carbonized material was ground to fine powder and then sieved with a particle size of 125 µm. The sieved adsorbent sample prepared was kept in an airtight container and used for further adsorption studies.
Preparation of adsorbate
A stock solution of 1000 mg/L was prepared by dissolving 1 g of Malachite green dye in a 1 L of distilled water. All working solutions used in tests were prepared by diluting the stock solution with distilled water to get the appropriate concentration. The dye concentration was determined using UV/visible spectrometer at a λmax value of 617 nm.
Effect of adsorbent dosage
The effect of adsorbent dosage on removal of dye was studied in range of 0.1 g to1 g.
Effect of contact time
The effect of contact time on the amount of dye removal was studied for a period of 100 min and with dye concentration of 10 mg/L to 50 mg/L.
Effect of pH
The effect of pH on adsorption of dye was studied by varying the initial pH of the solution from 2 to 12. The pH of the solution was adjusted using 0.1 M HCl or 0.1 M NaOH.
Effect of temperature
The effect of temperature on adsorption of dye from aqueous solution was studied by varying the temperature from 30?C to 60?C.
Results and Discussion
Effect of contact time and initial dye concentration
The adsorption capacity of Malachite green dye onto activated carbon at different initial concentrations is shown in FIG. 1

Figure 1: Effect of initial concentrations on the adsorption of Malachite green onto copper pod.
The results obtained indicate that the percentage of dye removal increased with contact time rapidly and became constant when equilibrium was attained [13,14]. The percentage of dye removal increased with increase in initial dye concentration [15]. It was found that the percentage of dye removal dependent on the concentration of the dye.
Effect of adsorbent dosage
The effect of adsorbent dosage with activated carbon used as adsorbent for removal dye is shown in FIG. 2. From the FIG. 2. it was observed that increased adsorbent dosages increased the percentage removal of dye [5]. Higher dosage of adsorbent increased the adsorption due to more surface area and functional groups are available on the adsorbent [16].

Figure 2: Effect of adsorbent dosages on the adsorption of Malachite green onto copper pod.
Effect of pH
The effect of pH on the percentage removal of dye is shown in FIG. 3 . From the figure, it is indicating that the percentage of dye removal was increased up to pH 7. The maximum percentage of dye removal was obtained at pH 7 for all the concentration of the dye solution [14]. At low pH, the adsorbent surface becomes negatively charged and favors uptake of cationic dyes due to increased electrostatic forces of attraction [17]. At high pH, the adsorbent surface becomes positively charged and high concentration of H+ ions which compete with cationic Malachite green dye causing decrease in dye uptake [8,18].

Figure 3: Effect of pH on the adsorption of Malachite green onto copper pod.
Effect of temperature
The effect of temperature on the percentage of dye removal is shown in FIG. 4 . The adsorption capacities of Malachite green dye decreased with the incremental temperature from 30?C to 60?C for 40 mg/L. It is because higher temperature may decrease the adsorptive forces between the dye molecules and active sites on the adsorbent [10,12]. The maximum percentage removal of dye was obtained at 30?C. Therefore, adsorption process is exothermic in nature [19].

Figure 4: Effect of temperature on the adsorption of Malachite green onto copper pod.
Scanning electron microscope analysis
The SEM photograph of the adsorbent is shown in FIG. 5. From the figure, it was observed that wide varieties of pores are present in the activated carbon increase active sites [10].

Figure 5: SEM image of activated carbon.
Powder X-ray diffraction study
The powder X-ray diffraction analysis of sample investigated and displayed in FIG. 6. In activated carbons, a broad peak due to reflections from the planes can be clearly seen. The broadness of the peak indicates the amorphous nature of the carbon sample [18,20].

Figure 6: XRD pattern for prepared activated carbon.
FIG. 6 shows XRD spectrum of the adsorbent. This spectrum clearly shows that the particle size is responsible for the broadening peaks in the XRD pattern [21]. This spectrum also indicates that the presence of amorphous form of carbon which is disorderly stacked up by carbon rings [2,22].
Analysis of adsorption kinetics
The study of adsorption kinetics is an important characteristic in describing the efficiency of adsorption process [10]. Various kinetic models can be used to analyze the adsorption process. The pseudo-first order and pseudo-second order kinetic models are the most widely used models for the adsorption of solutes from a liquid solution.
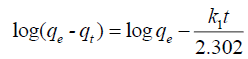
Pseudo-first order equation: The pseudo-first order equation of Lagergen is expressed as follows:
 (1)
(1)
Where, qe is the amount of dye removed at equilibrium (mg/g),
qt is the amount of dye removed at time t (mg/g),
K1is the pseudo-first order rate constant (min-1)
The plot of log (qe-qt) vs. time (t) gives a linear relationship and is shown in FIG. 7. The values of k1 and calculated qe were determined from the slope and intercept of the linear plot. The pseudo-first order rate constant (k1), correlation coefficients (R2), experimental qe values and calculated qe values are listed in TABLE 1. From TABLE 1 it was noticed that large deviation between calculated qe values and the experimental qe values [23]. It can be concluded that the adsorption of Malachite green dye on copper pod flower not obeys the pseudo-first order reaction.

Figure 7: Pseudo-first order kinetics for adsorption of Malachite green onto prepared activated carbon at 30°C.
| Intial conc. (ppm) | Pseudo-first order kinetic model | Pseudo-second order kinetic model | ||||||||
|---|---|---|---|---|---|---|---|---|---|---|
| qeexp (ppm) | qecal (ppm) | k1 (ppm) |
R2 | qeexp (ppm) | qecal (ppm) | k2 (ppm) |
R2 | |||
| 10 | 9.87 | 1.27 | 0.0092 | 0.235 | 9.87 | 10 | 0.0469 | 0.999 | ||
| 20 | 19.59 | 1.09 | 0.0161 | 0.358 | 19.59 | 20 | 0.0396 | 0.999 | ||
| 30 | 29.75 | 2.81 | 0.0184 | 0.674 | 29.75 | 30 | 0.0167 | 0.999 | ||
| 40 | 38.72 | 4.21 | 0.0253 | 0.631 | 38.72 | 40 | 0.0132 | 0.999 | ||
| 50 | 47.68 | 8.27 | 0.0253 | 0.865 | 47.68 | 50 | 0.0067 | 0.999 | ||
TABLE 1. Pseudo-first and pseudo-second order kinetic parameters for different initial dye concentration.
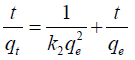
Pseudo-second order equation: The pseudo-second order equation is expressed as follows:
 (2)
(2)
Where, qe is the amount of dye removed at equilibrium (mg/g)
qt is the amount of dye removed at time t (mg/g),
k2 is the pseudo-second order rate constant (min-1).
If the pseudo-second order kinetic model is follow, the plot of  vs. t should give a linear relationship. k2 and qe values can be determined from the slope and intercept of the plot are presented in TABLE 1. The FIG. 8 shows various initial dye concentration of pseudo-second order kinetic model. The pseudo-first order and pseudo-second order rate reaction rate constants, correlation coefficients (R2), experimental data qe and calculated qe values are listed in TABLE 1. From the TABLE 1, it was noticed that R2 values for the pseudo-second order kinetic model were found to be higher than that of the pseudo-first order kinetic model for all initial dye concentrations [18,24]. The calculated qe values obtained from the pseudosecond order kinetics model good agreement with the experimental qe values [20,25]. The adsorption of Malachite green dye on copper pod flower is well suitable for the pseudo-second order kinetics model with very high correlation coefficients (R2).

Figure 8: Pseudo second order kinetics for the adsorption of Malachite green onto prepared activated carbon at 30°C.
Intra particle diffusion studies: The Intraparticle diffusion model is used for confirming the mechanism of the adsorption process [26]. Intraparticle diffusion (kd) is given by weber morris and is expressed as follows:
 (3)
(3)
Where, qt is the amount adsorbed (mgg-1) at time t (min),
Kdis the rate constant of intra particle diffusion (mgg-1 min1/2).
The plot of amount adsorbed (qt) vs. time gives straight line and is shown in FIG. 9. The rate constant of intra particle diffusion (kd) can be determined from slope of the straight line and the values are listed in TABLE 2. The linear portion of the plot at each concentration did not pass through the origin suggesting that intraparticle diffusion was not the only rate controlling step [2,22]. The high correlation coefficient (R2) values (R2=0.922–0.998) obtained at each concentration indicated that the pore diffusion plays a significant role for the adsorption of Malachite green dye onto the activated carbon prepared from copper pod flower.
| Initial concentration (ppm) | Intra particle diffusion model | ||
|---|---|---|---|
| C | Kd (mg/g.min) | R2 | |
| 10 | 8.64 | 0.111 | 0.937 |
| 20 | 17.99 | 0.160 | 0.998 |
| 30 | 26.28 | 0.331 | 0.978 |
| 40 | 34.17 | 0.462 | 0.988 |
| 50 | 38.30 | 0.959 | 0.922 |
TABLE 2. Intra particle diffusion model.

Figure 9: Intra particle diffusion for the adsorption of Malachite green onto prepared activated carbon at 30°C.
Adsorption isotherm
The adsorption isotherm describes the mechanism of the adsorption process between the adsorbate and the adsorbent [27]. The Langmuir and Freundlich isotherm were analyzed to study the adsorption isotherm of dye.
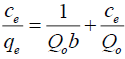
Langmuir isotherm: The Langmuir isotherm equation is expressed as follows:
 (4)
(4)
Where, qe is the amount of dye adsorbed at equilibrium (mgg-1),
Ce is the concentration of dye solution at equilibrium (mgL-1),
Qo is Langmuir constant related to adsorption capacity (mgg-1),
b is Langmuir constant related to rate of adsorption (Lmg-1),
The plot of  vs. ce gives a straight line with slope of
  and intercept of
  and is shown in FIG. 10. The constants Qo and b values were determined by from slope and intercept of the plot and the values are listed in TABLE 3.

Figure 10: Langmuir isotherm for the adsorption of Malachite green onto prepared activated carbon.
| Temp. (Dc) | Langmuir constants | ||
|---|---|---|---|
| R2 | Q0 (mg/g) | b. (L/mg) | |
| 30 | 0.230 | 1000 | 0.0133 |
| 40 | 0.120 | 500 | 0.0183 |
| 45 | 0.047 | 1000 | 0.0059 |
| 50 | 0.199 | 500 | 0.0087 |
| 55 | 0.120 | 1000 | 0.0039 |
| 60 | 0.210 | 333 | 0.0100 |
TABLE 3. Langmuir isotherm parameters.
The constants Qo, b and correlation co-efficient (R2) values are given in TABLE 4. The value of R2 is regarded as a measure of the goodness-of-fit of experimental data. The experimental data shows that the amount of dye adsorbed on activated carbon decreased with increasing adsorption temperature [15,25]. The essential characteristics of Langmuir isotherm equation can be expressed in terms of dimensionless separation factor, RL, which is defined by the following equation.
| Initial dye | RL Value | |||||
|---|---|---|---|---|---|---|
| Concentration (ppm) | 30°C | 40°C | 45°C | 50°C | 55°C | 60°C |
| 10 | 0.8823 | 0.8449 | 0.9441 | 0.9196 | 0.9619 | 0.9085 |
| 20 | 0.7894 | 0.7315 | 0.8941 | 0.8513 | 0.9267 | 0.8324 |
| 30 | 0.7142 | 0.6449 | 0.8492 | 0.7923 | 0.8939 | 0.7680 |
| 40 | 0.6521 | 0.5767 | 0.8086 | 0.7411 | 0.8634 | 0.7129 |
| 50 | 0.6000 | 0.5215 | 0.7716 | 0.6960 | 0.8349 | 0.6651 |
TABLE 4. RL values at various initial dye concentrations.
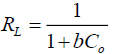 (5)
(5)
Where, C0 is the initial concentration of dye solution (mgL-1) and b is the Langmuir constant. The value of RL indicates that the shape of the adsorption isotherm to be either linear (RL=1), favourable (0< RL <1), unfavourable (RL>1), or irreversible (RL=0). The values of RL are shown in TABLE 5. The RL values for the present experiment data fall between 0 and 1, which is an indication of the favourable adsorption process [2,12].
| Temp. (0°C) | Statistical parameters/Constants | ||
|---|---|---|---|
| R2 | n | Kf (mg/L) | |
| 30°C | 0.983 | 0.9090 | 12.94 |
| 40°C | 0.963 | 0.8849 | 8.33 |
| 45°C | 0.966 | 0.9285 | 5.43 |
| 50°C | 0.983 | 0.9066 | 3.87 |
| 55°C | 0.977 | 0.9182 | 3.53 |
| 60°C | 0.967 | 0.8741 | 2.81 |
TABLE 5. Freundlich isotherm parameters.
Freundlich isotherm: The Freundlich isotherm equation was given by,
 (6)
(6)
Where, qe is the amount of dye adsorbed (mgg-1),
Ce is the concentration of dye solution at equilibrium (mgL-1),
kf is Freundlich constant related to the adsorption capacity of adsorbent,
n is Freundlich constant related to the adsorption intensity,
kf and n values can be calculated from the slope of the straight line and is shown in FIG. 11.

Figure 11: Freundlich isotherm for the adsorption of Malachite green onto prepared activated carbon.
The value of R2 and Kf indicates that adsorption was favourable. The value of n which is less than 1 indicates that the dyes are favourably adsorbed by adsorbent [28]. The smaller value of n indicates that better adsorption mechanism and formation of stronger bond between dye molecules and activated carbon. The value of Kf also indicates that adsorption capacity of the adsorbent. The higher the Kf values greater is the adsorption capacity of an adsorbent. The value of R2 is used to measure goodness of fit of experimental results on the adsorption isotherm models [8,29]. The values of correlation co-efficient (R2) for Freundlich isotherm model is higher than the Langmuir isotherm model [9,10]. This shows that the experimental data was better explained by the Freundlich isotherm model (R2=0.963 to 0.983) compared to the Langmuir isotherm model [3]. This indicates that the adsorption of Malachite green dye on copper pod flower takes place as monolayer adsorption on the adsorbent surface, homogenous in adsorption affinity.
Conclusion
? The adsorption of Malachite green dye from aqueous solution using copper pod flower as the low-cost adsorbent was investigated in batch process.
? The adsorption process was contact time, adsorbent dosage, pH, and initial metal ion concentration dependent.
? The equilibrium adsorption isotherm data was best represented by Freundlich isotherm model better than Langmuir isotherm model.
? From the kinetic data, it was found that adsorption of Malachite green dye using activated carbon is explained well by pseudo-second order kinetic model.
? Kinetic data results indicate that intraparticle diffusion is not only the rate limiting step of the adsorption process.
? RL values indicate favorable adsorption process.
? From the experimental results, it was observed that the optimum pH was found to be pH=7.
? Kinetic and equilibrium data revealed that dye removal by the studied adsorbents proceeded through physical adsorption and chemical adsorption mechanisms.
? Finally, the results clearly indicated that copper pod flower could be used as an alternative to highly efficient low cost and abundant materials for removal of Malachite green dye from contaminated aqueous solutions.
References
- Gong R, Jin Y, Chen F, et al. Enhanced Malachite green removal from aqueous solution by citric acid modified rice straw. J Hazard Mater. 2006;137:865-70.
- Zhang J, Li Y, Zhang C, et al. Adsorption of Malachite green from aqueous solution onto carbon prepared from Arundodonax root. J Hazard Mater. 2008;50:774.
- Jayaranjan M, Arunachalam R, Annadurai G. Use of low cost nano-porous materials of pamelo fruit peel wastes in removal of textile dye. Research Journal of Environmental Sciences. 2011;55:434-43.
- Ponnusami V, Kritika V, Madhuram R, et al. Biosorption of reactive dye using acid-treated rice husk. J Hazard Mater. 2007;142:397-403.
- Namasivayam C, Muniasamy N, Gayatri K, et al. Removal of dyes from aqueous solution by cellulosic waste orange peel. Bioresource Technology. 1996;pp:37-43.
- Soma sekhara RMC. Removal of direct dye from aqueous solutions with an adsorbent made from tamarind fruit shell, an agricultural solid waste. Journal of Scientific & Industrial Research. 2006;65:443-6.
- Ranganathan K, Karunagaran K, Sharma DC. Recycling of wastewaters of textile dyeing industries using advanced treatment technology and cost analysis: Case studies. Resources, Conservation and Recycling. 2007;50:306-18.
- Theivarasu Mylsamy S, Sivakumar N. Coca shell as adsorbent for the removal of methylene blue from aqueous solution: Kinetic and equilibrium study. Universal Journal of Environmental Research and Technology. 2011;70-78.
- Sivaraj R. Orange peel as an adsorbent in the removal of acid violet 17 from aqueous solutions. Waste Management. 2001;21:105-10.
- Grag VK, Raksh K, Renuka G. Removal of Malachite green dye from aqueous solution by adsorption using agroindustries waste, A case study of phosopisceneria. Dyes and Pigments. 2004;62:1-10.
- Gupta VK, Mittal A, Krishnan L, et al. Adsorption kinetics and column operations for the removal and recovery of Malachite green from wastewater using bottom ash. Separa Puri Technol. 2004;40:87-96.
- Velmurugan P, Rathina Kumar V, Dhinakaran G. Dye removal from aqueous solution using low cost adsorbent. International Journal of Environmental Sciences. 2011;7:1492-503.
- Hameed BH, Ahmad AL, Latiff KNA. Adsorption of basic dye (methylene blue) onto activated carbon prepared from rattan sawdust. Dyes and Pigments. 2006;75:143-9.
- Papita S. Assessmant on the removal of methylene blue dye using tamarind fruit shell as biosorbent. Springer Science. 2010;213:287-99.
- Jain AK, Gupta VK, Bhatnagar A, et al. Utilization of industrial waste products as adsorbents for the removal of dyes. J Hazard Mater. 2003;101:31-42.
- Namasivayam C, Kanchana N. Removal of Congo red from aqueous solution by waste banana pith. Pertanika J Sci and Techno. 1993;1:33-42.
- Yavuz O, Aydin H. Removal of direct dyes from aqueous solution using various adsorbents. Polish Journal of Environmental Studies. 2006;15:155-61.
- Annadurai A. Use of cellulose-based wastes for adsorption of dyes from aqueous solutions. Journal of Hazardous Materials. 2002;92:263-74.
- Wang S, Boyjoo Y, Choueib A. A comparative study of dye removal using fly ash treated by different methods. Chemosphere. 2005;60:1401-7.
- Rahman IA, Saad B, Shaidan S, et al. Adsorption Characteristics of Malachite green on activated carbon derived from rice husks produced by chemical-thermal process. Bioresour Technol. 2005;96:1578-83.
- Gupta VK, Srivastava SK, Mohan D. Equilibrium uptake, sorption dynamics, process optimization and column operations for the removal and recovery of Malachite green from wastewater using activated carbon and activated slag. Ind Eng Chem Res. 1997;36:2207-18.
- Tabrez Khan A. Removal of some basic dyes from artificial textile wastewater by adsorption on Akash kinari coal. J Sci Ind Res. 2004;63:355-64.
- Khalid N, Ahmad S. Removal of mercury from aqueous solutions by adsorption to rice husks. Sep Sci Technol. 1999;34:3139-53.
- Praveen S. COD reduction and colour removal of simulated textile mill wastewater by mixed bacterial consortium. Rasayan J Chem. 2010;3:731-5.
- Tabrez Khan A, Imran Ali, VedVati S, et al. Studied the utilization of fly ash as low-cost adsorbent for the removal of methylene blue. Malachite Green and Rhodamine B Dyes from Textile Wastewater. 2009.
- Shahbudeen PS, Syed S. Study of the removal Malachite green from aqueous solution by using solid agriculture waste. Res J of Chem Sci. 2011;1.
- Vadivelan V, Kumar KV. Equilibruim, kinetics, mechanism and process design for the sorption of methylene blue onto rice husk. J Colloid Inter Sci. 2005;286:90-100.
- Sarioglu M, Atay U. Removal methylene blue by using biosolid. Glob Nest J. 2006;8:113-20.
- Rajeshkannan R, Rajamahan N, Rajasimman M. Removal of Malachite green from aqueous solution by sorption on Hydrilla verticillata biomass using response surface methodology. Fron Chem Eng China. 2008;3:146-54.
