Original Article
, Volume: 16( 3)Investigation of New Optical Properties of Cd and Co-doped Ag2S Colloidal Solution
- *Correspondence:
- Hammad TM , Physics Department, Faculty of Science, Al-Azhar University, P.O. Box 1277, Gaza, Palestine, Tel: +9722876672; E-Mail: talaathammad@gmail.com
Received: November 05, 2018; Accepted: November 23, 2018; Published: December 04, 2018
Citation: Hammad TM, Shallah AM, Salem JK. Investigation of New Optical Properties of Cd and Co-doped Ag2S Colloidal Solution. Mat Sci Ind J. 2018;16(3):139
Abstract
In this work we report new optical properties of the Cd and Co-doped Ag2S colloidal solution. Cd and Co-doped Ag2S nanoparticles were prepared using a wet chemical method. The influence of doping on the optical properties of Cd and Co-doped nanoparticles was investigated. The TEM images showed the shape of samples is spherical of average particle size of about 6-18 nm for all pure and doped Ag2S nanoparticles. The absorption spectra of the doped samples are red shifted as compared with of the pure Ag2S samples. The Pl intensity of the Cd-doped Ag2S nanoparticles decreased as Cd concentration was increased. However, the Pl intensity of the Co-doped Ag2S reduced as the concentration of Co is enhanced. The particle sizes as calculated from the absorption spectra were in agreement with the results obtained from TEM.
Keywords
Metal (Cd,Co); Doped-Ag2S; Optica; Photoluminescence
Introduction
It is well known that the chemical composition, shape and size-controlled the properties of semiconductor nanostructured materials [1-6]. Semiconductor nanostructured revealed a good electric, magneto-optical and photochemical properties and greatly differing from those observed in the exact bulk materials due to quantum size effects, resulting from a predominant number of surface atoms in Nano size materials [7,8]. Transition metal chalcogenides are very important semiconductor materials, especially in Nano size because of their excellent photoelectron transformation properties and potential application in physics, chemistry, biology, medicine and materials science and their different interdisciplinary fields, for instances solar cells, sensitive sensor, photon computer, and slow release medicament [9]. The Ag2S is found to be amongst the most important chalcogenides and because of its good optoelectronic properties. Ag2S nanoparticles have been widely investigated due to its many valuable applications in optical and electronic devices [10-14]. Ag2S has a direct band gap (0.9-1.05 eV), mutually large absorption, useful optical limiting, and considerable chemical stability properties [15,16]. Different synthetic methods have been explored to prepare Ag2S nanoparticles, such microemulsions [17], sol-gel, ion implantation techniques [18], template [19], the sonochemical way [20], gamma-irradiation [21] and organic-metallic precursor [22]. Semiconductor Nanocrystals doped with metals turn out new opportunities for luminescent [23] because of the formation of the additional electronic levels among the band gaps and also the modification of the band structure. There are few reports on the investigation of the optical properties of Cd and Co-doped Ag2S nanoparticles in the literature; Ali Fakhri et al., [24] synthesized the Cu doped Ag2S nanoparticles by the aids of simple chemical co-precipitation method. The TEM images showed the products are a spherical shape in with diameter size of 30 nm and the Pl consequence confirmed that the change of emission wavelength is almost between 456 nm and 477 nm. E.S. Aazam prepared Ni-doped Ag2S by using a hydrothermal method and he studied the impact of Ni dopant material on the photocatalytic pastime of Ag2S [25].
The present work focuses on synthesizing the Ag2S nanoparticles doped with Cd and Co by a wet chemical method and their optical properties were presented for the first time in this study.
Experiential Part
Synthesis
Silver sulfate (Ag2S), cadmium sulfate (CdSO4.8H2O), cobalt sulfate (CoSO4.7H2O) and sodium sulfide (Na2S. xH2O) were obtained from Merck and used as precursors. The chemical reagents were of analytical reagent grade and used without further purification. All the glass wares used in this experimental work were acid washed. Distilled water was used for all dilutions and sample preparations. A pure colloidal solution of Ag2S nanoparticle was prepared by a wet chemical method. Initially, 0.1 mmol of AgNO3 was dissolved in 50 ml of distilled water. The obtained solution was added dropwise into 50 mL of 0.1 M Na2S solution with stirring until a transparent pale yellow color solution is obtained. The Cd and Co-doped Ag2S colloidal solution were prepared by adding 25 ml aqueous solution of 0.001M Na2S dropwise to a mixture solution of 25 ml of 0.001M solution of Ag2SO4 and 25 ml of 0.001M solution of CdSO4.8H2O or CoSO4.7H2O with stirring until transparent clear solution is obtained. The colors of solutions depend on the amount and type of dopant. Finally, the prepared colloidal solutions of Ag2S nanoparticles were used for all measurements.
Instrumentation
UV-vis absorption spectra were collected using a UV-vis spectrophotometer (Shimadzu, UV-2400) in the wavelength range from 200 nm to 700 nm. PL spectra were recorded with a spectrofluorometer(JASCO, FP-6500); the extinction wavelength was selected to be 350 nm for Cd-doped Ag2S and 250 nm for Co-doped Ag2S nanoparticles. The Transmission Electron Microscopy (TEM) analysis was done with JEM 2010 (JEOL) transmission electron microscope.
Results and Discussion
FIG. 1 (a-c) indicates the morphology and histograms of un-doped, 6% Cd and 6% Co-doped Ag2S nanoparticles. Spherical to ellipsoid-shaped particles were formed. FIG. 1 (a-c) shows the histograms of pure, Cd-doped Ag2S and Co-doped Ag2S nanoparticles with the average size of the individual particle in different dopants is in 6-18 nm.

Figure 1: TEM images and histograms, a:Undoped Ag2S, b:6% Cd-doped Ag2S and c:6% Co-doped Ag2S.
A UV-vis spectrum analysis study is a powerful technique for studying the influence of doping on the optical properties of Ag2S nanoparticles [26,27]. The absorption spectra of corresponding pure and Cd-doped in Ag2S nanoparticles is illustrated in FIG. 2. The UV-vis spectra displayed continuous absorbance increasing from 230 nm to 800 nm. The optical absorption edge of Ag2S nanoparticles is shifted towards the longer wavelength region with increase the Cd concentration as shown in FIG. 2.

Figure 2: UV-vis spectra of Cd-doped Ag2S nanoparticles.
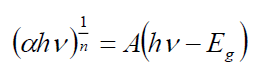
The optical band gap energies of different dopants are estimated by Tauc's relation given as below [28]:
 (2.3)
(2.3)
Where A is the constant and Eg is the band gap energy of the material. The direct band gap of the samples are calculated by plotting (αhv)2 versus hv and then extrapolating the straight portion of the curve on the hv axis at α=0. The straight lines plots shown in FIG. 3 imply that the Cd-doped Ag2S samples have direct energy band gap and the band gap was present between 2.62 to 2.27 eV.

Figure 3: Optical band gap spectra of Cd-doped Ag2S nanoparticles.
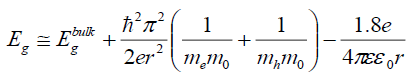
It is clear that the energy gap decreased with the increase in the Cd ions (FIG. 3). This red shift is attributed to increase in the particle size which causes to change in particle energy levels and finally decrease the band gap and redshift occurrence. A similar type of decrease was reported on Cd-doped CdS [29]. The size-dependent of band gap energy of Cd-doped in Ag2S may be obtained using an effective mass approximation as the following equation.
 (2)
(2)
Where Ebulkg is the bulk band gap (eV), ћ is Planck's constant, r is the particle radius, me is the electron effective mass, mh is the hole effective mass, mo is the free electron mass, e is the charge on the electron, ε is the relative permittivity, and εo is the permittivity of free space. Generally, it is accepted that in Ag2S Ebulkg =1.0 eV, me=0.22 m0 and mh=1.096 m0 are, correspondingly, the electron and hole effective masses [30], ε=5.95 is the permittivity [31]. The band gap values of the particles formed with various concentration of the cadmium and the particle sizes calculated using the eq (2) are given in TABLE 1.
| Concentration | Energy gab (ev) | Particle size (nm) |
|---|---|---|
| 0.00 | 2.6 | 5.81 |
| 0.01 | 2.54 | 7.08 |
| 0.02 | 2.45 | 9.46 |
| 0.04 | 2.36 | 11.22 |
| 0.06 | 2.31 | 13.16 |
| 0.08 | 2.29 | 14.26 |
| 0.10 | 2.27 | 15.8 |
Table 1: Band gap values of the particles formed with various concentration of the cadmium and the particle sizes.
It is clearly seen that the band gap energy decreased with increasing the particle size due to the quantum size confinement (FIG. 4). These are in good agreement with the values from TEM. The above results indicate that the dimension of the produced Cd-doped Ag2S nanoparticles and their corresponding optical properties could be controlled by the synthesis method.

Figure 4: Variations of band gap energy with a particle size of Cd-doped Ag2S nanoparticles.
FIG. 5 displays the room temperature optical absorption spectra of the pure Ag2S and Co-doped Ag2S nanoparticles. On substitution Co to Ag2S, the absorption band shifts to red, indicating a decrease in the band gap energy from 2.42 to 2.16 eV (see FIG. 6). The decrease in the band edge is a clear indication for the incorporation of Co inside the Ag2S lattice [27,29]. The redshift of band edge for the cobalt doped samples clearly indicates that Co ions are incorporated into the Ag2S lattice [27]. The band gap values of the Co-doped Ag2S nanoparticles formed with various concentration of the cobalt and the particle sizes estimated using the eq (2) are given in TABLE 2.

Figure 5: UV-vis spectra of Co-doped Ag2S nanoparticles.

Figure 6: Optical band gap spectra of Co-doped Ag2S nanoparticles.
| Concentration | Energy gab (ev) | Particle size (nm) |
|---|---|---|
| 0.00 | 2.6 | 5.81 |
| 0.01 | 2.54 | 7.08 |
| 0.02 | 2.45 | 9.46 |
| 0.04 | 2.36 | 11.22 |
| 0.06 | 2.31 | 13.16 |
| 0.08 | 2.29 | 14.26 |
| 0.10 | 2.27 | 15.8 |
Table 2: The band gap values of the Co-doped Ag2S nanoparticles formed with various concentration of the cobalt and the particle sizes.
The variation of band gap energy with the particle size is shown in FIG. 7. It is clearly seen that the band gap energy decreased with increasing the particle size as a result of the quantum size confinement. The particle size of Co-doped Ag2S was estimated from Brus equation, which matches TEM result.

Figure 7: Variations of band gap energy with a particle size of Co-doped Ag2S nanoparticles.
The PL of the pure Ag2S and Cd-doped Ag2S nanoparticles is studied at room temperature to further investigate the optical properties. FIG. 8 shows the emission spectra of pure and Cd-doped samples (excitation at 350 nm). The spectrum exhibits a broad emission peaks at about 708 for undoped Ag2S, 710 for 1% Cd-doped Ag2S, 711 nm for 2% Cd-doped Ag2S, 713 nm for 4% Cd-doped Ag2S, 715 nm for 6% Cd-doped Ag2S, 716 nm for 8% Cd-doped Ag2S and 718 nm for 10% Cd-doped Ag2S. The strong PL peaks may correspond to crystalline defects induced during the growth. Visible emissions are referred to as deep-level emission and are due to the recombination of electrons deeply trapped in silver interstitials and oxygen vacancies, with photo-generated holes [32]. It is clear that the Pl intensity decreased when the dopants of Cd increased. Cd acts as a trapping site, which captures photogenerated electrons from the conduction band, thus separating the photogenerated electron-hole pairs. It is generally accepted that the incorporation of noble metal nanoparticles into Ag2S [33] enhances the light absorption of the Ag2S nanoparticles in the visible-light region. This effect leads to a shift in the absorption edge toward longer wavelengths, which indicates a decrease in the band gap energy. This effect leads to a shift in the absorption edge toward longer wavelengths, which indicates a decrease in the band gap energy, which is confirmed by UV-vis spectra measurements.

Figure 8: PL spectra of Cd-doped Ag2S nanoparticles.
A similar photoluminescence spectrum was observed for the Co-doped Ag2S nanoparticles as (excitation at 250 nm) seen in FIG. 9. The emission peak in the visible region at 513 nm, 515 nm, 516 nm, 517 nm, 518 nm, 519 nm, and 520 nm are observed for pure and 1%, 2%, 4%, 6%, 8%, 10% Co-doped Ag2S. FIG. 7 also shows that the intensity of these peaks also increases with the doping of Co into Ag2S nanoparticles. A redshift is seen in PL spectra towards higher wavelength after doping Co into Ag2S lattice. An increase within the intensity of the deep trap emission of Co-doped Ag2S is noticed with increasing the concentration of Co. The presence of Co has been reported to enhance the intensity of deep trap emission of bulk Ag2S [34].

Figure 9: PL spectra of Co-doped Ag2S nanoparticles.
The normalized PL spectra of Ag2S doped with Cadmium and cobalt concentrations of 0%, 1%, 2%, 4%, 6%, 8% and 10% are shown in FIG. 10 and 11. Clearly, the observed emission band is red-shifted with the addition of Cd and Co. From TEM observations it is seen that the particle size is increased at higher dopant percentages which confirm the redshift at these concentrations of the Cd and Co dopant. This redshift of the emission peak is due to the quantum confinement effect of the nanocrystals.

Figure 10: Normalized PL spectra of Cd-doped Ag2S nanoparticles.

Figure 11: Normalized PL spectra of Co-doped Ag2S nanoparticles.
Conclusions
Cd and Co-doped Ag2S have been successfully synthesized by a wet chemical method. The TEM results show that the products were a spherical shape with a size of about 6-15 nm for all Cd and Co-doped Ag2S nanoparticles. A red shift phenomenon was found to increase directly with the concentration of Cd and Co doped on to the Ag2S; this effect has been observed in the UV-vis spectra and Pl spectra of Cd-doped Ag2Sand Co-doped Ag2S samples. With an increasing concentration of Cd incorporated in the nanoparticles, the Cd emission intensity decreases while the intensity of red emission of Co increases. A novel PL phenomenon can be observed from the Ag2S nanoparticles doped with Cd2+ and Co2+ ions. This result shows the important roles of dopants in changing the emission color from Ag2S nanoparticles. Therefore, the size calculated using the Brus equation is closer to values obtained from TEM when the size of particles increases due to the quantum size confinement.
References
- Hammad TM, Salem JK, Harrison RG. Synthesis, characterization, and optical properties of Y-doped ZnO nanoparticles. NANO. 2009;4:225-32.
- Hammad TM, Salem JK, Harrison RG. The influence of annealing temperature on the structure, morphologies and optical properties of ZnO nanoparticles. Superlattices and Microstructures. 2010;47:335-40.
- Hammad TM, Salem JK. Synthesis and characterization of Mg-doped ZnO hollow spheres. J Nanopar Res. 2011;13:2205-12.
- Salem JK, Hammad TM, Harrison RR. Synthesis, structural and optical properties of Ni-doped ZnO microspheres. J Mater Sci Mater Electron. 2013;24:1670-76.
- Salem JK, Hammad TM, Kuhn S, et al. Structural and optical properties of Co-doped ZnS nanoparticles synthesized by a capping agent. J Mater Sci Mater Electron. 2014;25:2177-82.
- Salem JK, Hammad TM, Kuhn S, et al. Luminescence properties of Mn and Ni-doped ZnS nanoparticles synthesized by capping agent. J Mater Sci Mater Electron. 2014;25:5188-94.
- Hammad TM, Salem JK, Kuhn S, et al. Optical properties of Cu2+ and Fe2+ doped ZnS semiconductor nanoparticles synthesized by co-precipitation method. J Mater Sci Mater Electron. 2015;26:5495-501.
- Hancock JM, Rankin WM, Hammad TM, et al. Optical and magnetic properties of ZnO nanoparticles doped with Co, Ni and Mn and synthesized at low temperature. J Nanosci Nanotechnol. 2015;15:3809-15.
- Hammad TM, Salem JK, Kuhn S, et al. Surface morphology and optical properties of PVA/PbS nanoparticles. J Lumin. 2015;157:88-92.
- Kear BH, Skandan G. Overview: status and current developments in nanomaterials. Int J Powder Metall. 1999;35:35-7.
- Bagwe RP, Khilar KC. Effects of intermicellar exchange rate on the formation of silver nanoparticles in reverse microemulsions of AOT. Langmuir. 2000;16:905-10.
- Zamiri R, Lemos AF, Reblo A, et al. Effects of rare-earth (Er, La, and Yb) doping on morphology and structure properties of ZnO nanostructures prepared by the wet chemical method. Ceram Int. 2014;40:523-9.
- Qin D, Zhang L, He G, et al. Synthesis of Ag2S nanorods by a biomimetic method in the lysozyme matrix. Mater Res Bull. 2001;48:3644-47.
- Joo J, Na HB, Yu T, et al. Generalized and facile synthesis of semiconducting metal sulfide nanocrystals. J Am Chem Soc. 2003;125:11100-05.
- Ezenwa IA, Okereke NA, Egwunyenga NJ. Optical properties of chemical bath deposited Ag2S thin films. Int J Sci Technol. 2012;2:101-6.
- Hwang I, Yong K. Environmentally benign and efficient Ag2S‐ZnO nanowires as photoanodes for solar cells: Comparison with CdS‐ZnO nanowires. Chem Phys Chem. 2013;14:364-8.
- Liu JC, Raveendran P, Shervani Z, et al. Synthesis of Ag2S quantum dots in water-in-CO2 microemulsions. Chem Commun. 2004;47:2582-3.
- Armelao L, Bertoncello R, Cattaruzza E, et al. Chemical and physical routes for composite materials synthesis: Ag and Ag 2 S nanoparticles in silica glass by sol-gel and ion implantation techniques. J Mater Chem. 2002;12:2401-7.
- Xiao J, Xie Y, Tang R, et al. Template-based synthesis of nanoscale Ag2E (E=S, Se) dendrites. J Mater Chem. 2002;12:1148-51.
- Kumar RV, Palchik O, Koltypin Y, et al. Sonochemical synthesis and characterization of Ag2S/PVA and CuS/PVA nanocomposite. Ultrason Sonochem. 2002;9:65-70.
- Chen M, Xie Y, Chen HY, et al. Qian preparation and characterization of metal sulfides in ethylenediamine under ambient conditions through a γ-irradiation route. J Colloid Interface Sci. 2001;237:47-53.
- Lim WP, Zhang Z, Low HY, et al. Preparation of Ag2S nanocrystals of predictable shape and size. Angew Chem Int Ed. 2004;43:5685-9.
- Bhargava RN, Gallagher D, Welker T. Doped nanocrystals of a semiconductors-a new class of luminescent materials. J Lumin. 1994;60:275-80.
- Fakhri A, Pourmand M, Khakpour R, et al. Structural, optical, photoluminescence and antibacterial properties of copper-doped silver sulfide nanoparticles. J Photochem Photobiol B: Biology. 2015;149:78-83.
- Aazam ES. Photocatalytic oxidation of methylene blue dye under visible light by Ni-doped Ag2S nanoparticles. J Ind Eng Chem. 2014;20:4033-8.
- Maaz K, Mumtaz A, Hasanain SK, et al. Synthesis and magnetic properties of cobalt ferrite (CoFe2O4) nanoparticles prepared by wet chemical route. J Magn Magn Mate. 2007;308:289-95.
- David GC, Wayne KF, Kenneth EG, et al. Nanoscale thermal transport. J Applied Physics. 2003;93:793.
- Azam A, Jawad A, Ahmed AS, et al. Structural, optical and transport properties of Al3+ doped BiFeO3 nanopowder synthesized by solution combustion method. J Alloys Compd. 2011;509:2909-13.
- Giribabu G, Reddy DA, Murali G, et al. Structural and optical studies on Mg-doped CdS nanoparticles by simple co-precipitation method. AIP Conf Proc. 2013;1512:186-7.
- Hocaoglu I, Cizmeciyan MN, Erdem R, et al. Development of highly luminescent and cytocompatible near-IR-emitting aqueous Ag2S quantum dots. J Mater Chem. 2012;22:14674-81.
- Ovchinnikov OV, Smirnov MS, Shapiro BI, et al. Optical and structural properties of ensembles of colloidal Ag2S quantum dots in gelatin. Semiconductors. 2015;49:373.
- Ma DK, Hu XK, Zhou HY, et al. Shape-controlled synthesis and formation mechanism of nanoparticles-assembled Ag2S nanorods and nanotubes. J Cryst Growth. 2007;304:163.
- Hammad TM, Shallah AM, Salem JK. Optical properties of Mg-and Ni-Doped Ag2S colloidal nanoparticles. J Korean Phy Soc. 2018;73:616-21.
- Hammad TM, Salem JK, Harrison RG, et al. Optical and magnetic properties of Cu-doped ZnO nanoparticles. J Mater Sci: Mater Electron. 2013;24:2846-52.