Original Article
, Volume: 15( 3)Equilibrium and Kinetic Studies for the Biosorption of Cd (II) in Aqueous Solution onto Almond Gum
- *Correspondence:
- Sumithra S , Department of Environmental Science, Yogi Vemana University, Kadapa, Andhra Pradesh, India, Tel: 9573339147; E-mail: ssumithra1@yahoo.co.in
Received: June 16, 2017; Accepted: July 20, 2017; Published: July 22, 2017
Citation: Jameer Ahammad S, Sumithra S, Subha R. Equilibrium and Kinetic Studies for the Biosorption of Cd (Ii) in Aqueous Solution onto Almond Gum. Int J Chem Sci 2017;15(3):161
Abstract
Batch adsorption process was carried out for the removal of cadmium (II) from aqueous solution using almond gum. The material was characterized using standard physio-chemical methods, SEM and FTIR studies. The adsorption isotherm was evaluated by means of Langmuir, Freundlich, Dubinin Radushkevich (D-R) and Temkin isotherm models. A maximum Langmuir adsorption capacity of 40.0 mg/g at 32°C was obtained for initial concentration of 10 mg/L, 20 mg/L, 30 mg/L and 40 mg/L. The order of the kinetics was also determined and adsorption of cadmium (II) followed second order kinetics which shows that physisorption may be involved in the process. Thermodynamic parameters (ΔG°, ΔH° and ΔS°) showed that the reaction to be endothermic, spontaneous and increasing randomness of the solid solution interface. The cost of almond gum is economically effective compared to commercial activated carbon.
Keywords
Almond gum; Temkin; Elovich; Desorption
Introduction
Nowadays, the environmental contamination is not the only concern of scientific community. Most of the human population is exposed to heavy metals through food, water, air or absorption on the skin [1]. Heavy metal pollution has turned out to be one of the most severe environmental problems because of the tendency to bio-accumulate in ecosystem [2]. Cadmium is a non-degradable and persistent metal [3], classified as priority pollutant by United States of Environmental Protection Agency [4]. Cadmium is released into the environment by industrial effluents from electroplating, pigments, plastic, battery and zinc refining industries [5], and finds its way into the natural water systems [6]. The drinking water guideline value recommended for this element by World Health Organization and American Water Works Association (AWWA) is 0.005 mg/L [7]. Cadmium, even in traces, may cause chronic health problems, lung edema, renal dysfunction [8-10], abdominal pain, convulsions, hypertension, loss of appetite, fatigue, sleeplessness hallucinations, headache [11], and osteoporosis respectively. Hence, removal of cadmium from water sources becomes important.
Many conventional techniques have been proposed such as oxidation, reduction [12], ion exchange, reverse osmosis, precipitation, solvent extraction, membrane technology, electrochemical treatment, flocculation, coagulation, and complexation [13-16]. These techniques have their own inherent limitations such as less efficiency, sensitive operating conditions, secondary sludge and costly for disposal [17]. Adsorption, on the other hand, is found to be the best technique for the remediation of heavy metal due to its simple design and affordability.
The last few decades have witnessed tremendous development of new adsorbents and modified performance of existing ones such as activated carbon [18], waste Fe (III)/Cr (III) hydroxide [19], sweet potato peel [20], guar gum silica nano composite, pomegranate peel [21], orange rind, Crambe abyssinica Hochst seeds, marine sponge Cinachyrella tarentina and banana peel [22-25].
Almond gum is produced by almond tree (Prunus amygdalus, Rosaceae family). Almond gum represents an abundant natural biomass worldwide. Almond gum is insoluble in aqueous solutions and could be used as adsorbent for the removal of cadmium (II) from waste water.
The objective of the study is to characterize the almond gum and find its feasibility for batch mode studies such pH, initial concentration, adsorbent mass and temperature on the treatment process. Langmuir, Freundlich, Dubinin Radushkevich and Temkin isotherm models were employed to quantify the biosorption equilibrium.
Material and Methods
Almond Gum was used as adsorbent which is commercially available in the local market of Kadapa town, Andhra Pradesh, India. The gum was ground and sieved for uniform particle size of 100 μm. The material was characterized using physio-chemical methods, SEM (Model JEOL ion sputtering device) and FTIR (Perkin Elmer Spectrum, two models, UK) respectively.
Preparation of cadmium nitrate stock solution
Cadmium nitrate [Cd (NO3)2.4H2O], molecular weight is 308.47 g/mol, was supplied by Merck, India was used as adsorbate. The stock solution was prepared by dissolving requisite amount of cadmium nitrate in 1000 ml distilled water. The solutions were stored in brown glass bottles and used to prepare different working concentrations (10 mg/L, 20 mg/L, 30 mg/L and 40 mg/L).
Batch adsorption experiment
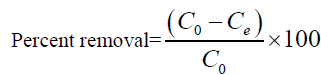
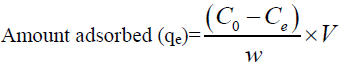
For batch method, 50 ml of the cadmium (II) solution with the known initial concentration and a known amount of the adsorbent were taken in a 250 ml conical flask. This mixture was agitated at 32°C by keeping the conical flask in orbital shaker at a constant speed of 180 rpm. The Cadmium (II) solution was separated from the adsorbent by centrifugation at 10,000 rpm for 20 min and the absorbance was determined using double beam UV visible spectrophotometer (LabIndia 3000+UV) at 575 nm, by the Xylenol orange colorimetric method [26]. The percentage removal of Cadmium (II) and equilibrium adsorption uptake, qe (mg/g), was calculated using the following relationships:
 (1)
(1)
 (2)
(2)
Where C0 is the initial adsorbate concentration (mg/L), Ce is the equilibrium adsorbate concentration (mg/L), V is the volume of the solution (L) and w is the mass of the adsorbent (g).
Desorption study
After adsorption, the adsorbate-loaded adsorbent was separated from the solution and the supernatant was drained out. The adsorbent was gently washed with distilled water at various pH values. Then, they were agitated for the equilibrium time and the desorbed solution was estimated.
Results and Discussion
Characterization of the adsorbent
Almond gum is an acidic polysaccharide composed on dry weight by 2.45% of protein, 0.85% of fats and 92.36% of carbohydrates with traces of mannose, rhamnose and glucuronic acid respectively [27]. The physio-chemical characteristics of almond gum are given in TABLE 1. The surface morphology of the adsorbent material by SEM shown in FIG. 1 (a) and 1(b) revealed that pores at the surface of almond gum were filled by the cadmium (II) ions adsorption. A similar observation with respect to the porous structure with large surface area on to the orange and (Citrus sinensis) (L.) osbeck for cadmium biosorption has been reported. The X-Ray Diffraction of the almond gum exhibit broad peaks and absence of a sharp peak that revealed the amorphous structure. An FTIR spectrum revealed that the peaks observed at 2940 cm-1 and 2942 cm-1 (before and after biosorption) was associated with the stretching vibrations of C-H bond of methyl, methylene and methoxy groups. Furthermore, from FIG. 2(a) and 2(b) it was observed that there are shifts in C-H stretching vibrations (2147 cm-1 to 2155 cm-1). The same findings were also being reported [25]. This shift in the vibrations indicates the inference of the Cd (II) bonding onto the biosorbent. The results of the characterization are shown in TABLE 1.
| pH zpc | 5.4 |
| Bulk density (g/ml) | 0.856 |
| Mechanical moisture content (%) | 9.8 |
| Ash content (%) | 9.42 |
| pH | 4.79 |
| EC (µs/cm) | 520 |
| Water soluble content (%) | 19.7 |
| Acid soluble content (%) | 27.42 |
| Sodium (Na) (ppm) | 408.86 |
| Potassium (K) (ppm) | 340.36 |
| Calcium (Ca) (ppm) | 1637.33 |
| Phosphate (ppm) | 4.81 |
| Decolorizing power (mg/g) | 225 |
| Specific gravity | 3.448 |
TABLE 1. Physical and chemical characteristics of the adsorbent.

Figure 1: SEM pictures of almond gum (a) before and (b) after Cd (II) biosorption.

Figure 2: X-ray diffraction patterns of Sn61Bi25Sb5Zn4Al3Ag2 alloy.
Effect of contact time and initial Cd (II) concentration
The biosorption efficiency of the cadmium ions was performed as a function of contact time and initial concentration. The adsorption rate was relatively fast initially and adsorption equilibrium was achieved within 40 min for 20 mg/L of cadmium concentration. The amount of Cd (II) adsorbed onto almond gum increased from 8.03 mg/g to 25.83 mg/g with the increase in concentration from 10 mg/L to 40 mg/L. Similar findings have been reported by several authors for the adsorption of cadmium removal from aqueous solution by pine cone biochar, Prunus avium leaves [28] respectively.
Adsorption kinetics
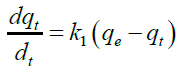
The uptake of Cd (II) by the almond gum has been modeled using first order, pseudo second order and Elovich respectively. The pseudo-first-order rate equation is [29]:
 (3)
(3)
Integrating equation (3) for the boundary conditions t=0 to t=t and q=0 to q=q gives
ln (qe –q)=k1t (4)
Where, q and qe are the grams of solute adsorbed per gram of adsorbent at any time and at equilibrium, respectively, and k1is the rate constant of first-order adsorption.
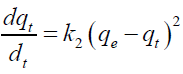
Second order kinetic model [30]:
 (5)
(5)
Where, qe and qt are the adsorption capacity at equilibrium and at time t, respectively (mg/g). For the boundary conditions to qt=0 to qt=qt at t=0 to t=t; the integrated form of equation (5) becomes:
t/q=1/k2qe2+t/qe (6)
If the pseudo-second order kinetics is applicable, the plot of t/q versus t of equation (6) should be linear relationship from which qe and k2 can be determined from the slope and intercept of the plot. The calculated equilibrium values obtained from second order were very close to the experimentally determined values (qe) with the correlation coefficient (R2) being 0.999 for 30 mg/L initial Cd (II) concentration and were thus higher than the R2 values of first order kinetic (TABLE 2). The applicability of this model implies that the rate limiting step may be chemisorption involving valency forces through sharing or exchange of electrons between adsorbate and adsorbent [30]. Obtained results are in accord with those similar studies of cadmium and lead adsorption onto mesoporous activated carbon, sorption of Cd (II) by sweet potato [31].
| Model | Kinetic parameters | Initial cadmium (II) concentration (mg/L) | |||
|---|---|---|---|---|---|
| 10 | 20 | 30 | 40 | ||
| Pseudo-first order | qeexp (mg/g) | 8.038.03 | 13.97 | 19.24 | 25.83 |
| K1 (min-1) | 0.359 | 0.106 | 0.085 | 0.023 | |
| qe cal (mg/g) | 0.072 | 0.711 | 6.834 | 1.235 | |
| R2 | 0.996 | 0.998 | 0.995 | 0.997 | |
| Pseudo-second-order | qe cal (mg/g) | 8.22 | 14.10 | 19.42 | 25.64 |
| K2 (min-1) | 0.846 | 0.384 | 0.420 | 0.293 | |
| R2 | 0.995 | 0.998 | 0.999 | 0.999 | |
| Elovich | α | 5.23 × 10² | 8.09 × 10³ | 2.09 × 10⁶ | 9.92 × 10⁶ |
| β | 1.049 | 0.801 | 0.881 | 0.716 | |
| R2 | 0.995 | 0.996 | 0.994 | 0.994 | |
TABLE 2. Kinetic model constant values for Cd (II) adsorption by almond gum.
The Elovich model equation is generally expressed as [32]:
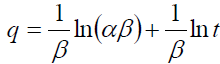 (7)
(7)
The values of β and α are calculated from the slope (1/β) and the intercept [ln (αβ)/β] of the plot and are listed in TABLE 2.
Equilibrium isotherms
The Langmuir isotherm has been one of the most widely used isotherms applied to pollutant biosorption process. The model can be written in the form as:
Ce/qe=1/Qob+Ce/Qo (8)
The Langmuir isotherm assumes that the surface has homogeneous binding sites, equivalent adsorption energies and no interaction between adsorbed species and its relevant parameters are Langmuir constant “b” which refers to the energy constant related to the heat of adsorption capacity and Qo which represents the maximum loading capacity of the adsorbent [30]. The adsorption capacity, Qo was found to be 40.0 mg/g (TABLE 3).
| Langmuir constants | |||
|---|---|---|---|
| Co (mg/L) | Qo (mg/g) | b (L/mg) | RL |
| 10 | - | - | 0.998 |
| 20 | 0.997 | ||
| 30 | 40.0 | 0.106 | 0.995 |
| 40 | 0.997 | ||
| Freundlich constants | |||
| Co (mg/L) | kf (mg1-1/nL1/n g-1) | n | R2 |
| 10 | 1.242 | 0.546 | 0.999 |
| 20 | 0.034 | 0.345 | 0.999 |
| 30 | 2.393 | 0.265 | 0.999 |
| 40 | 0.02 | 0.379 | 0.996 |
| Dubinin-Radushkevich constants | |||
| Co (mg/L) | qm (mg/g) | E (kJ/mol) | R2 |
| 10 | 297.98 | 35.71 | 0.996 |
| Temkin constants | |||
| A (L/mg) | B (mg/g) | - | R2 |
| 1.09 | 13.68 | - | 0.999 |
TABLE 3. Isotherm parameters for the biosorption of Cd (II) onto almond gum.
A characteristic of the Langmuir isotherm can be expressed using a dimensionless constant called the separation factor RL as:
RL=1/(1+bCo) (9)
Moreover, the RL values decreased as the initial Cd(II) concentration increased, suggesting that the adsorption process was more favorable at higher initial Cd(II) concentrations, which was also proved by the intensity factor of Freundlich model since n>1, implying that adsorption intensity was favorable at high concentrations and much less at lower concentrations. The maximum monolayer loading capacity (Qo) obtained for the biosorption of Cd (II) ion from aqueous solution was compared to other adsorbents reported in the literature are presented in TABLE 4.
| Adsorption | qmax(mg/g) | References |
|---|---|---|
| Sun flower (Helianthus annuus) | 14.9 | 35 |
| Wheat bran | 15.71 | 36 |
| Techtona grandis L.f | 23.20 | 18 |
| Fe (III)/Cr (III) hydroxide | 3.08 | 19 |
| Durian peel | 18.5 | 37 |
| Coconut copra meal | 5.1 | 38 |
| Papaya wood | 17.22 | 39 |
| Cashew nut shell | 22.11 | 40 |
| Coffee grounds | 15.65 | 41 |
| Sweet potato peels | 18. 9 | 20 |
| Pomegranate peel | 18.52 | 21 |
| Commercial activated carbon | 27.3 | 30 |
| Mustard biomass | 33.56 | 42 |
| Crambe abyssinica Hochst seeds | 19. 34 | 23 |
| Banana peels | 5.71 | 2 |
| Almond gum | 40.0 | - |
TABLE 4. Comparison of the maximum adsorption capacities for Cd (II) by other adsorbents.
The Freundlich isotherm assumes a heterogeneous adsorption surface and active sites with different energy. The linear form is given as eqn. (10).
Log qe=log kf+1/n log Ce (10)
Where kf denotes approximate adsorption capacity and n is related to intensity of adsorption. TABLE 3 shows the obtained kf and n. The correlation coefficient values and the plot qe vs. Ce indicated that the Freundlich isotherm gave a good fit to the biosorption process.
Dubinin-Radushkevich (D-R) isotherm approach assumes that there is a surface area where the adsorption energy is homogeneous. The linear form of the equation is:
qe=qmexp (-Bε2) (11)
The values of qm, B, E and regression coefficient (R2) are listed in TABLE 3. The importance of the E value is as follows: E< 8 kJ/mol (physical adsorption); E=8-16 kJ/mol (ion exchange); E=20-40 kJ/mol (chemical adsorption). The estimated value of E was found to be 35. 71 kJ/mol, which indicates that the adsorption of Cd (II) ions by almond gum is a chemical adsorption process.
The Temkin isotherm is represented as:
qe=B ln A+B ln Ce (12)
Where, Ce is the concentration of the adsorbate at equilibrium (mol/L), qe is the amount of adsorbate adsorbed at equilibrium (mol/g), RT/h=B; and A and h are constants. The adsorption data can be analyzed according to eqn. (12). A plot of qe vs. ln Ce enables the determination of the constants A and B.
FIG. 3 presents different adsorption isotherms along with the experimental data. In order to compare the validity of isotherms, a normalized deviation, Δq (%), was calculated using the following equation:

Figure 3: Adsorption isotherms of Cd (II) ions.
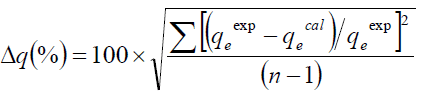 (13)
(13)
Where, superscripts ‘exp’ and ‘cal’ are the experimental and calculated values, respectively, and ‘n’ is the number of measurements. From the results it was found that values of Δq obtained from Langmuir [Δq (%)=3.5], Freundlich [Δq (%)=5] and Temkin [Δq (%)=7.0] were lower compared to D-R [Δq (%)=47.4] adsorption isotherm models. It shows that the equilibrium data fit better with Langmuir, Freundlich and Temkin isotherms over the entire range of concentrations compared to D-R and isotherm.
Effect of pH
The effect of pH on the biosorption of Cd (II) using almond gum, separate set of batch equilibrium adsorption experiments was conducted modifying the pH from 3.0 to 8.0 and illustrated in FIG. 4 . The maximum biosorption was observed at pH 7.0 for Cd (II). The pH point of zero charge for the almond gum was found to be 5.4. At pH>pHZPC, the adsorbent is negatively charged and the adsorbate species are positively charged. Obviously, a negatively charged surface site did favor the adsorption of cationic Cd (II) ions because of electrostatic attraction. At pH 8, cadmium exists mainly as Cd (OH)+ and thus adsorbed at negatively polarized surface sites. To avoid the possible precipitation of Cd (OH)2, the pH studies should not be performed at pH>8. Similar trends have been reported for the adsorption of Cd (II) in other adsorbents [33,5,34,19].

Figure 4: Effect of pH and desorption on removal of Cd (II) ions.
Desorption studies
Desorption studies help recycle the adsorbent and to recover the metal. The percent desorption increased with decrease in pH and being capable of desorbing 26% (FIG. 4). In acidic conditions, H+ ions protonate the adsorbent surface leading to the desorption of the positively charged Cd ions [35-37].
Thermodynamics of biosorption
Thermodynamic parameters such as the change in standard free energy (ΔG°), enthalpy (ΔH°) and entropy (ΔS°) of adsorption were calculated using the following equations [19,23]:
ΔG°=-RT ln Kc (14)
Where R is gas constant (8.314 J/mol/K), b is equilibrium constant (L/mol) and T is the temperature in (K):
log Kc= (ΔS°/2.303 × R)-(ΔH°/2.303 × RT) (15)
The values of ΔH and ΔS were determined from the slope and intercept of van’t Hoff plots log Kc vs. 1/T [38-41]. Positive values of ΔH° listed in TABLE 5 suggest the endothermic nature of biosorption. The negative values of ΔG° indicate spontaneous nature of adsorption of Cd (II) onto almond gum [42,43]. The positive values of ?S° show the increased randomness at the solid/solution interface during the biosorption of Cd (II) ion by almond gum.
| Temperature (°C) | Kc | DG° (KJ/mol) | ΔH°(KJ/mol) | DS° (J/mol/K) |
|---|---|---|---|---|
| 32 | 4.082 | -3.544 | - | - |
| 40 | 2.013 | -1.82 | 32.42 | 95.69 |
| 50 | 1.960 | -1.808 | - | - |
TABLE 5. Thermodynamic parameters.
Conclusion
In this work almond gum, an inexpensive and efficient adsorbent are used for the removal of Cd (II) from aqueous solution. Results indicate that the pseudo second order kinetic model showed good correlation with experimental data and the equilibrium data was satisfied well with the Freundlich and Temkin isotherms equation. Biosorption increases with pH until the cadmium (II) ions are precipitated as cadmium hydroxide. Temperature studies showed that biosorption was endothermic and spontaneous in nature.
References
- Mithali S, Aparna B, Partha PP, et al. Use of laterite for the removal of fluoride from contaminated drinking water. Journal of Colloid and Interface Sciences. 2006;302:432-441.
- Anwar J, Shafique U, Zaman WU, et al. Removal of Pb (II) and Cd (II) from water by adsorption on peels of banana. Bioresource Technol. 2010;101:1752-5.
- Rao KS, Mohapatra M, Anand S, et al. Review on cadmium removal from aqueous form solutions. Int J of Eng Sci and Technol. 2010;2:81-103.
- Gang S, Weixing. Sunflower stalks as absorbents for the removal of metals ions from wastewater. Ind Eng Chem. 1998;37:1324.
- Singh V, Singh SK. Cadmium (II) removal from aqueous solution using guar gum silica nanocomposite. Adv Mat Lett. 2015;6:607-15.
- Adeyemo AO, Egbedina AA, Adebowale KO. Removal of Cadmium (II) from aqueous solutions by pinecone Biochar. Res J Chem and Env Sci. 2014;2:98-102.
- Mohan D, Singh KP. Single multi component adsorption of cadmium and zinc using activated carbon derived from biogases-an agricultural waste. Water Research. 2002;36:2304-18.
- Nordberg GF. Health hazards of environmental cadmium pollution. Ambio. 1974;3:51-65.
- Nath R, Prasad R, Palinal VK, et al. Molecular basis of cadmium toxicity. Prog Food Nutr Sci. 1984;8:109-63.
- Staessen JA, Roles HA, Emelianov D, et al. Environmental exposure to cadmium, forearm bone density, and risk of fractures: Prospective population study. Lancet. 1999;353:1140-4.
- Inglezakis VJ, Loizidou MD, Grigiropoulou HP. Ion exchange of Pb2+, Cu2+, Fe3+ and Cr3+ on natural clinoptilolite: selectivity determination and influence of acidity on metal uptake. J Colloidal Interface Sci. 2003;261:49-54.
- Patterson JW. Industrial waste water treatment technology. 2nd ed. Butterworth-Heinemann; London, (1985).
- Dezuane J. Handbook of drinking water quality standards and controls. Van Nostrand Reinhold; New York. 1990;64-9.
- Moore JW, Ramamoorthy S. Heavy metals in natural waters. Springer verlag; New York. 1994.
- Halttunen T, Salminen S, Tahvonen R. Rapid removal of lead cadmium from water by specific lactic acid bacteria. Int J Food Microbiol. 2007;114:30-5.
- Vasudevan S, Lakshmi J. Effect of alternating and direct current in an electrocoagulation process on the removal of cadmium from water. Water Sci & Technol. 2012;65:353-60.
- Maran SH, Protton CF. Principles of physical chemistry. 4th ed. The Macmillan Company; New York, Collier Macmillan Ltd, London. 1971.
- Rao KS, Anand S, Venkateshwarlu P. Adsorption of cadmium (II) ions from aqueous solutions by Tectona Grandis L. F. (Teak leaves powder). Bio Resources. 2010;5:438-54.
- Namasivayam C, Ranganathan K. Removal of Cd (II) from wastewater by adsorption on “waste” Fe (III)/Cr (III) hydroxide. Wat Res. 1995;29:1737-44.
- Asuquo ED, Martin AD. Sorption of cadmium (II) ion from aqueous solution onto sweet potato (Ipomoea batatas L.) peel adsorbent: Characterisation, kinetic and isotherm studies. J Environ Chemical Engg. 2016;4:4207-28.
- Kumar A, Kumar V. Kinetic and equilibrium isotherm and thermodynamic study for removal of cadmium from wastewater by using modified pomegranate peel. J Chem and Pharma Res. 2015;7:685-97.
- Poojari Anukthi C, Maind Sandip D, Bhalerao Satish A. An evaluation of comparative biosorption study of Cadmum (II) and Chromium (VI) using orange rind (Citrus sinensis), (L.) Osbeck, under optimized conditions. Int J of Life Sci. 2016;4:44-56.
- Rubio F, Goncalves AC, Meneghel AP, et al. Removal of cadmium from water using by product Crambe abyssinica ghost seeds as biosorbent material. Water Sci and Technol. 2013;68:227-33.
- Tarbaoui M, Oumam M, Amraoui BEl, et al. Biosorption and desorption of lead, copper and cadmium ions by a new material prepared from the marine sponge Cinachyrella tarentina. J Mater Environ Sci. 2015;6:3281-94.
- Mohammad SG, Ahmed SA, Badawi AFM, et al. Activated carbon derived from Egyptian banana peels for removal of cadmium from water. J App Life Sci Int. 2015;3:77-88.
- Hlihor RM, Diaconu M, Leon F, et al. Experimental analysis and mathematical prediction of Cd (II) removal by biosorption using support vector machines and genetic algorithms. New Biotechnol. 2015;32:358-68.
- Mahfoudi N, Chouaibi M, Donsis F, et al. Chemical composition and function properties of gum from the trunk of almond. Food Sci & Technol Int. 2012;18:241-50.
- Salem NM, Farhan AM, Awwad AM. Biosorption of cadmium (II) from aqueous solutions by Prunus avium leaves. Am J Environ Eng. 2012;2:123-7.
- Lagergren S, Svenska BK. To the theory of the so-called adsorption of loosened substances. Science case, Handl. 1898;24:1-39.
- Ho YS, McKay G. A comparison of chemisorption kinetic models applied to pollutant removal on various sorbents. Transac of the Institute of Chem Eng. 1998;76:332-40.
- Asuquo E, Martin A, Nzerem P, et al. Adsorption of Cd (II) and Pb (II) ions from aqueous solutions using mesoporous activated carbon adsorbent: Equilibrium, kinetics and characterization studies. J Environ Chem Eng. 2017;5:679-98.
- Chien SH, Clayton WR. Application of Elovich equation to the kinetics of phosphate release and sorption in soils. Soil Sci Soc Am J. 1980;44:265-8.
- Yang G, Tang L, Lei X, et al. Cd (II) removal from aqueous solution by adsorption on α-ketoglutaric acid-modified magnetic chitosan. Applied Surface Science. 2014;292:710-6.
- Wang FY, Wang H, Ma JW. Adsorption of cadmium (II) ions from aqueous solution by a new low cost adsorbent bamboo charcoal. J Hazard Mater. 2010;177:300-6.
- Feizi M, Jalali M. Removal of heavy metals from aqueous solutions using sunflower, potato, canola and walnut shell residues. J Taiwan Inst Chem Eng. 2015;54:125-36.
- Nouri L, Ghodbane I, Hamdaoui O, et al. Batch sorption dynamics and equilibrium for removal of cadmium ions from aqueous phase using wheat bran. J Hazard Mater. 2007;149:115-25.
- Saikaew W, Kaewsarn P. Cadmium ion removal using biosorbents derived from fruit peel wastes. Songklanakarin J Sci Technol. 2009;31:547-54.
- Ho YS, Ofomaja AE. Biosorption thermodynamics of cadmium on coconut copra meal as biosorbent. Biochem Eng J. 2006;30:117-23.
- Asma S, Washeed AM, Muhammed I. Removal and recovery of heavy metals from aqueous solution using papaya wood as a new biosorbents. Separation and Purification Tech. 2005;45:25-31.
- Kumar PS, Ramalingam S, Sathyaselvabala V, et al. Removal of cadmium (II) from aqueous solution by agricultural waste cashew nut shell. Korean J Chem Engg. 2012;29:756-68.
- Azouaou N, Sadaoui Z, Djaafri A, et al. Adsorption of cadmium from aqueous solutions onto untreated coffee grounds: Equilibrium, kinetics and thermodynamics. J Hazard Mater. 2010;184:126-34.
- Bulgariu L, Hlihor RM, Bulgariu D, et al. Sorptive removal of cadmium (II) ions from aqueous solution by mustard biomass. Envion Engg Mangt J. 2012;11:1969-76.
- Wu FC, Tseng RL, Juang RS. Preparation of highly micro porous carbon from fire wood by KOH activation for adsorption of dyes and phenols from water. Separation and Purification Technology. 2005;47:10-9.
