Original Article
, Volume: 11( 2)Synthesis of Visible Light Driven Cobalt Doped Nanotitania Assisted by Triton X-100: Characterization and Application in Photocatalytic Degradation of Congo Red
1 School of Chemistry, Andhra University, Visakhapatnam, India
2 Department of Inorganic and Analytical Chemistry, Visakhapatnam, India
- *Corresponding Author:
- Sivarao T
School of Chemistry, Andhra University
Visakhapatnam, India
Tel: +91 7702110459
E-mail: Sivaraotvalluri.16@gmail.com
Received Date: Jul 26, 2017; Accepted Date: Aug 16, 2017; Published Date: Aug 23, 2017
Citation: Sivarao T, Radha DC. Synthesis of Visible Light Driven Cobalt Doped Nanotitania Assisted by Triton X-100: Characterization and Application in Photocatalytic Degradation of Congo Red. Nano Sci Nano Technol. 2017;11(2):117
Abstract
The work presented in this article was the synthesis of cobalt doped titania nanomaterial in presence of nonionic surfactant (Triton X-100) by sol gel method, as prepared catalysts were characterized by XRD, UV-Vis. DRS, FT-IR, SEM, EDX, TEM and BET surface area analysis and its application was discussed on the degradation of Congo red. The XRD patterns and UV-vis. DRS analysis have shown anatase phase for all the synthesized samples with decrease in the band gap energy. EDX indicated presence of Co2+along with Ti4+and O2-in the catalyst, the doping of Co2+ into TiO2 lattice was evident by FT-IR spectral data. SEM and TEM images revealed nanoparticles size with irregular surface. The increased surface area of the as prepared catalyst was shown from BET analysis. The photocatalytic efficiency of the catalyst was evaluated by degradation of Congo red solution in presence of visible light by varying the reaction parameters.
Keywords
Cobalt doped titania nano material; Congo red; Photocatalytic degradation; Triton X-100; Sol-gel method
Introduction
Semiconductor metal oxide nano materials has emerged as one of the most fascinating materials and has gained immense research in the field of photo catalysis for the decomposition of organic pollutants in aqueous solution or in the gas phase [1,2]. Titania has drawn extensive attention as a photo catalyst and has been widely used as a promising technology for the removal of various organic and inorganic pollutants from the industrial wastewaters. Mostly textile industries release lot of azo dye pollutants [3] disturbing the environment. These azo dyes are non-biodegradable, toxic, carcinogenic in nature and constitute a major threat to the surrounding ecosystem [4]. Hence such effluents containing toxic organic chemicals need to be treated prior to disposal. Congo red is one of azo dyes found in textile waste waters which pose hazardous risk to environment. From the literature, photocatalytic studies on Congo red was carried out by Lachheb et al. in presence of undoped TiO2 under UV light irradiation. In the present study degradation of Congo red was undertaken as a model dye azo pollutant with Co2+-TiO2 in presence of visible light [5,6]. Some of the distinctive semiconducting properties of titania include inertness to chemical environment, and nontoxic nature [7]. But high band gap limits its photocatalytic efficiency in visible light. In order to modify this limitation, several approaches have been made like metal-ion implanted TiO2 using transition metals [8-12] non-metal doped-TiO2, composites of TiO2 [13], sensitizing of TiO2 with dyes [14] and semiconductor coupling [15]. From the literature, very few investigations were reported on doping of cobalt into titania by approaching different methods [16]. Barakat et al. [17] found that titania containing 0.036 mol% cobalt rapidly photooxidised 2-chlorophenol, with greater or lesser amounts proving less active.
The cobalt (Co) doping into TiO2 lattice exhibited superior photo degradation capability under visible light irradiation [18]. Previous researchers reported that due to doping of Co into TiO2 decrease in band gap and high porosity were found to be key factors affecting the photocatalytic activity. Hence, we have preferred doping of Co2+into TiO2. However, the photocatalytic activity of the prepared metal ion doped TiO2 photo catalysts strongly depends on the dopant ion species and their concentration as well as the preparation method [19,20] which affects the physico chemical properties of the photo catalyst. Small particle size and high specific surface tend to increase the photocatalytic activity of TiO2 [21]. Hence for synthesizing an efficient photo catalyst with high surface area and decreased particle size with reduced band gap we preferred synthesizing cobalt doped titania nanomaterial by surfactant assisted sol-gel method. Surfactants have a wide practical application in areas like synthesis of nanoparticles and pharmaceutical industry [22,23]. Selecting a suitable surfactant was an important parameter. The influence of the non-ionic surfactant TX-100 on the effects of various physical properties like particle size, shape, surface area, crystal structure of the catalyst was investigated. The synthesized catalysts were characterized and the photocatalytic efficiency of the catalyst was investigated through the photocatalytic degradation of Congo red solution under visible light irradiation.
Experimental Procedure
Materials required
Titanium tetra-n-butoxide [Ti (O-Bu)4] was taken as a titanium precursor, while cobalt nitrate obtained from E. Merck (Germany), was taken as source for cobalt as dopant in order to prepare undoped TiO2 and cobalt doped TiO2 nano catalysts. Triton X-100 (TX-100) was used as surfactant for the synthesis of Co2+-TiO2 prepared in presence of TX-100. Congo red (CR) obtained from Sigma Aldrich was used as a model azo dye pollutant for degradation studies. All the other chemicals and reagents were of Merck (India) analytical grade.
Preparation of cobalt doped TiO2 assisted by TX-100 surfactant
Sol-gel method was employed for the synthesis of the undoped TiO2 and Co2+-TiO2 catalysts. Initially, solution I was prepared by dissolving 21.0 mL of Ti (O-Bu)4 in 40.0 mL of absolute alcohol with continuous stirring for 10 min. Later 3.0 mL of nitric acid was added slowly drop wise and continuously stirred for 30 min. Solution II was prepared by dissolving 0.01475 g of cobalt nitrate in 7.1 mL of water with 40.0 mL of absolute ethanol (100%). Later 25 ml of 0.05 M TX-100 surfactant was added with stirring vigorously for 30 min. Solution II was added slowly to the solution I and stirring was continued till 1 h. pH was maintained around 8 by adding ammonium hydroxide and stirring was continued at room temperature until the transparent sol was obtained. The gel was aged at 25°C for 48 h. The gel was dried at 110°C in an oven for 12 h to remove the solvents. Later the prepared catalyst i.e. Co2+-TiO2 (synthesized in presence of TX-100) was calcined at 450°C in a furnace for 4 h. The calcined nanomaterial was ground to powder by using an agate mortar at room temperature for further characterization. Various 0.25, 0.5, 0.75 and 1.0 wt% of Co2+-TiO2 catalysts in presence of surfactant were also synthesized. Co2+-TiO2 catalyst without surfactant was prepared by adopting similar procedure without adding surfactant and subsequently referred as Co2+-TiO2. Similarly, undoped TiO2 was prepared by following the same procedure without adding the dopant. The synthesized catalysts namely undoped TiO2, Co2+-TiO2, Co2+-TiO2 (synthesized in presence of TX-100) are represented as catalyst (a), catalyst (b) and catalyst (c) respectively. Later they were analyzed for XRD analysis, UV-visible absorption studies, SEM, EDX, TEM and FT-IR studies and BET surface area analysis. Pilot photocatalytic studies were carried on with various wt% of the catalysts and 0.5 wt% Co2+-TiO2 (synthesized in presence of TX-100) exhibited higher photo catalytic activity hence further characterizations were carried on with this catalyst.
Photocatalytic activity studies: Photoreactor set up
The photocatalytic efficiency of synthesized catalyst (c) was evaluated by carrying out the photocatalytic degradation of Congo red solution in the presence of visible light in the photo catalytic reactor. 100 mL of aqueous CR solution of required concentration (1 mg. L-1 to 10 mg. L-1) was considered with 100 mg of the catalyst taken in 150 mL of pyrex glass vessel. The pH of the solution was maintained by adding 0.1 N NaOH or 0.1 N HCl accordingly prior to irradiation by using pH meter (Digital pH meter, model LI 120/LI 610) and was placed inside the reactor. The mixture was stirred for 45 min in the dark in order to attain adsorption-desorption equilibrium of CR dye on the catalyst surface. The description regarding the photocatalytic set up was given elsewhere [24]. For complete removal of UV radiation, cut off filters Oriel (51472) were placed in the path of the light. At periodic time intervals 5 ml of the aliquots of the mixture were withdrawn during the irradiation and after centrifugation analyzed for the measurement of absorbance at λmax=500 nm with Milton Roy Spectronic 1201, UV-Vis Spectrophotometer.
Instruments used for characterization of photocatalyst
The synthesized catalysts were subjected to characterization by using most advanced analytical techniques. The crystalline phase and the crystallite size of the catalysts were analyzed by the X-ray diffraction technique. The XRD patterns were recorded with a Bruker AXS D8 advance diffractometer at room temperature. The UV-Vis. absorption spectroscopic analysis was performed by UV-Vis-NIR spectrophotometer (Varian, carry5000) from which band gap energy was calculated. XPS analysis of the catalysts were recorded with auger electron spectroscopy (AES) module PHI 5000 Versa Prob II, FEI Inc. using the AlKα line of a 100 W X-ray tube as a radiation source with the energy of 1253.6 eV, 16 mA × 23.5 kV and a working pressure lower than 1 × 10⁻⁸ Nm-2. The morphologies of the prepared samples were examined by Scanning electron microscope. SEM micrographs were recorded using JEOL Model JSM – 6390 LV combined with energy dispersive X-ray spectroscopy for the determination of elemental composition (EDX). The IR spectra of the synthesized samples were recorded on Thermo Nicolet Nexus 670 Spectrometer, with resolution of 4 cm-1 in KBr pellets. TEM measurements with selected area electron diffraction (SAED) were carried out using JEOL/JEM 2100, operated at 200 kV as accelerating. In order to determine their porous structure surface area (ABET) was determined from Brunauer-Emmett-Teller (BET) from the N2 adsorption-desorption isotherm at 77.3 K by using an Autosorb I; Quantachrome Corp. system.
Results and Discussion
Characterization of photocatalyst-X-ray diffraction studies
Figure 1 exhibits the XRD patterns of the synthesized catalysts (a), (b) and (c) nanocrystals calcined at 450° for 4 h. From the diffraction patterns, it was observed that all the catalysts were attributed to different diffraction planes of anatase phase, confirmed by (1 0 1), (0 0 4), (2 0 0), (1 0 5), (2 1 1) and (2 0 4) diffraction peaks [25] and the highest intensity peak was observed at 25.20 corresponding to 101 planes (JCPDS File No. 21-1272). The average nanocrystalline size was measured by using Scherrer’s equation [26] and the results were presented in Table 1. The crystallite size for catalyst (a) was found to be 28.2 nm to 35.5 nm while 18.5 nm to 21.2 nm for catalyst (b). Similarly, for catalyst (c) the crystallite size was found to be in the range of 9.5 nm to 14.1 nm. When compared with catalyst (a) and (b), catalyst (c) has shown decreased crystallite size.
UV-Visible diffusion reflectance spectroscopy
Figure 1: XRD patterns of (a) Undoped TiO2 (b) 0.5 wt% Co2+-TiO2 (c) 0.5 wt% Co2+-TiO2 (synthesized in presence of TX-100).
| Catalyst | Crystallite size (nm) |
Band gap energy (eV) |
ABET (m2 /g) |
|---|---|---|---|
| Undoped TiO2 | 28.2–35.5 | 3.20 | 21.9 |
| Co2+-TiO2 | 18.5 – 21.2 | 2.49 | 26.9 |
| Co2+-TiO2 (synthesized in presence of TX-100 surfactant) |
9.5 – 14.1 | 2.46 | 40.1 |
Table 1: The Results of crystallite size (XRD), Band gap (UV-Vis DRS), BET analysis of the catalysts.
Optical properties of the catalysts were characterized from UV-Vis-DRS study. The UV-vis. absorption spectra of synthesized catalysts (a), (b) and (c) were shown in Figure 2. Due to doping of cobalt into TiO2 lattice decrease in band gap energy was observed. From the spectra of Co2+-TiO2 catalysts it was observed that there was shift in the absorption peak extended more towards visible region (red shift) i.e. ranging from 500 nm to 700 nm. The band gap energy was calculated from the cut off wavelengths by using the equation Eg=(1240/ λ) eV [27] where Eg is band gap energy (eV) and λ is the wavelength (nm). From these results the calculated values for catalysts (a), (b) and (c) were found to be 3.2 eV, 2.49 eV, and 2.46 eV. These values are presented in Table 1. The decrease in band gap energy in case of Co2+-TiO2 catalysts was due to doping of cobalt into TiO2 lattice but not due to the presence of surfactant. Here surfactant influenced the decrease in the particle size during the synthesis of the catalyst.
Fourier transform infrared spectroscopy
Figure 2: UV-Vis. absorption spectra of (a) Undoped TiO2, (b) 0.5 wt% Co2+-TiO2, (c) 0.5 wt% Co2+-TiO2 (synthesized in presence of TX-100).
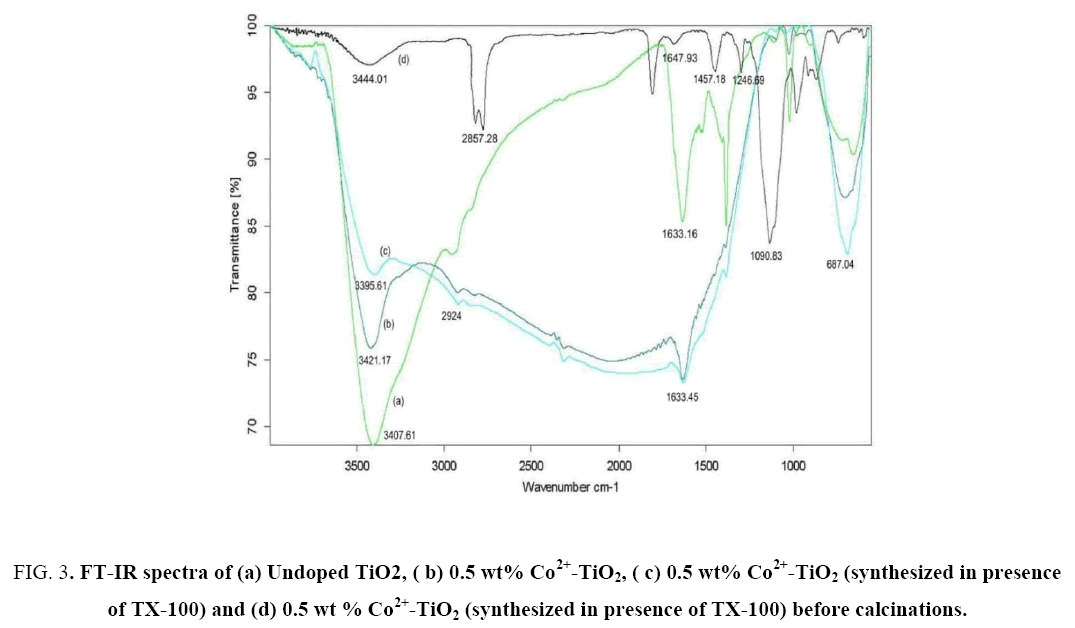
FT-IR spectra of catalyst (a), catalyst (b), catalyst (c) were represented in Figure 3(a-c), while Figure 3d represents catalyst (c) before calcinations at 450°C for 4 h. The peaks at 3350 cm-1 to 3450 cm-1 and 1620 cm-1 to 1635 cm-1 correspond to the stretching vibrations of O-H and bending vibrations of adsorbed water molecules respectively. From Figure 3(b) the peak positioned at 3421.17 cm-1 was attributed to O-H stretching vibration while peak located at 1633.45 cm-1 was attributed to H-O-H bending vibration mode of physically adsorbed water. In addition, a broad band observed between 500 cm-1 and 1000 cm-1 was ascribed due to vibration absorption of the Ti-O-Ti linkages in TiO2 nano particles [28]. From Figure 3(a) for undoped TiO2 stretching vibrations were observed at 654.83 cm-1 whereas From Figure 3(c) for Co2+-TiO2 (synthesized in presence of TX-100) it was observed at 687.04 cm-1. This small deviation observed was due to formation of Ti-O-Co network due to Co doped substitutionally in the TiO2 matrix. The appearance of peaks in between 2924 cm-1 and 2843 cm-1 were assigned to C-H stretching vibrations of alkane groups. From Figure 3(d) the peaks positioned at 1647.93 cm-1, 1457.18 cm-1, 1246.69 cm-1, 1090.83 cm-1, 722.55 cm-1 correspond with that of the characteristic absorption peaks of TX-100 surfactant. This confirmed the presence of the surfactant in the catalyst before calcination. Absence of these peaks in Figure 3(c) indicated that there was no surfactant in the Co2+-TiO2 (synthesized in presence of TX-100). The slight alteration in the stretching frequencies of the catalyst before and after calcinations (spectra d and c from Figure 3) was due to the bond formed due to interaction between the surfactant towards the cobalt doped titania due to encapsulation. From this it was clear that surfactant during the synthesis of the catalyst played an important role in synthesizing particles with decreased size.
Scanning electron microscopic study
Figure 3: FT-IR spectra of (a) Undoped TiO2, ( b) 0.5 wt% Co2+-TiO2, ( c) 0.5 wt% Co2+-TiO2 (synthesized in presence of TX-100) and (d) 0.5 wt % Co2+-TiO2 (synthesized in presence of TX-100) before calcinations.
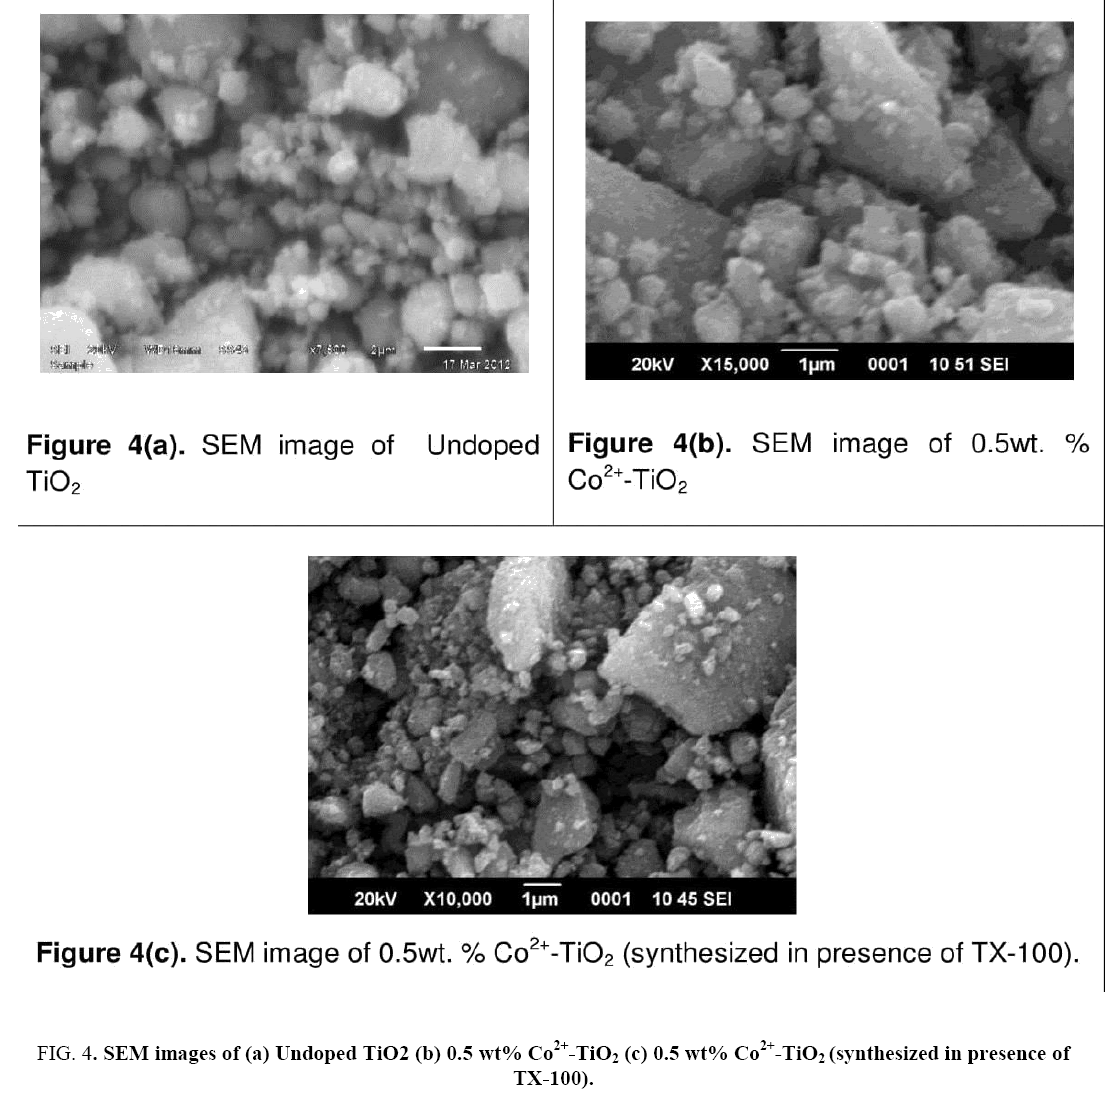
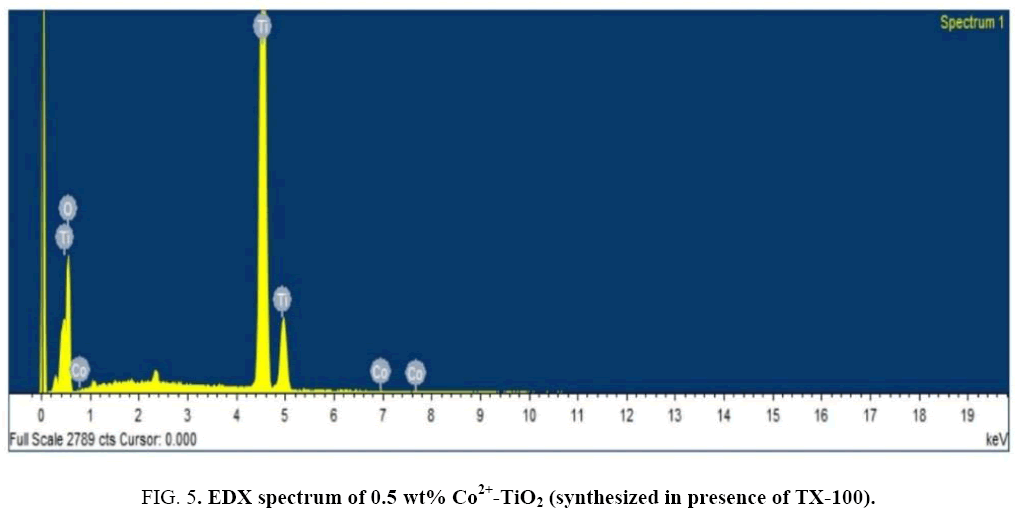
Figure 4 indicates the SEM-images of prepared catalysts (a), (b) and (c). SEM micrographs indicated change in morphology observed for all the 3 catalysts. SEM images of catalysts (a) particles appeared as large blocks of the coarse material with agglomeration whereas catalyst (c) indicated small sized nano particles with irregular shape. The tendency for the formation of agglomerated structures was minimized which was due to influence of surfactant. For catalyst (c) particles were found to be decreased in size. The surface composition of the prepared catalyst was studied by the EDX technique. Figure 5 indicates the EDX spectrum of catalyst (c). From EDX analysis presence of O, Ti and Co in the synthesized catalyst was confirmed. Elemental analysis of synthesized catalyst obtained by EDX analysis was given in Table 2.
Transmission electron microscopy
Figure 4: SEM images of (a) Undoped TiO2 (b) 0.5 wt% Co2+-TiO2 (c) 0.5 wt% Co2+-TiO2 (synthesized in presence of TX-100).
| Element | Weight % | Atomic % |
|---|---|---|
| O K | 47.01 | 72.81 |
| Ti K | 52.49 | 26.98 |
| Co K | 0.50 | 0.21 |
Table 2: EDX analysis-Elemental composition of Co2+-TiO2 (synthesized in presence of TX-100 surfactant).
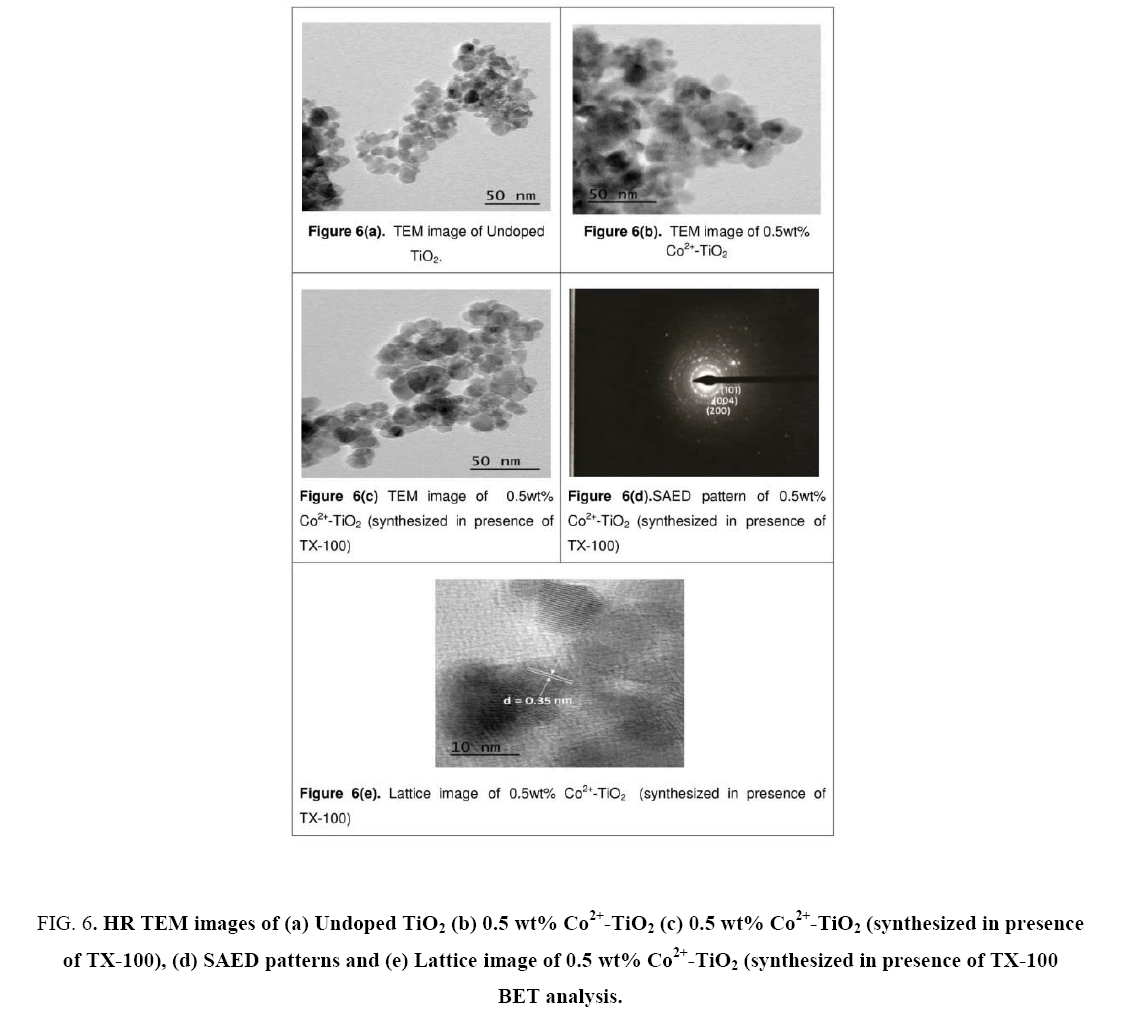
Figure 6(a-e) illustrates the TEM images of synthesized catalysts (a), (b) and (c) nanoparticles, while (d) represents SAED patterns of catalyst (c) and (e) denotes Lattice image of catalyst (c). From the images, the particle size of catalyst (a) was found to be ranging between 26 nm to 30 nm, whereas 18 nm to 20 nm for catalyst (b) and 8.7 nm to 13.9 nm for catalyst (c) respectively. From these images decrease in the particle size was observed for the catalyst synthesized in presence of surfactant. This was due to encapsulation on Co2+-TiO2 that had occurred due to the surfactant. Decrease in particle size with increased surface area of the catalyst lead to enhancement in the photocatalytic activity of the catalyst and this was observed from the later studies. From Figure 6(c) dark patches were seen on the surface of TiO2 nanoparticles which was due to doping of cobalt particles into TiO2. Figure 6(d) illustrates selected area diffraction pattern catalyst which shows discrete ring of crystalline nanoparticles of the catalyst. It confirms the crystalline nature of the synthesized Co2+-TiO2 nano-materials showing the crystallographic planes of anatase phase (101) and d-value is measured for preferentially oriented (101) planes. Lattice image of catalyst (c) shown in Figure 6(e), where most of lattice fringes were found corresponding to (101) (d (101)=0.352 nm) and the particle size of catalyst was found to be 8.7 nm to 13.9 nm. This was in good agreement with the XRD results. These also indicate that the incorporation of the cobalt into TiO2 lattice did not influence its crystallinity.
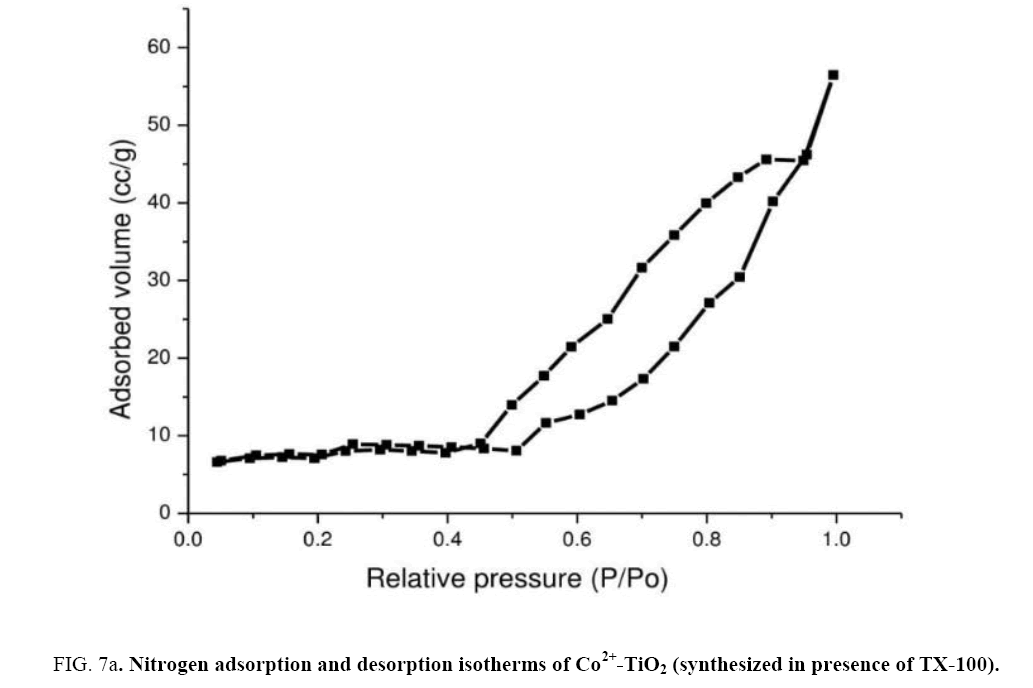
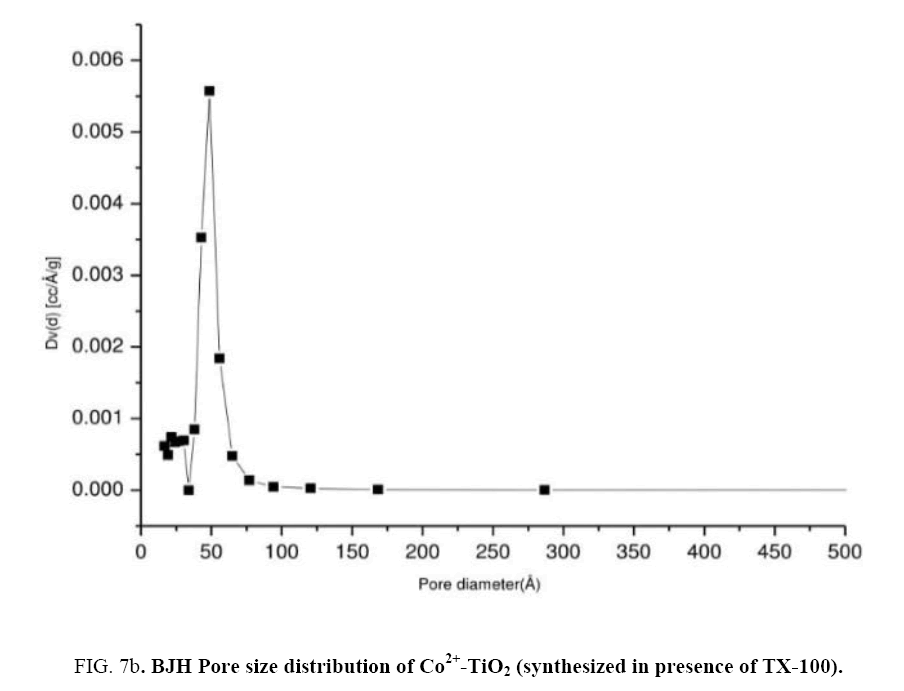
In order to determine their porous structure, nitrogen adsorption/desorption isotherms at 77 K and parameters such as surface area (A BET) was determined from BET analysis. The surface area was determined by the multipoint BET (Brunauer–Emmett–Teller) method using the adsorption data in the relative pressure (p/p0). The BJH (Barrett–Joyner–Halenda) method was applied to determine the pore volume. Figure 7(a) represented N2 adsorption-desorption isotherms of catalyst (c). From the isotherm, it was observed that at maximum and minimum relative pressure as 0.96 and 0.5 the curve shows a type IV isotherm which exhibited hysteresis loop described as H2 type and the catalysts were described as mesoporous adsorbents [29,30]. Surface area ABET (m2/g) of the Co2+-TiO2 samples were mentioned in the Table 1. From these results surface areas for catalyst (a) was 21.9 (m2/g), for catalyst (b) 26.9 (m2/g) while for catalyst (c) was determined as 40.1 (m2/g). This was due to TX-100 surfactant present during the synthesis of the catalyst. Figure 7(b) represent the pore size distribution curves of catalyst (c) obtained by BJH method. These graphs indicated the pore size distribution ranging from 20 to 40 nano meters. Catalysts with increased surface area increase the photo catalytic efficiency of the catalyst [31,32].
Figure 6: HR TEM images of (a) Undoped TiO2 (b) 0.5 wt% Co2+-TiO2 (c) 0.5 wt% Co2+-TiO2 (synthesized in presence of TX-100), (d) SAED patterns and (e) Lattice image of 0.5 wt% Co2+-TiO2 (synthesized in presence of TX-100 BET analysis.
Figure 7a: Nitrogen adsorption and desorption isotherms of Co2+-TiO2 (synthesized in presence of TX-100).
Evaluation of photocatalytic activity of the Co2+-TiO2 (synthesized in presence of TX-100)-degradation of Congo red
In order to evaluate photocatalytic efficiency of the catalyst experiments were performed for the degradation of Congo red under visible light irradiation. The photocatalytic degradation was carried out with 100 ml of CR solution (10.0 mg L-1) containing 0.1 g of catalyst nanoparticles in a 150 ml Pyrex glass vessel under continuous stirring using a magnetic stirrer. Blank experiments were conducted and it was evident that the degradation of CR was observed only in the presence of both catalyst and light. For higher photocatalytic efficiency of the catalyst various parameters like dopant concentration, catalyst dosage, pH effect and effect of initial dye concentration were investigated. The percentage degradation of the CR was calculated by using a calibrated relationship between the measured absorbance and its concentration as=(A0-At) / A0 x 100 %, Where A0=initial absorbance of CR dye solution, At=absorbance of CR dye solution at time t.
Effect of dopant concentration
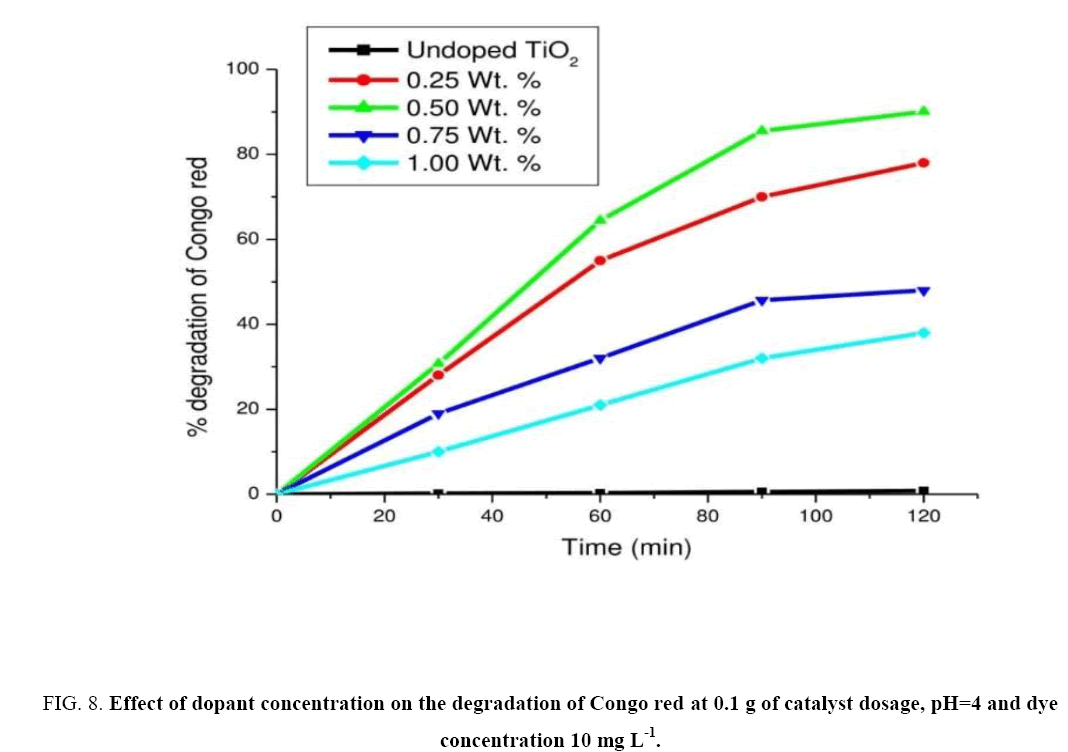
For obtaining optimum dopant concentration a set of experiments were performed with 0.25, 0.5, 0.75 and 1.0 wt% of catalyst (c) at pH=4 and dye concentration as 10 mg L-1 constant. The experimental results were shown in Figure 8. From the experimental results, it was clear that for 0.5 wt% of the catalyst exhibited higher photocatalytic activity hence considered as an optimal dopant concentration. The rate for degradation of CR was found to be 2.37 mg L-1 min-1. It was observed that with further increase in dopant concentration there was decrease in photo reactivity as seen in the case of 1.0 wt% of the catalyst. Hence further experiments were carried on with 0.5 wt% of catalyst (c).
Effect of pH
Figure 8: Effect of dopant concentration on the degradation of Congo red at 0.1 g of catalyst dosage, pH=4 and dye concentration 10 mg L-1.
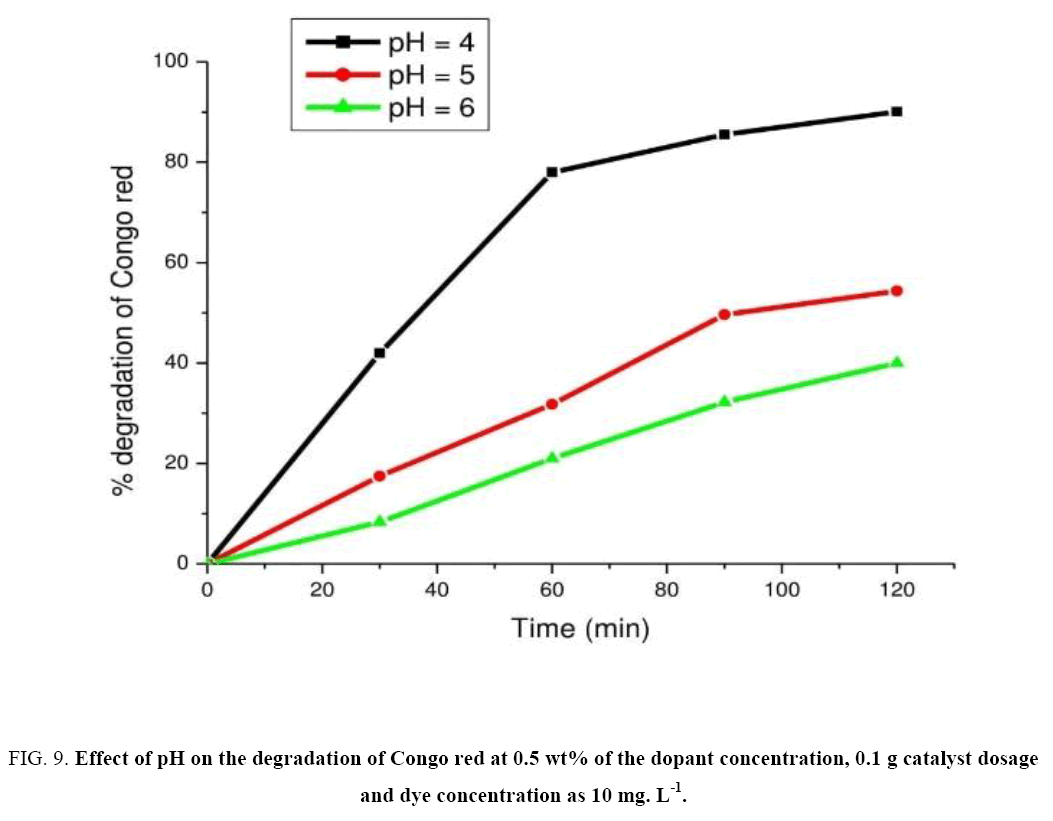
In order to find out the optimal pH of reaction mixture experiments was carried on with different pH values ranging from 4 to 6 by keeping other conditions constant. The experimental results were shown in Figure 9. From the Figure 9 the rate of degradation of CR was found to be maximum at pH=4. This shows that acidic environment favored the adsorption of the dye molecules on the catalyst surface. Since TiO2 was positively charged under acidic conditions maximum adsorption was being observed since CR was an anionic dye. The rate of degradation for catalyst was found to be maximum at pH=4 and found to be 3.34 mg L-1 min-1.
Effect of catalyst dosage
Figure 9: Effect of pH on the degradation of Congo red at 0.5 wt% of the dopant concentration, 0.1 g catalyst dosage and dye concentration as 10 mg. L-1.
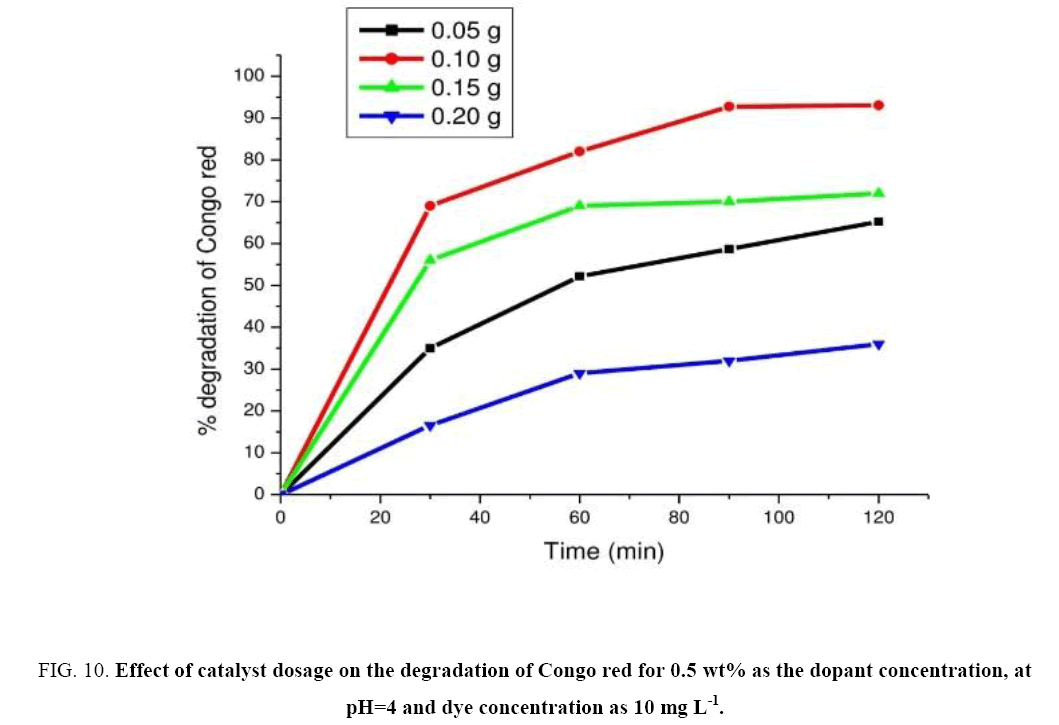
Experiments were performed for determining the optimal amount of photo catalyst by varying the concentrations of the catalyst from 0.05 g to 0.20 g in 100 ml aqueous solution of CR while keeping other conditions constant. These experimental results were represented in Figure 10. Results revealed that the rate of degradation increases linearly with increase in the amount of catalyst up to 0.1 g and then decreases (leveling off). But beyond 0.1 g of catalyst dosage solution turbidity gets increased which interferes with the penetration of light transmission. The observed rate at catalyst dosage 0.1 g was found to be 5.37 mg L-1 min-1. Hence the optimal catalyst dosage was found to be at 0.1 g of the catalyst.
Effect of initial dye concentration
Figure 10: Effect of catalyst dosage on the degradation of Congo red for 0.5 wt% as the dopant concentration, at pH=4 and dye concentration as 10 mg L-1.
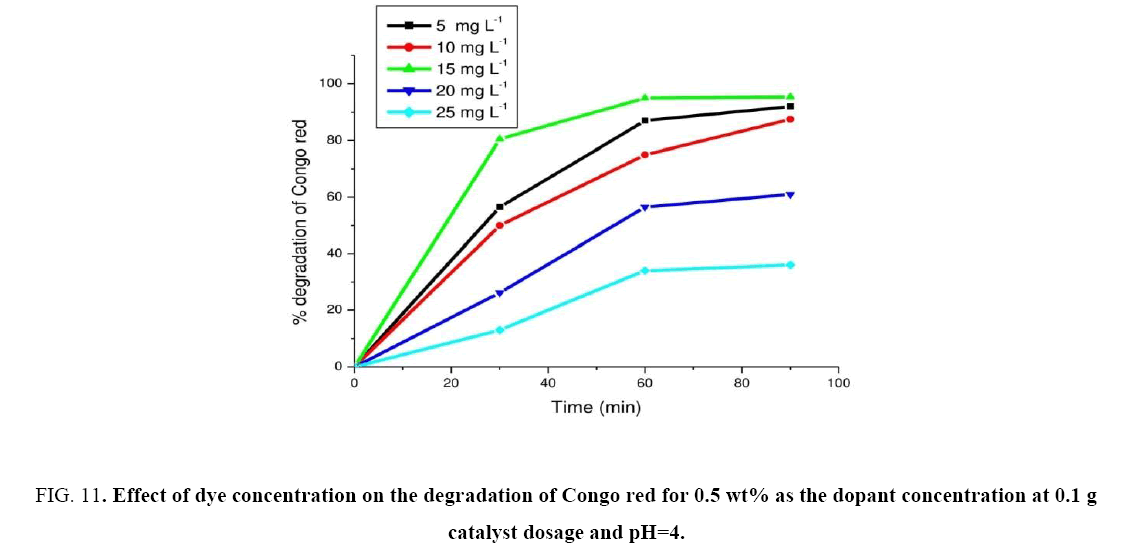
Experiments were carried out by varying the dye concentration from 5 mg. L-1 to 25 mg. L-1 for finding out the initial dye concentration. The experimental results were shown in Figure 11. From the results, the maximum photocatalytic degradation of Congo red was observed at 15 mg. L-1. Hence the CR dye concentration was found to be at 15 mg L-1 min-1. Further increment in the dye concentration there was decrease in degradation observed. The rate of degradation of CR with catalyst (c) was found to be maximum at 15 mg. L-1 and was found as 6.29 mg L-1 min-1. The photocatalytic degradation of CR was compared with those reported by other researchers [33-35]. These results are given in Table 3. Based on these values our catalyst proved to be more efficient.
Overall mechanism for the photocatalytic activity of the catalyst
Figure 11: Effect of dye concentration on the degradation of Congo red for 0.5 wt% as the dopant concentration at 0.1 g catalyst dosage and pH=4.
| S. No. | Catalyst | pH | Dye | % degradation | Time | Ref. no. | |
|---|---|---|---|---|---|---|---|
| 1 | Co2+-TiO2(synthesized in presence of TX-100) | 4 | Congo red | 94.6 | 1 h 30 min | [This work] | |
| 2 | Peroxidase (Brassica rapa) |
2 | Congo red | 70 | 2h | [33] | |
| 3 | Fe2O3nano particles | 4 | Congo red | 98.02 | 4h | [34] | |
| 4 | Zn/ TiO2 | 5.7 | Congo red | 71.78 | 3h | [35] | |
| Cu/ TiO2 | 26.94 | ||||||
| Ni/ TiO2 | 17.71 | ||||||
Table 3: The comparison of photocatalytic activity of Congo red degradation with various catalysts.
From the experimental results, the following mechanism was proposed for the photocatalytic degradation of Congo red using catalyst (c) and the possible reactions are:
1) Upon visible light illumination of the catalyst electrons were ejected from valence band to the conduction band there by leaving positive holes in the valence band and electrons in the conduction band.
Co2+/TiO2+hν → Co2+/TiO2 h+vb+Co2+/TiO2 e-cb
2) Due to doping of Cobalt into TiO2 lattice, electrons were trapped by cobalt ions and these were further scavenged by molecular oxygen, which was adsorbed on the TiO2 surface to generate superoxide radical, hydrogen peroxide (H2O2), hydroperoxy (HO2•) and hydroxyl (•OH) radicals formation takes place [36-38]. Formation of (•OH) radicals played key role in the photocatalytic degradation of Congo red pollutants.
Co2++e- → Co+ (unstable)
Co++O2 → Co2++O2•-
H2O → OH-+H+
O2•-+H+→ HO2•
2HO2•-→ H2O2+O2
H2O2+e-trapped → •OH+OH-
OH-+h+vb → •OH
3) Finally, degradation of Congo red in the solution took place due to the positive holes in the valence band which acted as good oxidizing agents
OH (or h+vb)+CR (C32H22N6Na2O6S2) → CR+
CR+ → Degradation products
Congo red was attacked by the hydroxyl radicals formed both by trapped electrons and hole in the VB as given in the above equations, further undergoing degradation and changing into colourless solution with the formation of organic radicals and other intermediates.
Conclusions
1. Co2+-TiO2 nanomaterial of different wt% (0.25, 0.5, 75, 1.0) were successfully synthesized assisted by TX-100 using sol-gel method.
2. Among synthesized catalysts 0.5 wt% Co2+-TiO2 (synthesized in presence of TX-100) nano photocatalyst was found to be efficient photocatalyst for the degradation of CR in presence of visible light.
3. Characterization results concluded that all the catalysts have shown anatase phase with decreasing band gap (2.46 eV) with decrease in average particle size (8.7 nm to 13.9 nm) with increase in surface area (40.1 m2/g), particles with irregular surface, the presence of Cobalt ions along with Ti4+and O2-in the catalyst was evident by EDS analysis and the doping of Co2+into TiO2 lattice as substitutional dopant was confirmed from FT-IR studies.
4. During the synthesis Co2+-TiO2 in presence of surfactant restricted the further growth of the particle due to encapsulation of the surfactant around the doped metal oxide.
5. Finally, the optimum conditions for the degradation of Congo red dye by Co2+-TiO2 (synthesized in presence of TX-100) catalyst include 0.5 wt.% dopant concentration, for the degradation at pH 4 with 15 mg • L-1 as CR dye concentration for 0.1 g catalyst dosage and the rate of degradation of Congo red was found to be 6.29 mg L-1 min-1.
References
- Hoffmann MR, Martin ST, Choi W, et al. Environmental applications of semiconductor photocatalysis. ChemRev.1995;95:69.
- Whang CM, Kim YK, Kim JG, et al. Photocatalyticactivity of SiO2-TiO2nanoparticles prepared by sol-hydrothermal process. Mat Sci Forum. 2004;449-52.
- Liu XH, He XB, Fu YB. Effects of doping cobalt on the structures and performances of TiO2photocatalyst. ActaChimSinica. 2008;66:1725-30.
- Zollinger H. Color chemistry: Synthesis, properties and applications of organic dyes and pigments. VCH Publisher, New York. 1991.
- Lachheb H, Puzenat E, Houas A, et al. Photocatalytic degradation of various types of dyes (alizarin s, crocein orange G, methyl red, Congo red, methylene blue) in water by UV-irradiated titania. J ApplCatal B Environ. 2002;39:75-90.
- Hachem C, Bocquillon F, Zahraa O, et al. Decolourization of textile industry wastewater by the photocatalytic degradation process. Dyes Pigments. 2001;49:117-25.
- Engweiler J, Harf J, Baiker A. WOx/TiO2 Catalysts prepared by grafting of tungsten alkoxides, morphological properties and catalytic behavior in the selective reduction of NO by NH3. Catal. 1996;159:259-69.
- Anpo M. Use of visible light. Second-generation titanium dioxide photocatalysts prepared by the application of an advanced metal ion-implantation method. J Pure Applied Chem. 2000;72:1787-92.
- Huang D, Liao S, Quan S, et al. Preparation of anatase F doped TiO2 sol and its performance for photodegradation of formaldehyde. MatSci. 2007;42:8193-202.
- Liu X, Liu Z, Zheng J, et al. Characteristics of N-doped TiO2nano tube arrays by N2-plasma for visible light driven photocatalysis. J Alloys comp. 2011;509:9970-6.
- Ohno T, Akiyoshi M, Umebayashi T, et al. Preparation of S-doped TiO2photocatalysts and their photocatalyticactivities under visible light. J ApplCatal A: Gen. 2004;265:115-21.
- Lu Y, Yu L, Liu, et al. Preparation, characterization of P-doped TiO2 nanoparticles and their excellent photocatalytic properties under the solar light irradiation. J Alloys Comp. 2009;488:314-9.
- Hirai T, Suzuki K, Komasawa I. Preparation and photocatalytic properties of composite CdS nanoparticles-titanium dioxide particles. Colloid and Interface Science. 2001;244:262-5.
- Chatterjee D, Mahata A. Demineralization of organic pollutants on the dye modified TiO2 semiconductor particulate system using visible light. Applied Catalysis B: Environ. 2001;33:119-25.
- Hou Y, Li XY, Zhao QD, et al. Fabrication of Cu2O/TiO2 nanotube heterojunction arrays and investigation of its photoelectrochemical behavior. ApplPhysLett 2009;95:093108-3.
- Amadelli R, Samiolo L, Maldotti A, et al. Preparation, characterization, and photocatalyticbehaviourof Co-TiO2 with visible light response. Photoenergy. 2008;2008:1-9.
- Barakat MA, Schaeffer HG, Hayes S, et al. Photocatalytic degradation of 2-chlorophenol by Co-doped TiO2 nanoparticles. J ApplCatal B. 2005;57:23-30.
- Wang JP, Yang HC, Hsieh CT. Visible-light photodegradation of dye on co-doped titania nanotubes prepared by hydrothermal synthesis international. J Photoenergy. 2012;2012:1-10.
- Yu X, Wang G, Luo Y, et al. Preparation and photocatalytic activity of Tio2nanoparticles. ChemResAppl. 2000; 12:14.
- Shui M, Yue L, Xu Z. Photocatalyticactivity of iron doping TiO2 prepared by several methods. ActaPhysicoChim Sin. 2001;17:282-5.
- Hoffmann MR, Martin ST, Choi W, et al. Environmental applications of semiconductorphotocatalysis. Chem Rev. 1995;95:69-6.
- Zou B, Lin J, Wang L, et al. Long structural, electronic state characterization and properties of coated TiO2 nanoparticles. ActaPhysica Sin. 1996;45:1239.
- Zhou W, Tang S, Zhang S, et al. Study on preparation of nano TiO2 by hydrolyzation of titanium-salt coated with DBS. Chinese Ceramic Society. 2003;31:858.
- Wu JCS, Chen JCH. A visible-light response vanadium-doped titaniananocatalyst by sol-gel method. J PhotochemPhotobiol A: Chem. 2004;163:509-15.
- Ogawa H, Abe A. Preparation of tin oxide films from ultrafine particles. ElectrochemSoci. 1981;128:685-9.
- Jeong ED, Borse PH, Jang JS, et al. Hydrothermal synthesis of Cr and Fe co-doped TiO2nano particle photocatalyst. Ceramic Processing Research. 2008; 9:250.
- Deng QR, Xia XH, Guo ML, et al. Mn-doped TiO2Nano powders with remarkable visible light photocatalytic activity. Mater Lett. 2011;65:2051-4.
- Lu X, Xiugian L, Zhijie S, et al. Nano composite of poly (L-lactide) and surface-grafted TiO2 nanoparticles: Synthesis and characterization. EurPolym. 2008;44:2476-81.
- Sing KSW, Everett DH, Haul RAW et al. Reportingphysisorption data for gas/solid interface with special reference to the determination of surface area and porosity. J Pure Applied Chemi. 1985;57:603-19.
- Gregg SJ, Sing KSW. Adsorption, surface area and porosity. Academic Press, New York, USA. 1982.
- Watson SS, Beydoun D, Scoot JA, et al. The effect of preparation method on the photo activity of crystalline titanium dioxide particles. Chem Eng. 2003;95:213-20.
- Chen Y, Wang K, Lou L. Photo degradation of dye pollutants on silica gel supported TiO2 particles under visible light irradiation. Photo ChemPhotobiol A: Chem. 2003;163:281-7.
- Ahmedi A, Abouseoud M, Abdeltif A, et al. Effect of diffusion on discoloration of Congo red by alginate Entrapped turnip (Brassica rapa) peroxidase. Hindawi Publishing Corporation Enzyme Research. 2015;575618:9.
- Leena B, Mohit B, Mohan Kumar S. An analysis of Fe2O3assisted photocatalytic degradation of Congo red. J ToxEnv Health Sci. 2012;4:62-9.
- Lopez VA, Santamaria D, Tibata M, et al. Congo red photocatalyticdecolourization using modified titanium.Int JChemMolNuc Mat Metal Eng. 2010;4:11.
- Wu T, Lin T, Zhao J, et al. Photocatalyticdegradation of organic pollutants under visible light irradiation. J Environ Sci Technol. 1999;33:1379-87.
- Balaram KA, Siva RT, Sreedhar B. Synthesis, characterization and photocatalytic activity of alkaline earth metal doped titrania. Ind J Chem. 2010;49:1189-96.
- Teshome AS, Siva RT, Subramanyam Ch. Visible light active Cu2+/TiO2 Nanocatalyst for degradation of dichlorvos. Int J Nanosci. 2012;11:1250030-42.


