Original Article
, Volume: 13( 3)Synthesis, Characteristics and Kinetic Study of Magnetic-Zeolite Nano Composite for Adsorption of Zirconium
- *Correspondence:
- Leila Eskandari , Faculty of Chemical Engineering, Urmia University of Technology, Urmia, Iran, Tel: 00989388422745; E-Mail: leilaeskandari111@gmail.com
Received: June 11, 2018; Accepted: October 26, 2018; Published: October 31, 2018
Citation: Eskandari L, Kheiri F. Synthesis, Characteristics and Kinetic Study of Magnetic-Zeolite Nano Composite for Adsorption of Zirconium. Chem Technol Ind J. 2018;13(3):126.
Abstract
In this research, magnetic-zeolite nano-and micro-composite adsorbents, including nano-and micro-sized zeolite clinoptilolite and iron oxide were synthesized. Natural clinoptilolite tuff was pre-treated and converted into micro-and nano-particles by using a mechanical method. Then, preparation of iron oxide nano-crystals in the presence of nano-and micro-zeolite was followed. The samples were applied to characterize the adsorbents by X-Ray Diffraction, X-Ray Fluorescence, Fourier-Transform Infra-Redspectroscopy, Derivative Thermo Gravimetry, Scanning Electron Microscopy, Transmission Electron Microscopy, and Vibrating Sample Magnetometry, The nano-and micro-composites were evaluated for Zirconium (Zr) removal from aqueous solutions. The effects of the analytical variables, including pH, initial ion concentration, contact time, and temperature were investigated. The process followed a Pseudo-Second Order (PSO) kinetic model with k2 values of 1.596 and 1.396 meq-1 h-1 for Magnetic Zeolite Nano-Composite (MZNC) and Magnetic Zeolite Composite (MZC), respectively. The saturation magnetization of the nano-composite was measured as 19.50 emu g-1 by which the magnetic separations of the samples were facilitated after the adsorption process. The thermodynamic values of ∆G° and ∆H° represented the endothermic and spontaneous natures of Zr removal.
Keywords
Micro-composite; Nano-composite; Thermodynamic; Kinetic; Isotherm
Introduction
Zirconium is one of the rare elements widely used in advanced modern technology. During the past decades, the unique chemical and physical properties of zirconium have led to the widespread use of this element in metallurgy, surgical appliances and the manufacturing of photoflash bulbs. Aside from its ability for industrial applications, Zr is mostly produced today to be applied to water-cooled nuclear reactors. However, fast industrialization to satisfy the population needs by using heavy metals has led to ecosystem contamination. Treatment of heavy metals is of special concern due to their recalcitrance and persistence in the environment [1,2]. Zirconium is a heavy metal with a great risk potential to humans and other organisms in the environment as it has a long half-life. Ion exchange process is one of the most effective approaches to the treatment of heavy metals [3-6]. Among various ion exchangers, zeolites have received considerable attention for removing contaminants due to their high exchange capacities, low costs, and worldwide abundance [6-10]. Considering their large-scale utilizations, natural zeolites seem to be more ascendant than their synthetic counterparts due to their low costs, abundance, and less chemical pollutions caused during their production [11]. Compared to the micro-sized zeolites, nano-crystalline zeolites have greater ion-exchange abilities, quicker exchange kinetics, larger surface areas, and more adjustable porosities. Yet, despite these advantages, separating them from the medium is a major challenge. This can be coped with by the use of magnetic separation method. By applying micro- or nano-magnetic composites, this new technique opens a simpler, faster, and more accurate way to the removal of elements.
Liu Haibo et al. synthesized magnetic zeolite NaA to remove Cu2+ and Pb2+ [12]. Sharma. et al. reported the sorption behavior of nanocrystalline mordenite for Th4+ and Eu+3 [13]. E Chmielewska et al. investigated nano-FeO(OH) modified clinoptilolite tuff for antimony removal [14]. Faghihian et.al. Synthesized a novel PAN-zeolite nanocomposite for removal of Cs+ and Sr2+ from aqueous solutions [15]. In this work, magnetic nano-and micro-composites were synthesized and characterized for studying their efficiencies of Zr removal from aqueous solutions. Meanwhile, the effects of varied parameters, such as pH, initial ion concentration, contact time, and temperature were evaluated and optimized. Moreover, for the experimental data assessment, different kinetic and isotherm models were employed.
Experimental Procedure
Reagents and apparatuses
All the chemical reagents used in this study were of analytical reagent grade [AR Grade]. FeCl3-6H2O (Aldrich 98%), FeCl2-4H2O (Aldrich 99%), and ammonium hydroxide (Aldrich 28%-30% of ammonia) were applied for magnetic particle preparation and Zr was supplied as zirconium chloride by Merck. The natural clinoptilolite tuff belonged to Semnan region in the north-east of Iran. Identifications of the structural phases of nano-and micro-composites were done by using a Bruker D8 ADVANCE X-Ray diffractometer. The chemical compositions of the samples were determined through PANalytical Magix XRF spectrometry. An IR Prestige-21 Model spectrophotometer (Shimadzu, Japan) was utilized to obtain FT-IR spectra. Thermo-Gravimetric Analysis (TGA) of the samples was performed using a METTLER TG-50 Thermal Analyzer with a heating rate of 10°C min-1. To characterize MZNC and MZC magnetic properties, a vibrating sample magnetometer (Meghnatis Daghigh Kavir Company, Iran) was used. A Philips EM-208S transmission electron microscope was utilized to take the relevant images. Also, ICP-AES technique (Integra XL by GBC Australia) was employed to specify Zr concentration.
Pre-treatment of clinoptilolite
Natural clinoptilolite tuff was converted into micron-sized particles by crushing and pulverizing in an agate mortar and sieving using analytical sieves for separating the particle sizes of 200-400 μm. The nanoparticle powders from clinoptilolite were obtained by mechanical ball-mill method (600 rpm, 6 h) of micro-clinoptilolite powder. To remove water-soluble and magnetic impurities, the obtained powders were heated at 70°C in distilled water on a magnetic stirrer for 8 h. To reach a fixed water content, the powders were stored in a desiccator over a saturated sodium chloride solution for 2 weeks after centrifuging and drying them.
Synthesis of magnetic zeolite nano and micro-composite
MZNC and MZC were prepared through the precipitation of Fe (III) and Fe (II) in the presence of nano-and micro-sized zeolite powders. An aqueous ammonia solution (1 M) was placed in a round-bottom flask and the known amounts of nano-or micro-zeolite powders were added to the ammonia solution. The mixture was homogenized by vigorous mechanical stirring and deoxygenated by bubbling of N2 gas for 30 min. The solutions of ferric chloride (1 M in water) and ferrous chloride (2 M in HCl 2 M) with a volume ratio of 4:1 were prepared and mixed together. The Fe(III)/Fe(II) solution was added dropwise to the nano- or micro-zeolite/ammonia mixture while stirring the mixture vigorously under N2 atmosphere. Separations of the prepared composites were done by using a permanent magnet. Finally, the products were washed four times with deionizeddeoxygenated water and then dried at 50°C for 5 h.
Adsorption experiments
Zr solutions were prepared by dissolving 2.6067 g of zirconium tetrachloride (ZrCl4) in 1000 mL of distilled water. The initial pH value of 2 underwent an adjustment by adding HCl and NaOH.
The adsorption experiments were performed by agitating 0.05 g of the composites with 10 ml of Zr solution in a thermostat rotary shaker. After each adsorption experiment, The magnetic composites were easily segregated by using a permanent magnet. ICP-AES technique (GBC Integra XL) was utilized to measure Zr after taking a portion of the supernatant solution. The adsorbed Zr amount was calculated with regard to the concentration differences prior to and subsequent to the adsorption.
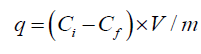 (1)
(1)
The distribution coefficient (Kd) was calculated as follows:
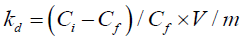 (2)
(2)
where q is the number of metal ions adsorbed per unit mass of the adsorbent (meq g-1); Ci and Cf are the initial and final concentrations (meq l-1), respectively; m is the adsorbent amount used (g), and V is the volume of Zr solution (L). The effects of the different parameters, including initial Zr concentration, pH of the solution, contact time, and temperature were determined by changing one parameter at a time and keeping the others constant.
Results and Discussion
Characterization of MZNC
The XRD patterns of raw nano-clinoptilolite (NCP) and magnetite zeolite nano-composite (MZNC) are shown in FIG. 1. The characteristic lines at 2θ values of 10.1°, 11.4°, 17.3°, 23°, 26°, 28.2°, 30.2°, 32°, 35°, 37° and 39° in the pattern (a) can be indexed to clinoptilolite crystalline structure data [16]. This confirms that the sample used in this work has a typical clinoptilolite phase as the microporous component. The diffraction line of iron oxide was observed at 2θ values of 35.9°, 42° and 73° in the XRD pattern of MZNC sample (b) indicates formation of the Iron oxide in the zeolite structure [17]. The relative line intensity and line position related to zeolite clinoptilolite remained unchanged, representing that the crystal structure of zeolite had been stable during the composite preparation. Through Scherrer’s equation [18], the magnetite particle size of the composite was found to be 22.4 nm.

Figure 1: XRD patterns of the nano zeolite (matched with a reference pattern of clinoptilolite) (a), and MZNC (b).
The chemical compositions of zeolite and MZNC (TABLE 1) were obtained through XRF analysis. The composite consisted of 19.86 wt.% Fe2O3. The Si/Al ratio of the present zeolite sample was 4.85, which was consistent with the previous findings placing the ratio within a range of 4-5.5 [19]. The Theoretical Cation Exchange Capacity (TCEC) was estimated by the sum of the exchangeable ions, including Na+, K+, Ca2+, and Mg2+ in the zeolite. The difference between TCEC and Cation Exchange Capacity (CEC) (TABLE 1) was due to the fact that some counter-ion sites in the zeolite particles were unavailable for cation exchange.
| Compound | SiO2 | Al2O3 | Na2O | TiO2 | K2O | CaO | MgO | SrO | Fe2O3 | LOIa | Total | Si/Al | TCECC | CECC |
| Clinoptilolite | 67.41 | 11.82 | 2.66 | 0.1 | 2.44 | 1.31 | 0.71 | 0.13 | 1.32 | 11.46 | 99.54 | 4.85 | 1.736 | 1.561 |
| MZNC | 53.21 | 9.28 | 1.92 | 1.096 | 1.48 | 1.25 | 0.71 | n.d.b | 19.86 | 12.01 | 99.81 | 4.87 | 1.335 | 1.218 |
a loss on ignition
but detected
c(meq g-1)
Table 1: Chemical compositions of zeolite and MZNC obtained by XRF method.
The FT-IR spectra of the zeolite and composite were recorded over a range of 400-4000 cm-1 (FIG. 2). Water absorption bands at 1638 cm-1 within the range of 3000-3600 cm-1 confirmed significant hydrations of the zeolites. The band at 1070 cm-1 was assigned to the asymmetric stretching vibration modes of the internal T-O bonds in TO4 tetrahedra (T=Si and Al). The bands at 609 and 465 cm-1 arose from the stretching vibration modes of O-T-O groups and the bending vibration modes of T-O bonds, respectively [20]. For the zeolites, the regions corresponding to (Si-O and Al-O) and (O-Si-O and O-Al-O) demonstrated strong bands, indicating an increase in the surface areas and aluminosilicate bonds of the zeolites. The characteristic band related to Fe-O-Fe bond of iron oxide must have appeared at 584 cm-1 [17].

Figure 2: FTIR spectra of clinoptilolite and MZNC.
In the DTG curves of the micro- and nano-zeolites, MZC and MZNC, four weight-loss peaks occurring between 50°C and 120°C were attributed to the loss of the adsorbed water FIG. 3 (a and b). After 280°C, the adsorbents exhibited no dehydration peaks up to 800°C, indicating that the samples were thermally stable.

Figure 3a: DTG curves of clinoptilolite and MZC.

Figure 3b: DTG curves of Nano clinoptilolite and MZNC.
The difference between the amorphous surface structures of the natural zeolite sample and nano zeolite clinoptilolite with a uniform surface was apparent according to SEM images FIG. 4 (a and b). Due to the lack of uniformity and a wide range of particle dimensions, determination of the particle size distribution could not be accurately performed for micro-sized clinoptilolite, according to (FIG. 4a), but for nano-sized particles depicted in FIG. 4b. Also, TEM images showed iron oxide particles to have been nano-sized and bound to the alumino-silicate framework of nano-zeolite (FIG. 4c).

Figure 4(a and b): SEM images of zeolite clinoptilolite (a) and nano clinoptilolite (b).

Figure 4c: TEM images of MZNC.
A major feature of these novel composites was their magnetic properties, which were characterized by a vibrating sample magnetometer in this study FIG. 5. The magnetic curve showed no hysteresis loop and remanence, indicating the good superparamagnetic properties MZNC. The zero amount of remanence ensured that no magnetization had been retained by the composites after being exposed to an external magnetic field and they could be thus re-dispersed after removing the magnetic field. Nanocomposite exhibited the saturation magnetizations of about 19.50 emu g-1 at 298 K. This value verified the sufficient magnetic properties of MZNC to be attracted by a permanent magnet.

Figure 5: The hysteresis loops of MZNC.
The Effects of the Experimental Conditions on the Adsorption Process
Effect of pH
The effect of pH on Zr removal by the natural zeolite, MZC, and MZNC at pH<3.5 for [Zr]=1.5-10 mmol L-1 is shown in FIG. 6. The results revealed an increase in the adsorption capacity with pH enhancement due to the nature of the absorption process. At a constant concentration of 0.01 mol L-1 for Zr solution, maximum adsorption capacity was observed at pH=2. Higher pH values were not examined due to Zr precipitation at pH>3.5. In the adsorption process using zeolite clinoptilolite, the intense competition between H3O+ and Zr ions for the exchange sites led to the reduced absorption of H3O+ ions because of their small sizes, high ionic mobilities, and consequently high penetration powers, especially at an acidic pH. A decrease and increase in the competition and absorption capacity were expected with the declined concentration of H3O+. The increasing process of the absorption capacity continued until pH=2 was reached. In the next step, a steady rate of absorption was achieved after eliminating the competition of hydronium ions.

Figure 6: Effect of pH on sorption of Zr.
Effect of contact time
The contact time effects of clinoptilolite, MZC, and MZNC on Zr adsorption were studied at a concentration of 0.01 mol L-1 of Zr solution at 25°C. The results are shown in FIG. 7. In all the absorbents, the equilibration was attained after 24 h. From the slopes of the curves, it was concluded that the adsorption rate had been fast at the beginning and become slow with the reaction progress. The absorption rate induced by MZNC was so rapid that more than 80% of the maximum absorption capacity for Zr was obtained during the first 3 hours. Ion exchange reaction with this adsorbent was achieved after 24 h and the sorption capacity was fixed. Therefore, this time was selected as the optimal contact time for the nanocomposite. These results indicated that the absorption rate triggered by the nano-composite was faster than those induced by the micro-composite and clinoptilolite. This high absorption rate could be attributed to the nanometer dimensions of zeolite particles.

Figure 7: Effect of contact time on adsorption of Zr onto clinoptilolite, MZC, and MZNC.
Kinetics and Thermodynamics of the Adsorption
The four different models of the pseudo-first-order equation (PFO), the pseudo-second-order equation (PSO), Elovich equation, and intra-particle diffusion were applied to evaluate the adsorption kinetics. The experimental data obtained from batch experiments were fit after testing these models.
Generally, a PFO equation can be expressed as follows:
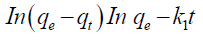 (3)
(3)
where qe and qt are the ion amounts adsorbed per unit mass of the adsorbent (mg/g) at equilibrium and at any time t, respectively and k1 is the rate constant of PFO sorption (min-1). The values of k1 and qe are determined from the slope and the intercept of plots of log (qe-qt) vs. t. The results are listed in TABLE 2. Although no extremely low values were obtained for R2, the calculated qe was not consistent with that of the experimental data. Therefore, the adsorption process did not follow a PFO model. The linear form of the PSO kinetic model is written as follows:
| sorbents | qe (exp.) (×10-1) (meqg-1) | pseudo-first-order model | pseudo-second-order model | |||||
|---|---|---|---|---|---|---|---|---|
| k1 (×10-1) (h-1) |
qe (theor.) (×10-1) (meqg-1) |
R2 | k2 (meq-1 h-1) |
qe (×10-1) (meq g-1) | h (×10-1) (meq g-1h-1) |
R2 | ||
| Clinoptilolite | 6.8 | 1.644 | 2.675 | 0.9575 | 1.072 | 7.032 | 5.3036 | 0.999 |
| MZC | 6.2 | 1.285 | 1.337 | 0.9647 | 1.396 | 6.215 | 5.393 | 0.9978 |
| MZNC | 8.9 | 1.863 | 4.212 | 0.8648 | 1.596 | 9.027 | 13.005 | 0.9997 |
Table 2:Kinetic parameters of pseudo-first-order and pseudo-second-order kinetic models.
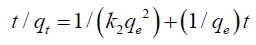 (4)
(4)
The initial sorption rate can be calculated by the following formula:
 (5)
(5)
where k2 is the rate constant of PSO sorption (g/mg/min). The calculated values of k2, qe, and h values and the correlation coefficients (R2) are listed in TABLE 2. The comparison of k2 values indicated a faster ion adsorption onto MZNC than onto MZC and clinoptilolite.
The intra-particle diffusion effect on the total rate of ion exchange was demonstrated by the association of the adsorbed ion amount and the square root of time. The equation of intra-particle diffusion model is exhibited as follows:
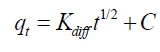 (6)
(6)
where Kdiff is the rate constant of intra-particle diffusion (mg/g/min) and C stands for the intercept. As evidenced by the results, intra-particle diffusion cannot provide a rate-determining step in the sorption process (TABLE 3). Elovich equation is given as follows:
| sorbents | Elovich model | Intra-particle diffusion model | ||||
|---|---|---|---|---|---|---|
| α (×10-1) (meq g-1 h-1) | β (meq-1) | R2 | kdiff (×10-2) (meg g-1 h-1/2) | C (×10-2) (meq g-1) | R2 | |
| Clinoptilolite | 38.904 | 10.8565 | 0.9014 | 6.663 | 26.82 | 0.6481 |
| MZC | 32.633 | 11.737 | 0.8793 | 6.093 | 24.33 | 0.6446 |
| MZNC | 14.928 | 62.037 | 0.6347 | 7.436 | 44.89 | 0.4914 |
Table 3: Kinetic parameters of Elovich and intra-particle diffusion models.
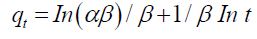 (7)
(7)
where qt is the sorption capacity at time t; a is the initial sorption rate of Elovich equation (mg/g/min), and parameter b is related to the extent of surface coverage and activation energy for chemisorptions (g/mg). The constants calculated from the slope and the intercept of the plot of qt vs. ln t are listed in TABLE 3. The comparison of the calculated qe and correlation coefficients for the kinetic models revealed that PSO equation best matched with the experimental data. These results demonstrated that the overall sorption rate had been controlled by the chemical sorption process [21].
Sorption thermodynamics
The effect of sorption temperature on Zr removal was investigated at five different temperatures. The adsorption capacity enhanced with increasing temperature (FIG. 8). The thermodynamic parameters, including enthalpy change (ΔH°) and entropy change (ΔG°) can be obtained using Van’t Hoff equation:

Figure 8: Effect of temperature on Zr adsorption onto clinoptilolite, MZC and MZNC.
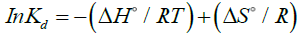 (8)
(8)
A plot of lnkd vs. 1/T is shown in FIG. 9. The free energy change of the adsorption (ΔG°) is calculated as follows:

Figure 9: Van’t Hoff plot for adsorption of Zr onto clinoptilolite, MZC, and MZNC.
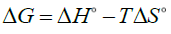 (9)
(9)
The calculated thermodynamic parameters are summarized in TABLE 4. Since ΔH° values are positive, the adsorption process is endothermic in nature. The positive values of ΔS° suggested that the randomness at the solid/solution interface had increased during the sorption process. The negative values of ΔG° indicated that Zr adsorption reaction was spontaneous. The decrease in ΔG° values with increasing temperature showed that the spontaneous nature of sorption was directly proportional to temperature. Therefore, the adsorption process was favored when the temperature was augmented. The greater absolute values of ΔG° for MZNC compared to MZC and clinoptilolite revealed that the adsorption of the former on Zr had been more favored.
| ΔG° (kJ mol-1) | ΔS° (kJ mol-1 K-1) | ΔH° (kJ mol-1) | Sorbent |
|---|---|---|---|
| -7.21 | 34.51 | 3.07 | Clinoptilolite |
| -6.98 | 34.87 | 3.41 | MZC |
| -8.001 | 37.1 | 3.05 | MZNC |
Table 4: Thermodynamic parameters of Zr adsorption.
Sorption Isotherm
To investigate the effect of initial concentration, various concentrations of Zr solution were equilibrated with constant amounts of the adsorbents (FIG. 10). The initial fast adsorption was followed by a slow approach to equilibrium at a higher concentration. Three isotherm models, including Langmuir, Freundlich, and Dubinin–Radushkviech (D-R) models were employed to examine the experimental data.

Figure 10: Effect of different initial ion concentration on Zr adsorption onto clinoptilolite, MZC and MZNC.
Langmuir isotherm model
Langmuir isotherm assumes that the sorption occurs at specific homogeneous sites within the adsorbent. This model is expressed by:
 (10)
(10)
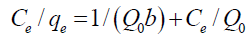
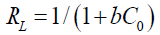
where Qo denotes the saturation adsorption capacity (mg/g) and b represents the Langmuir constant related to the free energy of adsorption calculated from the slope and intercept (TABLE 5). The plot of Ce/qe vs. Ce is shown in FIG. 11. The important parameter of Langmuir isotherm is the dimensionless constant, RL, which can be calculated as follows:

Figure 11: Langmuir isotherm plots for adsorption of Zr onto clinoptilolite, MZC and MZNC.
| Isotherm | Sorbents | Model parameters | |||
| Qο (mg g-1) | b×103 (L mg-1) | RL×103 | R2 | ||
| Langmuir | Clinoptilolite | 195.31 | 11.56 | 18.6 | 0.9972 |
| MZC | 188.67 | 8.096 | 26 | 0.9964 | |
| MZNC | 270.27 | 8.375 | 25 | 0.9968 | |
| Model parameters | |||||
| n | Kf (mg g-1) | R2 | |||
| Freundlich | Clinoptilolite | 2.18 | 630.23 | 0.9268 | |
| MZC | 2.09 | 497 | 0.9717 | ||
| MZNC | 2.189 | 808.7 | 0.9274 | ||
| Model parameters | |||||
| β (×10-9)(mol2 kJ-2) | qm (mmol g-1) | E (kJ mol-1) | R2 | ||
| D-R | Clinoptilolite | 6.00 | 1.003 | 9.32 | 0.9771 |
| MZC | 6.00 | 1.001 | 8.97 | 0.9717 | |
| MZNC | 6.00 | 1.012 | 9.506 | 0.9628 | |
Table 5: Adsorption isotherm parameters for Zr adsorption.
 (11)
(11)
where C0 stands for the highest initial metal ion concentration (mg/L). The values of this parameter indicate the unfavorable (RL>1), linear (RL=1), favorable (0<RL<1), and irreversible (RL=0) types of the adsorption isotherm [22].
The obtained data confirmed that Zr adsorption was favorable. The maximum adsorption capacity of MZNC for Zr removal was compared with those of the other adsorbents reported in the literature (TABLE 6). MZNC was seen to depict a high adsorption capacity for this ion. On the other hand, the magnetic composites could be easily separated from the solutions using a permanent magnet.
| Sorbent | Qm(mgg-1) | Reference |
|---|---|---|
| Clinoptilolite | 83.12 | 6 |
| Coriolus versicolor | 71.00 | 24 |
| Rice bran | 50.00 | 25 |
| Citrus peel waste biomass (CPWB) | 42.02 | 26 |
| Magnetic zeolite composite | 188.67 | This work |
| Magnetic zeolite nano composite | 270.27 | This work |
Table 6: The adsorption capacity of Zr by some adsorbents.
Freundlich isotherm model
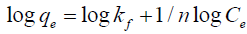
Freundlich isotherm model makes the assumption that multi-layer sorption occurs at a heterogeneous surface. This model was used to estimate the intensity of the adsorption process and the relative sorption capacity. A linear form of the Freundlich equation is shown as follows:
 (12)
(12)
where Kf denotes the Freundlich constant relevant to the adsorbent capacity and n displays the constant related to the intensity of the adsorption process. The Freundlich isotherm is shown in FIG. 12 and their constants are represented in TABLE 5. The Freundlich constant (n) was greater than its unity, indicating that an increasing tendency of the adsorption process had occurred with the elevation of ion concentration. Kf value of MZNC was higher compared to those of MZC and clinoptilolite, corroborating a greater adsorption tendency of the adsorbents towards MZNC.

Figure 12: Freundlich isotherm plots for adsorption of Zr onto clinoptilolite, MZC and MZNC. Dubinin-Radushkviech isotherm model
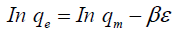
D–R isotherm was used to distinguish between the physical and chemical adsorptions of the ions and estimate the apparent free energies of adsorption. The related equation is given as follows:
 (13)
(13)
where qm is the maximum adsorption capacity (mequiv/g); is the D-R constant related to the sorption energy (mol2/K/J2), and e is the Polanyi potential.
 (14)
(14)
where R is the gas constant (kJ-1mol-1K) and T is the absolute temperature (K). The D–R isotherm is plotted in FIG. 13 and the obtained parameters are represented in TABLE 5. In a solution, when 1 mol of an ion is transferred to the surface of an adsorbent from infinity, its free energy is called the mean energy of adsorption (E), which is calculated as follows:

Figure 13: D-R isotherm plots for adsorption of Zr onto clinoptilolite, MZC and MZNC.
 (15)
(15)
The magnitude of E within a range of 8-16 KJ/mol demonstrates that the sorption process is done through an ion exchange interaction. The reaction mechanism can be related to the magnitude of E. When E value is within the range of 8-16 kJ/mol, the sorption process is followed by ion exchange, but when E<8.0 kJ/mol, physical forces are responsible for the process [23].
Conclusion
The magnetite-zeolite nano-and micro-composites were synthesized, characterized, and evaluated for Zr removal from aqueous solutions. The nano-composite represented a high cation exchange capacity, high selectivity towards Zr, and rapid adsorption kinetics as compared to the micro-composite of zeolite. The nano-composite displayed a 26.9% increase in adsorption capacity. The results of the kinetic studies suggested that the initial sorption rate and rate constant were greater when using the nano-composite instead of the micro-composite. The VSM results verified the sufficient magnetic strengths of the nano-and micro-composites to be attracted by a magnetic field. The PSO model gave a better correlation with the experimental kinetic data compared to the PFO model, confirming the dominant process of the chemical sorption. The values of the thermodynamic parameters demonstrated the endothermic and spontaneous natures of the adsorption process.
References
- Sounthararajah DP, Loganathan P, Kandasamy J et al. Removing heavy metals using permeable pavement system with a titanate nano-fibrous adsorbent column as a post-treatment. Chemosphere. 2017;168:467-73.
- Zanin E, Scapinello J, de Oliveira M, et al. Adsorption of heavy metals from wastewater graphics industry using clinoptilolite zeolite as an adsorbent. Process Saf Environ Prot. 2017;105:194-200.
- Yurekli Y. Removal of heavy metals in wastewater by using zeolite nano-particles impregnated polysulfone membranes. J hazard mater. 2016;309:53-64.
- Dulanská S, Remenec B, Gardoňová V, et al. Determination of 93Zr in radioactive waste using ion exchange techniques. J Radioanal Nucl Chem. 2012;293(2):635-40.
- Leal M, Martínez-Hernández V, Meffe R, et al. Clinoptilolite and palygorskite as sorbents of neutral emerging organic contaminants in treated wastewater: Sorption-desorption studies. Chemosphere. 2017;175:534-42.
- Faghihian H, Kabiri-Tadi M. Removal of zirconium from aqueous solution by modified clinoptilolite. J Hazard Mater. 2010;178(1-3):66-73.
- Noli F, Buema G, Misaelides P, et al. New materials synthesized from ash under moderate conditions for removal of toxic and radioactive metals. J Radioanal Nucl Chem. 2015;303(3):2303-11.
- Cretescu I, Soreanu G, Harja M. A low-cost sorbent for removal of copper ions from wastewaters based on sawdust/fly ash mixture. J Environ Sci Technol .2015;12(6):1799-810.
- D.A, Rio DHD, Al-Jubouri S et al. J Hazard Mater. 2016;303:181.
- Ltaief OO, Stéphane S, Sophie F et al. 2015;10:1123-33.
- Wen J, Yi Y, Zeng G. Effects of modified zeolite on the removal and stabilization of heavy metals in contaminated lake sediment using BCR sequential extraction. J Environ Manag. 2016;178:63-9.
- Liu H, Peng S, Shu L, et al. Magnetic zeolite NaA: Synthesis, characterization based on metakaolin and its application for the removal of Cu2+, Pb2+. Chemosphere. 2013;91(11):1539-46.
- Sharma P, Tomar R. Sorption behaviour of nanocrystalline MOR type zeolite for Th (IV) and Eu (III) removal from aqueous waste by batch treatment. J Colloid Interface Sci. 2011;362(1):144-56.
- Chmielewská E, Tylus W, Drabik M, et al. Structure investigation of nano-FeO (OH) modified clinoptilolite tuff for antimony removal. Microporous and Mesoporous Materials. 2017;248:222-33.
- Faghihian H, Iravani M, Moayed M, et al. Preparation of a novel PAN–zeolite nanocomposite for removal of Cs+ and Sr2+ from aqueous solutions: Kinetic, equilibrium, and thermodynamic studies. J Chem Eng. 2013;222:41-8.
- Treacy MM, Higgins JB Collection of simulated XRD powder patterns for zeolites fifth (5th) revised edition. Elsevier; 2007.
- Maity D, Agrawal DC. Synthesis of iron oxide nanoparticles under oxidizing environment and their stabilization in aqueous and non-aqueous media. J Magn Magn Mater. 2007;308(1):46-55.
- Klug HP, Alexander LE. X-ray diffraction procedures: for polycrystalline and amorphous materials. X-Ray Diffraction Procedures: For Polycrystalline and Amorphous Materials, 2nd Edition, by Harold P. Klug, Leroy E. Alexander, pp. 992. ISBN 0-471-49369-4.Wiley-VCH,1974:992.
- Breck DW, Sieves ZM. Structure, chemistry and use. Zeolite Molecular Sieves. Wiley, New York. 1974.
- Bekkum HV, Flanigen EM, Janson JC et al. Introduction to Zeolite Science and Practice, Elsevier, Amsterdam, 2001.
- Ho YS, McKay G. Pseudo-second order model for sorption processes. Process Biochem. 1999;34(5):451-65.
- Mohan D, Chander S. Single, binary, and multicomponent sorption of iron and manganese on lignite. J Colloid Interface Sci. 2006;299(1):76-87.
- Helfferich FG, Dranoff JS. Ion Exchange. McGraw-Hill, New York 1962, 624 pp. $16.00.
- Nawaz BH, Misbah A. Ecolo Eng. 2013;51:178-180.
- Zolfonoun E, Monji AB, Taghizadeh M, et al. Selective and direct sorption of zirconium from acidic leach liquor of zircon concentrate by rice bran. Miner Eng. 2010;23(9):755-6.
- Nawaz BH, Zaman Q, Kausar A, et al. Ecolo Eng. 2016;95:216-228.