Original Article
, Volume: 17( 1) DOI: 10.37532/0972-768X.2019.17(1).305Prediction the Adsorption Mechanism of Sodium ion on ACTF Surface via A New Theoretical Molding
- *Correspondence:
- Hosny R
Department of Production, Egyptian Petroleum Research Institute
Cairo, Egypt
Tel: (202)22747847
E-mail: dr.rashahosny@yahoo.com
Received: March 06, 2019; Accepted: March 25, 2019; Published: March 27, 2019
Citation: Hosny R, El Aily M, Mansour EM, et al. Prediction the Adsorption Mechanism of Sodium ion on ACTF Surface via A New Theoretical Molding. Int J Chem Sci. 2019;17(1):305
Abstract
In this fascinating and wide framework, we have described the properties of ACTF and their applications as an adsorbent for sodium ion. As result of the experimental work of sodium ion adsorption behavior was been unavailability due to consuming money and experimental time, it is vital to use the empirically derived correlation equation to deduce the adsorption behavior of sodium ion quantitive concentration (QC) on ACTF. The data used in this model are obtained from 76 data points of sodium ion QC (100 mg/L) collecting from different places in Egypt at various temperatures and times 35-65°C and 5-130 min, respectively. In this study, the adsorption behavior of sodium ions (QC) on ACTF is predicted by theoretical calculations, as a function of time and temperature. A high accuracy of the new empirical model that proposed by non-linear regression analysis was (r2=93.52%) which indicate high reliability of the proposed correlation. The new model was validated by using 72 different data points with obtained high accuracy of r2=89.8, 90.0 and 91.0% at 35°C 45°C and 65°C, respectively. Finally, the obtained theoretical computations results appear that this model is more statistical accuracy and relevant to be the first publication to be applied in this field.
Keywords
Carbon nanostructures; ACTF; Sodium ion adsorption; Non-linear regression analysis; Statistical accuracy
Introduction
One of the abundant and inexpensive sources of renewable lingo-cellulosic biomass is renewable agricultural waste annually, and its uses attract more attention, particularly with regard to the production of new chemically modified materials for environmentally friendly industrial use. In late, the surface modifications of carbon starters have been linked to raise adsorption limits of carbon materials, especially the amorphous carbon [1-3]. NaCl the major component making seawater saline, the seawater is a good source of water, and, but its salinity does not allow it for human consumption [4,5]. Sea water is not only composed of sodium chloride, although sodium chloride is mainly present and high in it [5-7]. The simple process like the adsorption or separation good for removal of NaCl from seawater [8]. Nanotechnology is reflected in the preparation of a thin layer of non-crystallized carbon (ACTF) [9], which has the structures and pores that leading to the non-material absorption process [10]. The original pores of carbon structures, especially ACTF, will attract attention by absorbing sodium from the water instead of the pores embedded in the polymer membrane [11-19]. Modeling of experimental adsorption isotherm data, which were obtained by the batch tests in a lab, is an essential way for predicting the mechanisms of adsorption. Moreover, the adsorption behavior of sodium ions may help understand the various (structural and chemical) factors affecting the adsorption capacity in the removal process of other cations on the oxidative-modified ACs. But one should check the applicability of adsorption models for predicting the properties of carbon adsorbents [20]. By experimental measurements on representative samples the predictive behavior of sodium ions on ACTF can be obtained, but these experimental data can not be accessed at sometimes because of experimental costs, uncertainty of measurement, inability to obtain samples, time and money. It is therefore necessary to use an experimentally derived link for assessing the adsorption behavior of QC sodium chloride on ACTF. By reviewing the literature at this stage we are found many researches describe the theoretical adsorption [21-24], but no formal experimental coloring for the mathematical adsorption behavior of sodium ions QC on ACTF [25]. In this paper, ACTF was prepared and characterized as an adsorbent for sodium ion. The obtained data were used to predict sodium ion adsorption behavior QC on ACTF by new empirical correlation, depending on easy parameters such as time and temperature. The results of the fitting of a set of the experimental adsorption equilibrium data for the sodium ions with the respective theoretical kinetics models were compared and discussed.
Experimental Procedure
Materials
Analytical-grade sulfuric acid, silica gel, cobalt nitrate, and sodium chloride standards (Baker, Serbia), Rice straw from Egyptian company, NaOH (Aldrich).
Methods
Rice straw pre-treatments: Rice straw pretreatments process was carried out through solubilization of cellulose in dilute acid for 60 min at 120°C using 1% (wt/wt) sulfuric acid; the delignification process completed at 1200°C for 60 min using 1M sodium hydroxide. During the delignification process, both of lignin and silica present in the pretreated rice straw were removed into the black liquor.
Preparation of the couplet silicate nanoparticles: The cobalt nanoparticles were coated with uniform silica layers according to the method described in references [26]. In this respect, 4.0 g of the freshly prepared cobalt silicate was vigorously stirred with 200 ml ethanol for 30 min at 45°C, and then 40 ml water and 4 ml (1.4 M) NaOH were added to the above suspension. Then the powder was separated and being too dry at 50°C for eight h in a vacuum oven to obtain cobalt silicate nanoparticles.
Chemical exfoliation of cellulose: 5 grams of cellulose was added to 5 ml concentrated sulfuric acid in the presence of 0.1 g silica and then steered for 10 min. Wash the filtrate with hot water until pH 7 and saved in the oven at 40°C for 6 hours. The prepared cellulose was poured in a flask in the presence of 0.01 g cobalt silicate nanoparticles and heated up to 40°C for 30 min. The prepared carbon nanomaterials were left to cool for 1 hour and dried in a vacuum oven for 24 hours at 50-70°C.
Characterization of adsorbent
The TEM analysis was done using a joule 2000 electron microscope at 200 kV. The SEM morphological was done by Carl Zeiss, (Germany). Studying Raman and Fourier-transform infrared (FTIR) spectra mode evaluated using a BOMEM (Hartmann & Braun) spectrometer in the transmission. KBr disk used to study the FTIR spectra of the samples. Data of X-ray diffraction (XRD) were obtained by (Bruker AXS, Germany) (Cu kα1 radiation, λ=1.54059 Å).
Adsorption process
1 mg activated carbon thin film was added to 10 ml sodium ions solution bottles and placed in a water bath for 2 hours at certain temperature at 7 pH solution to study the adsorption process [27]. The temperature was maintained by using an ultrasonic bath, then filter the aqueous solution by a 0.4 μm microfiltration membrane filter. Finally, the concentrations of sodium ions infiltrate were determined by using atomic absorption spectroscopy (AAS) [28].
Adsorption kinetic: Adsorption kinetic study of sodium ion was carried out via various initial concentrations of sodium at a constant dose of the adsorbent (1 g) and at a constant temperature (25°C ± 02) in a shaker bath. Before the start of each kinetic experiment, the sodium species stock solution containing 500 mg /L were prepared by dissolving sodium chloride powders (analytical reagent grade) in distilled water. The solution pH was maintained at a defined value by manually adding 0.1 M NaOH and/or H2SO4 solutions, capped and stirred magnetically flask for 240 min at 700 rpm to ensure approximate equilibrium. Solution was filtered through a 0.45 μm membrane at the end of the adsorption period, the filter and then analyzed for Sodium ions species.
Monovalent modeling options: Adsorption envelopes was displaying the amount adsorbed as a function of temperature. The stoichiometry of reaction is also obtained from these data by comparing the amount adsorbed of each of the components believed present in the adsorption reaction. The point being made here is that these small variations in how the reaction is actually displayed do not change the model predictions of how much Na+ adsorb on ACTF as a function of Temperature.
Results and Discussion
Amorphous carbon thin film characterization
FTIR analysis
FIG. 1 depicts the FTIR spectra of ACTF prepared from rice straw. This figure exhibit stretching bands at 3659-1100 cm-1 which indicates the presence of OH and C=O functional groups [29]. The characteristic graphene peaks observed at the range 1340-1700 cm-1 attributed to C=C and two peaks at 1118 cm-1 for C-OH stretching and OH bending vibrations, while the original C-H stretching vibrations bands appeared at 2921 cm-1 and 2852 cm-1. Two major peaks at 2919.2-2354.8 cm-1 were also detected in the spectrum that corresponds to C-H stretching. The peaks at 1580 and 1636 cm-1 were represented to the vibration stretching of carboxylic group. There are a large number of residues including hydroxyl and carboxyl groups observed, thereby, they play important roles in the formation of spherical structures [30]. The lower intensity peak at 3430 cm-1 was detected in the control spectrum that was revealed to the moisture in the sample.

FIG. 1. FTIR spectra of prepared ACTF.
Raman analysis
The ACTF Raman spectrum FIG. 2 shows G expansion band at 1592 cm-1, the Raman spectrum of E2g shifted to 1582 cm-1 [2,31]. At 1363 cm-1 the D band appears that showing a decrease in the size of sp2 domains, due to the high oxidation process, also this change is indicated a decrease in the average size of sp3 of nanoparticles that oxidized during the preparation processes. The value of IG/ID=5.7 was indicate successfully preparation of high crystalline ACTF with very low defects.

FIG. 2. Raman analysis of prepared ACTF.
SEM analysis
In the FIG. 3, the SEM image of the amorphous carbon thin film surface shows that the surface of the ACTF that prepared on the cobalt silicate catalysis has porous surface because its surface was rich in a hole and electron caves that effect on its surface area and adsorption process [32,33]. A comparison between other literature shows that the ACTF surface had no soft structure except the margins. We discovered that acidic groups on the surface of the ACTF can provide a lot of adsorption sites and thus increase the adsorption power of Na+ ions. Also, the image of ACTF having holes appears to each other, therefore; the intersection among ACTF is greatly reduced. Based on our recent SEM image, there is a force between particles between carboxylic groups and other groups on the ACTF surface in the "Earth" of the small ACTF formula that results in smaller ACTF accumulations than the ACTF carboxylic function. This result shows that ACTF can be used as a catalyst in treating contaminated water and wastewater [34].

FIG. 3. SEM analysis of prepared ACTF.
TEM analysis
FIG. 4 shows the TEM morphology of ACTF. It’s clear from the figure that after oxidation of ACTF the surface of ACTF has a rough surface and composed of two different carbon structures (graphene sheets on the surface and activated carbon inbetween). The width of ACTF sheets was assessed to be in the range of 40-100 nm [34]. This result indicating that the method of CAS activation processes reveals various carbon nanostructure with well-controlled morphologies that increasing their surface area and adsorption properties.

FIG. 4. TEM analysis of prepared ACTF.
Kinetic studies
A contact time study of sodium ions adsorption from aqueous solution on ACTF at pH 7 and different temperature (45, 65, 75°C). FIG. 5 illustrated that the adsorption process was very fast at beginning 60 minutes of Na+ adsorption on ACTF that sufficient to achieve the adsorption equilibrium. It appeared that the increase in temperatures lead to increase in the removal process and the amount of adsorbate on the carbon structure also lead to increase the number of active sites in the carbon structure so the active groups on the surface and in the bulk in the prepared ACTF.

FIG. 5. Effect of contact time variation on sodium ion adsorption (typing error in temperature into the graph).
Kinetic modeling
To study the adsorption of sodium ions on ACTF, analyzing the regression coefficients parameters values (R2) of first and pseudo-second-order rate adsorption kinetic models were utilized [35]. We found that the parameters of pseudo-second-order are the best fitted to explain the data of contact time study. The separation of the variables of the pseudo-second-order in the differential form and integration are given in Equation 1.
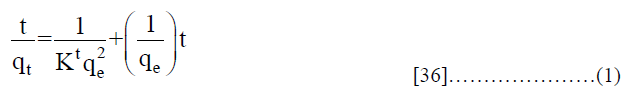
where qe and qt are the amounts of metal ion adsorbed (mg g-1) at equilibrium and at time t, respectively. K′ (g mg−1 min−1) is the pseudo-second-order rate constant of adsorption [37,38]. The qe values are showed in the good agreement with the results of testing work [TABLE 1]. The special form in the church of pseudo-second-order kinetics, that is common for that taken away of metal ions by carbonaceous materials, gives a mark of that the concentrations of both support Na+ and adsorbent ACTF are needed in the rate coming to a decision about the step of the adsorption process. Also, the slower adsorption rates on ACTF was indicate that the adsorption of sodium ions having a higher energetic barrier, it may be such as conception and surface complexion are working.
| qe(mg g-1) | K (g mg-1 min-1) × 102 | R2 | SSE (%) | |
|---|---|---|---|---|
| ACTF | 105 | 3.066 | 0.9999 | 0.00112 |
TABLE 1. Na+ absorption on ACTF and its kinetic parameters of the pseudo-second-order equation.
New proposed empirical correlation
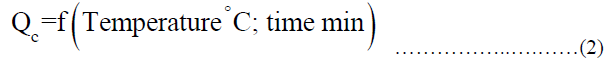
Data collection This paper presents 76 data points presented in the typical approach to link the behavior of sodium ions adsorption at QC with 100 mg/L. The data used in this study are derived from analysis samples coming from different locations in Egypt at different temperatures. From 35 to 65°C and a different time range from 5 minutes to 130 minutes. The first step in developing the relationship was the choice of parameters that are expected to affect the adsorption behavior of sodium ions at ACTF. The best results of the regression analysis were obtained using the following function [33,34], given by the equivalent. Equation 2.
The final form which represents the best regression analysis results is given by Equation 3.

This non-linear model was linearized by applying a logarithmic transformation, which formed the following final linear empirical correlation, is given by Equation 4.
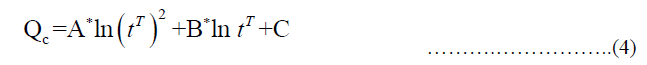
Where, X=tT, A=0.002, B=-0.425, C=28.82
Evaluation of new proposed empirical correlation
There are no empirical correlations which were developed to describe adsorption behavior of sodium ion QC on ACTF till now to comparison with the newly one. By re-evaluating the adsorption mechanism of sodium ion QC on ACTF empirical correlation with experimental work, an excellent result was obtained as compared with experimental data. The relative deviation graphic shows minimum relative errors analysis between newly developed adsorption behaviors of sodium ion QC on ACTF correlation as compared with experimental data, where it can be seen in FIG. 6 [39]. And also, TABLE 2 ensures that the newly predicted empirical correlation has good accuracy as the first correlation in this field. The proposed correlation has an average absolute relative error (Ea) of 10.25%, average relative error (Er) of 9.67%, standard deviation (S2) of 5.64% and correlation coefficient (r2) of 93.52%.

FIG. 6. Comparison of experimental and predicted QC using the proposed new model.
| Correlation | Er (%) | Ea (%) | Emax | Emin | S2 (%) | r2 (%) |
| Current Study | 10.25 | 9.67 | 20.80 | 6.38 | 5.64 | 93.52 |
TABLE 2. Statistical accuracy of the adsorption behavior of sodium ion QC on ACTF at 100 mg/L.
Testing and validating the performance of new model
In order to test the applicability and reliability of the newly developed experimental link, we must validate the use of unused data sets to develop a new experimental relationship. These groups have different times and temperatures using (72) dataset [40,41]. TABLE 3 summarizes the results of the analysis of fixed errors of newly developed models at temperatures of 35°C, 45°C and 65°C. Where statistical analysis shows low deviations in standard and high correlation rates. Also, images (7-9) show the transverse graph of data measured by new wave data and prediction, we can point to the high accuracy of this relationship that is associated with the verification samples. Since the new empirical correlation that was derived based on the data sets were represented samples in different time and temperature, so its best performance to expect the samples that have the similar range of time and temperature. As shown in FIG. 7, the adsorption ions successfully adsorbed by the prepared sample, the efficiency reached 100% for sodium ions. We can see that at different temperatures (35, 45 and 65), there is compatibility between the Qexp practical and Qcal theoretical that resulting from predicted theoretical calculations, which helped to understand the ACTF adsorption mechanism during the adsorption process of sodium ions, in accordance with kinetic modeling as previously explained. Harmonic behavior between Qcal theoretical and Qexp practical with high uptake efficiency can be attributed to the intrinsic advantages of core-shell hybrid structures with high specific surface areas, which provided the ACTF sample with more active sites for the removal process (FIG. 7-9). It also can be easily perceived that the sodium ions shown the highest rate at began and after that become constant at an equilibrium state and this trend can be revealed as follows, there only had part of the surface-active site is used during the adsorption. Namely, with the concentration of sodium ions increasing, the adsorption started from the high energy sites firstly, followed by the low energy sites saturate that caused the adsorption rate decrease finally. It holds a wider application and higher removal efficiency than the previous study.

FIG. 7. Comparison of experimental and predicted QC [Validation Model @Temp 35°C].

FIG. 8. Comparison of experimental and predicted QC (Validation model @Temp 45°C).

FIG. 9. Comparison of experimental and predicted QC [Validation Model @Temp 65°C].
Conclusion
| Correlations | Er (%) | Ea (%) | Emax | Emin | S2 (%) | r2 (%) |
|---|---|---|---|---|---|---|
| At temp 35°C | 12.42 | 18.09 | 42.41 | 9.13 | 9.20 | 89.80 |
| At temp 45°C | 9.87 | 11.87 | 30.80 | 7.37 | 6.30 | 90.00 |
| At temp 65°C | -0.64 | 7.21 | 28.44 | 0.26 | 3.19 | 91.00 |
TABLE 3. Statistical accuracy of adsorption behavior (QC) of sodium ion on ACTF carbon nanostructures at 100 mg/L. (QC) for the data used in model validation
In this study, ACTF powder was prepared as an adsorbent to remove sodium ions from an aqueous solution using CAS method in the acidic catalytic media. The kinetic, dynamic model and the compatibility calculations were studied to predict the behavior and mechanism of the carbon through the adsorption process that was near to each other. As a result of experimental work take a lot of money and time exhaustion, it is essential to use the empirically derived correlation to estimate sodium ion quantitive concentration (QC) adsorption behavior on ACTF. Development mathematical models for predicting adsorption behavior of sodium ion QC on ACTF at 100 mg/L with high accuracy r2=93.52%. The obtained validation that carried out on (72) samples show r2=89.8, 90.0 and 91.0% at temperatures 35, 45 and 65°C respectively, which indicated a high reliability of the proposed correlation.
References
- Valentini L, Cantalini C, Lozzi L, et al. Effects of oxygen annealing on cross sensitivity of carbon nanotubes thin films for gas sensing applications. Sensors and Actuators B: Chemical. 2004;100(1-2):33-40.
- Reddy N, Yang Y. Characterizing natural cellulose fibers from velvet leaf (Abutilon theophrasti) stems. Bioresource technology. 2008;99(7):2449-54.
- Hosny R, Fathy M, Ramzi TA, et al. Treatment of the oily produced water (OPW) using coagulant mixtures. Egyptian J Petroleum. 2016;25(3):391-6.
- Wang L, Xing R, Liu S, et al. Recovery of silver (I) using a thiourea-modified chitosan resin. J Haz Mat. 2010;180(1-3):577-82.
- Zhou L, Pan S, Chen X, et al. Kinetics and thermodynamics studies of pentachlorophenol adsorption on covalently functionalized Fe3O4@ SiO2-MWCNTs core-shell magnetic microspheres. Chemical Eng J. 2014;257:10-19.
- Nguyen NN, Nguyen AV. The dual effect of sodium halides on the formation of methane gas hydrate. Fuel. 2015;156:87-95.
- Hau NT, Chen SS, Nguyen NC, et al. Exploration of EDTA sodium salt as novel draw solution in forward osmosis process for dewatering of high nutrient sludge. J Mem Sci. 2014;455:305-11.
- Yang C, Li L, Shi J, et al. Advanced treatment of textile dyeing secondary effluent using magnetic anion exchange resin and its effect on organic fouling in subsequent RO membrane. J Haz Mat. 2015;284:50-7.
- Moghny ME. Breakthrough curves of oil adsorption on novel amorphous carbon thin film. Water Sci Technol; 2016;73(10):2361-9.
- Bevilacqua M, Babutskyi A, Chrysanthou A. A review of the catalytic oxidation of carbon-carbon composite aircraft brakes. Carbon. 2015;95:861-9.
- Deng D, Aouad W, Braff WA, et al. Water purification by shock electrodialysis: Deionization, filtration, separation, and disinfection. Desalination. 2015;357:77-83.
- Clarke DP, Al-Abdeli YM, Kothapalli G. Multi-objective optimization of renewable hybrid energy systems with desalination. Energy. 2015;88:457-68.
- Cohen-Tanugi D, Grossman JC. Nanoporous Graphene as a reverse osmosis membrane: recent insights from theory and simulation. Desalination. 2015;366:59-70.
- Date A, Vahaji S, Andrews J, et al. Experimental performance of a rotating two-phase reaction turbine. App Thermal Eng. 2015;76:475-83.
- Da Silva MEV, Schwarzer K, Pinheiro FN, et al. Experimental study of tray materials in a thermal desalination tower with controlled heat source. Desalination. 2015;374:38-46.
- Da X, Wen J, Lu Y, et al. An aqueous sol?gel process for the fabrication of high-flux YSZ nanofiltration membranes as applied to the nanofiltration of dye wastewater. Separation and Purification Technol. 2015;152:37-45.
- Del-Pilar-Ruso Y, Martinez-Garcia E, Giménez-Casalduero F, et al. Benthic community recovery from brine impact after the implementation of mitigation measures. Water Res. 2015;70:325-36.
- Deshmukh A, Yip NY, Lin S, et al. Desalination by forward osmosis: Identifying performance limiting parameters through module-scale modeling. Journal of Membrane Science. 2015;491:159-67.
- Dinda M, Chatterjee U, Kulshrestha V, et al. Sustainable synthesis of a high-performance inter-polymer anion exchange membrane employing concentrated solar radiation in a crucial functionalization step. J Mem Sci. 2015;493:373-81.
- Fathy M, Moghny TA, Mousa MA. Fast and Fully Scalable Synthesis of Graphene Oxide from Cellulose by Catalytic Acid Spray Method (CAS). Arabian J Sci Eng. 2019;44(1):305-13.
- Buttefey S, Boutin A, Fuchs AH. 16-O-03-Adsorption of xylene isomers and water in faujasites. A molecular simulation study, in Studies in Surface Science and Catalysis, A. Galarneau, et al., Eds. 2001, Elsevier. p. 155.
- Khan SU, Islam DT, Farooqi IH, et al. Hexavalent chromium removal in an electrocoagulation column reactor: Process optimization using CCD, adsorption kinetics and pH modulated sludge formation. Process Safety and Environmental Protection. 2019;122:118-30.
- Malengreaux CM, Pirard SL, Léonard G, et al. Study of the photocatalytic activity of Fe3+, Cr3+, La3+ and Eu3+ single-doped and co-doped TiO2 catalysts produced by aqueous sol-gel processing. J Alloys and Compounds. 2017;691:726-38.
- Shen Z, Zhang J, Hou D, et al. Synthesis of MgO-coated corncob biochar and its application in lead stabilization in a soil washing residue. Environment Int. 2019;122:357-62.
- Mansour E, Farag A, El-Dars F, et al. Predicting PVT properties of Egyptian crude oils by a modified Soave?Redlich?Kowng equation of state. Egyptian J Petroleum. 2013;22(1):137-48.
- Bertrand-Drira C, Cheng X, Cacciaguerra T, et al. Mesoporous mordenites obtained by desilication: Mechanistic considerations and evaluation in catalytic oligomerization of pentene. Microporous and Mesoporous Materials. 2015;213:142-9.
- Zhu HX, Cao XJ, He YC, et al. Removal of Cu2+ from aqueous solutions by the novel modified bagasse pulp cellulose: Kinetics, isotherm and mechanism. Carbohydrate Polymers. 2015;129:115-26.
- Zhao F, Repo E, Yin D, et al. Adsorption of Cd (II) and Pb (II) by a novel EGTA-modified chitosan material: Kinetics and isotherms. J Colloid and Interface Sci. 2013;409:174-82.
- Zuyi T, Hui Z, Baolin Z. Thermodynamic functions for ion exchange of amino acid. Reactive and Functional Polymers. 1995;27(1):29-33.
- Mehta K, Farnaud S, Patel VB. Molecular Effects of Alcohol on Iron Metabolism, in Molecular Aspects of Alcohol and Nutrition. 2016;pp:355-68.
- Singh K, Sinha T, Srivastava S. Functionalized nanocrystalline cellulose: smart biosorbent for decontamination of arsenic. Int J Mineral Processing. 2015;139:51-63.
- Fathy M, Moghny TA, Mousa MA, et al. Synthesis of transparent amorphous carbon thin films from cellulose powder in rice straw. Arabian J Sci and Eng. 2017;42(1):225-33.
- Jodeh S, Abdelwahab F, Jaradat N, et al. Adsorption of diclofenac from aqueous solution using Cyclamen persicum tubers based activated carbon (CTAC). Journal of the Association of Arab Universities for Basic and Applied Sciences. 2016;20(1):32-8.
- Fathy M, Moghny TA, Mousa MA, et al. Absorption of calcium ions on oxidized graphene sheets and study its dynamic behavior by kinetic and isothermal models. App Nanosci. 2016;6(8):1105-17.
- Sun WL, Xia J, Shan YC. Comparison kinetics studies of Cu (II) adsorption by multi-walled carbon nanotubes in homo and heterogeneous systems: effect of nano-SiO2. Chem Eng J. 2014;250:119-27.
- Sharma P, Saikia BK, Das MR. Removal of methyl green dye molecule from aqueous system using reduced graphene oxide as an efficient adsorbent: kinetics, isotherm and thermodynamic parameters. Colloids and Surfaces A: Physicochem and Eng Aspects, 2014;457:125-33.
- Solgy M, Taghizadeh M, Ghoddocynejad D. Adsorption of uranium (VI) from sulphate solutions using Amberlite IRA-402 resin: Equilibrium, kinetics and thermodynamics study. Annals of Nuclear Energy. 2015;75:132-8.
- El Aily M, Khalil M, Desouky S, et al. Experimental studies on constant mass-volume depletion of gas-condensate systems. Egyptian J Petroleum. 2013;22(1):129-36.
- Mansour E, Desouky S, Batanoni M, et al. Modification proposed for SRK equation of state. Oil and Gas J. 2012;110(6):78-91.
- El-Aily M, Desouky S, Khalil M, et al. Effect of Dry Gases Injection into Egyptian Gas/Condensate Reservoirs on Condensate Recovery.
- El-Aily M, Mansour E, Desouky S, et al. Modeling viscosity of moderate and light dead oils in the presence of complex aromatic structure. J Petroleum Sci and Eng. 2019;173:426-33.
