Research
, Volume: 18( 1)Multivariate QSAR Study of 7-Hydroxy-1, 3-Dioxo-2,3-Dihydro-1HPyrrolo[3,4-c]Pyridine-4-Carboxylate Derivatives as Potent Anti-HIV Agents
- *Correspondence:
- Ahanonu Saviour Ugochukwu
Department of Chemistry,
Ahmadu Bello University,
Zaria,
Nigeria;
E-mail: favour_saviour@yahoo.com
Received: April 09, 2019, Manuscript No. TSBC-23-2089; Editor assigned: April 12, 2019, PreQC No. TSBC-23-2089 (PQ); Reviewed: April 26, 2019, QC No. TSBC-23-2089; Revised: June 16, 2023, Manuscript No. TSBC-23-2089 (R); Published: July 14, 2023
Citation:Ugochukwu AS, Shallangwa GA, Uzairu A. Multivariate QSAR Study of 7-Hydroxy-1, 3-Dioxo-2,3-Dihydro-1H-Pyrrolo[3,4- c]Pyridine-4-Carboxylate Derivatives as Potent Anti-HIV Agents. Phys Chem Ind J. 2023;18(1):166
Abstract
In this study a QSAR was carried out on a data set of 7-Hydroxy-1,3-Dioxo-2,3-dihydro-1H-pyrrolo[3,4-c]pyridine-4- carboxylate derivatives to investigate their activities behaviour on HIV-1. Genetic Function Algorithm (GFA) and Multi Linear Regression Analysis (MLRA) were used to select the optimum descriptors and to generate the correlation QSAR model that relate their activities values against HIV with the molecular structures of the derivatives. After the internal validation, the model was found to have a squared correlation coefficient (R2 ) of 0.9334, adjusted squared correlation coefficient (R2 adj) of 0.9134 and Leaves One Out cross validated coefficient (LOO-Q 2 cv) value of 0.8604. The external validation set used for confirming the predictive power of the model has R 2 pred of 0.8935. Y randomization value of 0.6463 was used to confirm the robustness of the model. The robustness and stability of the model obtained by validation of the test set also indicate that the model can be used to design and synthesize other 7-Hydroxy-1,3-dioxo-2,3-dihydro-1H-pyrrolo[3,4-c]pyridine-4-carboxylate derivatives with improved anti-HIV activities
Keywords
QSAR; 7-Hydroxy-1, 3-dioxo-2,3-dihydro-1H-pyrrolo[3,4-c]pyridine-4-carboxylate derivatives; Y randomization; HIV; MLR
Introduction
HIV/AIDS epidemic which was reported in the United States in the spring of 1981 is today still a major concern. Human Immune Virus type 1 (HIV-1) decrease the immunity of the body and consequently results in Acquired Immune Deficiency Syndrome (AIDS). The drugs which were screened and approved for the treatment of HIV can only dramatically slow down the disease’s progress and also prevent secondary infections and complications. A person living with HIV has a severe reduction in CD4+T cells which means the person develops a very weak immune system and becomes vulnerable to contracting life threatening infections such as pneumocystis carinii pneumonia which eventually results in AIDS. Once an HIV particle enters a person’s body, it binds to the surface of a target cell (CD4+T cell) by shedding its own viral envelope, allowing the HIV particle to release an HIV Ribonucleic Acid (RNA) chain into the cell which is then converted into Deoxyribonucleic Acid (DNA). The HIV DNA enters the cell’s nucleus and is copied onto the cell’s chromosomes [1].
QSAR is a mathematical model relating the biological activity measurements of a set of chemical compounds to the variation in their chemical structure. It is used to predict the biological effects of yet untested chemical compounds. These predictions are done because of the large number of untested chemicals and because of the high cost of biological testing. QSAR has become inexorably embedded as an essential tool in the pharmaceutical industry. The fundamental assumption of QSAR is that variations in the biological activities of a series of chemicals that target a common mechanism of action are correlated with variation in their structural, physical and chemical properties. The aim of this research is to develop QSAR model using Genetic Function Algorithm (GFA) for variable selection of descriptors and Multiple Linear Regression (MLR) method for predicting the activity of 7-Hydroxy-1,3-dioxo-2,3-dihydro-1H-pyrrolo[3,4-c]pyridine-4-carboxylate derivatives as potent anti- HIV [2].
Materials and Methods
The data set of 7-Hydroxy-1,3-dioxo-2,3-dihydro-1H-pyrrolo[3,4-c]pyridine-4-carboxylate derivatives as potent anti-HIV that were used in this research was selected from the literature. The derivatives containing 20 compounds with well-defined activities selected for QSAR study. Some compounds were excluded because their activities were not well-defined [3].
The biological activity data in the form EC50 (half-maximal effective concentration) were reported in M and were converted into;
pEC50=(-logEC50)------- (1)
It represents the molar concentration in mol/L of an agonist that produces half of the maximal possible effect of the agonist. The dataset of 20 compounds were divided into a training set of 14 molecules to generate the QSAR model and a test set of 6 molecules to validate the quality of the generated model (Figure 1, Tables 1 and 2) [4].

FIG 1: Structure of 7-Hydroxy-1, 3-dioxo-2, 3-dihydro-1H-pyrrolo [3,4-c]pyridine-4-carboxylate derivatives.
| Compound number | X | R1 | R2 | logEC50 |
|---|---|---|---|---|
| 2 | CH2 | 2-FPh | OEt | 3.5976 |
| 3 | CH2 | 4-FPh | OEt | 4.0511 |
| 5 | CH2 | 3-OMePh | OEt | 3.6713 |
| 8 | CH2 | Naphthalene-1-yl | OEt | 4.3159 |
| 9 | CH(CH3) | Ph | OEt | 4.1625 |
| 11 | NH | 4-ClPh | OEt | 4.8359 |
| 12 | CH2CH2 | Ph | OEt | 4.2525 |
| 13 | CH2CH2 | 2-FPh | OEt | 4.3484 |
| 14 | CH2CH2 | 3-FPh | OEt | 4.2818 |
| 15 | CH2CH2 | 4-FPh | OEt | 5.7825 |
| 17 | CH2CH2 | 4-MePh | OEt | 5.6308 |
| 18 | CH2CH2 | 4-SO2NH2 | OEt | 3.8651 |
| 19 | CH2CH2 | 4-OMePh | OEt | 3.7854 |
| 20 | CH2CH2 | 3,4-OMePh | OEt | 5.0386 |
TABLE 1. Biological activities of training set compounds.
| Compound number | X | R1 | R2 | logEC50 |
|---|---|---|---|---|
| 1 | CH2 | Ph | OEt | 4.1981 |
| 4 | CH2 | 2-OMePh | OEt | 4.2397 |
| 6 | CH2 | 4-OMePh | OEt | 4.16 |
| 7 | CH2 | 3,4-OMePh | OEt | 3.5392 |
| 10 | NH | 4-FPh | OEt | 4.4866 |
| 16 | CH2CH2 | 4-ClPh | OEt | 4.8193 |
TABLE 2. Biological activities of test set compounds.
Molecular modelling and generation of molecular descriptors
Molecular structures of the dataset compounds were drawn using chemdraw ultra version 12.0.2 software to create the three dimensional structure. These compounds were optimised using Density Function Theory (DFT) with basis (B3LYP/631*) after energy minimization. The optimised structures were transferred to padel-descritors software to calculate various physiochemical parameters like thermodynamic, steric and electronic descriptors [5].
Descriptors transformation
In QSAR, bias has to be overcomed because model is usually biased toward descriptor with high positive and negative values. To overcome this the molecular descriptor of the training set data were processed using simple scaling using the equation below
In the equation above, Xn is the normalised descriptors, Xmax is the maximum value in a descriptor column, Xmin is the minimum value in the descriptor column and X is the original descriptor [6].
Data pretreament
The data from padel descriptor were transferred to data pretreatment software from DTC Lab for pretreatment in order to remove redundant and unwanted descriptors. All descriptors column with constant column or near constant values were deleted to remove the redundant descriptors [7-9].
Data division
After data pretreament, the pretreated data was transferred to data division software also from DTC Lab to divide it into training and test set by using Kennard and Stone’s algorithm (kennard and stone). Selection of training and test set was carried out in such a manner that compounds of the test set resembled compounds of the training set in multidimensional descriptor space and all representative compounds of training set resembled compounds of test set. Thus, a test set was a true demonstrative of a training set. This was achieved by randomly setting aside test compounds with distributed biological data.
Selection of best descriptors
Genetic Function Algorithm (GFA) incorporated in material studio software version 8.0 was used to select combination of descriptors that best correlate the structure of the compounds with their respective activities. Ga by Johnson Holland and their applications in chemistry date back to the 1970’s. The most common use of GA in in silico materials or drug design has been for feature selection to alleviate the ‘curse of dimensionality’ problem alluded to above by reducing the large pool of features to a smaller set that can be easily correlated with the molecular property or biological activity of interest. Multi Linear Regression (MLR) was used was used to generate predictive models by using small number of descriptors. GAs have been shown to generate accurate and robust QSAR [10].
Model construction
The best descriptors combination selected by GFA were obtained for both training and test set from the descriptor pool (Shola pool). Their anti HIV activities were placed at the last column in their respective spread sheets. Only the training set descriptors and their activities were imported into the material studio software version 8.0 to generate the model and to validate the internal validation parameters such as R2, R2adj, Q2cv, F-test and Y-randomization and test set to validate the built model. Three descriptors minssO, PPSA-3 and RDF135v were used to validate the model [10].
Validation of QSAR model
Internal validation: The QSAR were developed by GFA and MLR methods and evaluated using the following statistical parameters such as standard errors of regression coefficient , R2 (squared correlation coefficient, R2 adj (adjusted squared correlation coefficient, Q2 (leave one out cross validated coefficient, F-test , Y-randomization etc. The most common internal method of validating the model is least square fitting, R2 (squared correlation coefficient) for the comparison between the predicted and the experimental activities. An improved method of determining R2 is the robust straight line fit. The difference between R2 and R2adj value is less than 0.3 indicates that the number of descriptors involved in the QSAR model is acceptable. The number of descriptors is not acceptable if the difference is more than 0.3. Also for good predictability, the difference between R2 and Q2 value should not exceed 0.3. Cross validation process repeats the regression many times usually each molecule is left out once (only) in turn, and the R is computed using the predicted values of the missing molecule. It can also be more than one molecule (leave many out, LMO) is left at a time, CV is used to determine how large a model can be used for a given data set. CV is especially useful if the training set used to create the model is small (≤ 20 compounds) [11].
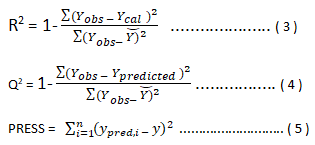
PRESS means the Predictive residual sum of the squares. y is the data values not used to construct the cross validation model.
Y-Randomization
The predictive power of the equation is poor when the observations are not sufficiently independent of each other. To test this, y-randomization of dependent variables are carried out. This process ensures that the model is not due to chance and is strong. Coefficient of determination (cRp2) for y-randomization should be greater than 0.5.
cRp2=R × [R2 (Rr)2]2 ................................ (6)
R is the coefficient of determination for y-randomization and Rr is the average R of random models. In Y-randomization procedure, the set of activity values reassigned randomly to different molecules and repeating the entire the entire modelling procedure. After several repetitions, if the model prediction is comparable to the original equation, the set of compounds observations is not sufficient to support the model. The aim of this method is to test for the validity of the original QSAR model and to ensure that the selected are appropriate.
In Y randomization, a number generator is used to allocate the integers between 1 and N to sequence of N numbers. In each cycle, the resulting arrangement of random integers is employed in order to reorder the y-data-leaving the x data intact and then the full data analysis is carried out on these scrambled data. Every run will yield estimates of R2 and Q2 which are recorded. Each case of the scrambled data gives much lower R2 and Q2 than the original data to show that the model is strong and not due to chance [12]. Y-randomization is important if there is a small number of compounds in the training set.
External validation: External validation is the best method of validating a model using a test set of compounds. These are statistical methodologies used to ensure the model is sound and unbiased (“good model”). External validation includes the following parameters.
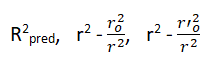
To estimate the predictive power of a QSAR model, golbraikh and tropsha recommended use of the following statistical characteristics of the test set which are as follows: Correlation coefficient R between the predicted and observed activities, coefficient of determination (R2) (predicted vs observed activities r0 2, and observed vs predicted activities r0 2, slope k and k’ of the regression lines through the origin. They considered a QSAR predictive if the following conditions are satisfied.

Result and Discussion
The aim of this research is to develop a QSAR model that could relate the structure of 7-Hydroxy-1,3-dioxo-2,3-dihydro-1Hpyrrolo[ 3,4-c]pyridine-4-carboxylate derivatives with their biological activities against HIV-1. Experimental and predicted values of 7-Hydroxy-1, 3-dioxo-2, 3-dihydro-1H-pyrrolo [3,4-c]pyridine-4-carboxylate derivatives were presented in Table 3. The lower residual values between experimental and predicted values indicate that the model has a good predicted power. GFA method employed in this study led to the selection of three descriptors which were used to build the model for calculating the predicted activities against HIV-1 (Tables 3 and 4) [13].
| Actual values for BEL: Activity | Equation 1: Predicted values | Equation 1: Residual values |
|---|---|---|
| 3.5976 | 3.931347 | -0.33375 |
| 4.0511 | 3.743864 | 0.307236 |
| 3.6713 | 3.615363 | 0.055937 |
| 4.3159 | 4.180467 | 0.135433 |
| 4.8359 | 4.693442 | 0.142458 |
| 4.2818 | 4.256597 | 0.025203 |
| 5.7825 | 5.73704 | 0.04546 |
| 5.6308 | 5.481209 | 0.149591 |
| 4.3484 | 4.356375 | -0.00798 |
| 3.8651 | 3.72197 | 0.14313 |
| 3.7854 | 3.925758 | -0.14036 |
| 4.1625 | 4.343918 | -0.18142 |
| 4.2525 | 4.450161 | -0.19766 |
| 5.0386 | 5.181888 | -0.14329 |
TABLE 3. Experimental, predicted and residual values of the selected model.
QSAR model generated and its validation parameters
pEC50=12.8744 (minsso)-0.4625 (PPSA-3)+0.6350 (RDF135v)-45.3480
Ntraining=14, Ntest=6, Friedman LOF=0.1820, R2=0.9334, R2adj= 0.9134, Q2 cv =0.8604, F-value=46.7, R2 predicted=0.8935
| Parameter | Threshold | Modal score | Comment | Reference |
|---|---|---|---|---|
| Internal | ||||
| R2 | R2>0.6 | 0.9334 | Passed | Tropsha 2010 |
| R2adj | R2adj>0.6 | 0.9134 | Passed | |
| Q2 | Q2>0.6 | 0.8604 | Passed | |
| F(4,15) | >2.09 | 46.7 | Passed | |
| Random model | ||||
 |
<0.5 | 0.3609 | Passed | Tropsha (2010) |
 |
<0.5 | 0.1437 | Passed | |
 |
<0.5 | -0.4099 | Passed | |
 |
>0.6 | 0.6463 | Passed | Roy (2007) |
| External validation | ||||
| R2predicted | R2predicted >0.6 | 0.8935 | Passed | - |
TABLE 4. Internal and external validation parameters for the QSAR generated.
Pearson correlation of the three descriptors used in the QSAR model was reported in Table 4 which shows that the correlation coefficient between each descriptor is very low (Table 5). It means that there is no significant inter-correlation among the descriptors used in building the model (Figures 2-4) [14].
| Name | Minsso | PPSA-3 | RDF135v | |
|---|---|---|---|---|
| Name | 1 | - | - | - |
| minssO | 0.31477 | 1 | - | - |
| PPSA-3 | 0.602074 | 0.343128 | 1 | - |
| RDF135v | 0.817419 | 0.146382 | 0.815004 | 1 |
TABLE 5. Pearson’s correlation coefficient.

FIG 2: Plot of predicted activity against experimental activity of training set.

FIG 3: Plot of predicted activity against experimental activity of test set.

FIG 4: Plot of residual values versus experimental activity.
Y-randomization was reported in the Table 6 below. The low values of R2 and Q2 for ten trials assured that the developed model was robust, reliable and stable while the high value of cR2p>0.5 satisfied that the built model was powerful and not due to chance [15].
| Model | R | R2 | Q2 |
|---|---|---|---|
| Original | 0.845398 | 0.714697 | 0.563412 |
| Random 1 | 0.356772 | 0.127286 | -0.85834 |
| Random 2 | 0.400789 | 0.160632 | -0.41882 |
| Random 3 | 0.292718 | 0.085684 | -0.32289 |
| Random 4 | 0.352125 | 0.123992 | -0.51328 |
| Random 5 | 0.194254 | 0.037734 | -0.58644 |
| Random 6 | 0.476354 | 0.226913 | -0.22621 |
| Random 7 | 0.414817 | 0.172073 | -0.19033 |
| Random 8 | 0.287337 | 0.082563 | -0.47896 |
| Random 9 | 0.22556 | 0.050877 | -0.44226 |
| Random 10 | 0.607866 | 0.369501 | -0.0622 |
| Random models parameters | |||
| Average r: | 0.360859 | ||
| Average r2: | 0.143726 | ||
| Average Q2: | -0.40997 | ||
| cRp2: | 0.646316 | ||
TABLE 6. Y-randomization table.
Conclusion
In this study, SW-MLR was used to develop linear QSAR model for the prediction of anti-HIV effective activity of 7-Hydroxy- 1,3-dioxo-2,3-dihydro-1H-pyrrolo [3,4-c] pyridine-4-carboxylate derivatives. The built model displayed good correlation between the structure and activity of the studied compounds. The model was validated using the following parameters R2, R2adj, Q2cv, y-randomization for internal validation and R2predicted for external validation. The built model has a good internal and external predictive power. The descriptors minssO, PPSA-3 and RDF135v in the built model were used to determine the activity of the compounds to functioning effective anti-HIV inhibitors. The knowledge gained in this piece of work can be used to design more potent 7-Hydroxy-1,3-dioxo-2,3-dihydro-1H-pyrrolo [3,4-c] pyridine-4-carboxylate derivatives as anti HIV agents.
References
- Tropsha A, Gramatica P, Gombar VK, et al. The importance of being earnest: Validation is the absolute essential for successful application and interpretation of QSPR models. J Chem Inf Comput Sci. 2003;22:69-77.
- Leonard JT, Roy K. On selection of training and test sets for the development of predictive QSAR models. QSAR Comb Sci. 2006;25:235-251.
- Hong X, Hopfinger AJ. 3D-pharmacophores of flavonoid binding at the benzodiazepine GABAA receptor site using 4D-QSAR analysis. J Chem Inf Comput Sci. 2003;43(1):324-336.
[Crossref] [Google Scholar] [PubMed]
- Kovatcheva A, Golbraikh A, Oloff S, et al. Combinational QSAR of Ambergris fragrance compounds. J Chem Inf Compt Sci. 2004;44(4):582-595.
[Crossref] [Google Scholar] [PubMed]
- Gramatica P, Papa E. QSAR modeling of bioconcentration factor by theoretical molecular descriptors. QSAR Combi Sci. 2003;22(3):374-385.
- Katritzky AR, Fara DC, Karelson M, et al. Qspr of 3-aryloxazolidin-2-one antibacterials. Bioorg Med Chem. 2004:12(5):3027-3035.
[Crossref] [Google Scholar] [PubMed]
- Rucker C, Scarsi M, Meringer M, et al. 2D QSAR of PPARgamma agonist binding and transactivation. Bioorg Med Chem. 2006;14(15):5178-5195.
[Crossref] [Google Scholar] [PubMed]
- Supratik Kar, Roy K. Development and validation of a robust QSAR model for prediction of carcinogenicity of drugs. Ind J Biochem Biophys. 2012;48(8):122.
[Google Scholar] [PubMed]
- Jaworska J, Nikolova-Jeliazkova N, Aldenberg T, et al. QSAR applicabilty domain estimation by projection of the training set descriptor space: A review. Altern Lab Anim. 2015;33(6):445-459.
[Crossref] [Google Scholar] [PubMed]
- Mahindra T, Vithal M. QSAR of HIV-1 integrase inhibitors by genetic function approximation method. Bio Med Chem. 2002;10(11):1483-1497.
[Crossref] [Google Scholar] [PubMed]
- Gupta P, Garg P, Roy N, et al. Identification of novel HIV-1 integrase inhibitors using shape-based screening, QSAR, and docking approach. Chem Biol Drug Des. 2012;79(11):835-849.
[Crossref] [Google Scholar] [PubMed]
- Hazuda DJ. HIV integrase as a target for antiretroviral therapy. Curr Opin HIV Aids. 2012;7(10):383-389.
[Crossref] [Google Scholar] [PubMed]
- Joy DA, Feng X, Mu J, et al. Early origin and recent expansion of Plasmodium falciparum. Science 2003;300(5617):318-321.
- Dorn A, Vippagunta SR, Matile H, et al. An assessment of drug-haematin binding as a mechanism for inhibition of haematin polymerisation by quinoline antimalarials. Biochem Pharmacol. 1998;55(6):727-736.
[Crossref] [Google Scholar] [PubMed]
- Banerjee R, Liu J, Beatty W, et al. Four plasmepsins are active in the Plasmodium falciparum food vacuole, including a protease with an active-site histidine. Proc Natl Acad Sci. 2002;99(2):990-995.
[Crossref] [Google Scholar] [PubMed]