Original Article
, Volume: 16( 1)FTIR, FT-Raman, SERS and Computational Studies of the Vibrational Spectra, Molecular Geometries and other Properties of 4-Fluoroaniline
- *Correspondence:
- Viswanathan K, Department of Physics, Kalasalingam University, Anand Nagar, Krishnankoil 626 126, Tamil Nadu, India, Tel: +91-9443367493; E-mail: viswanathan.k@klu.ac.in
Received: December 12, 2017; Accepted: January 17, 2018; Published: January 20, 2018
Citation: Viswanathan K, Jeyavijayan S, Praseeda K, et al. FTIR, FT-Raman, SERS and Computational Studies of the Vibrational Spectra, Molecular Geometries and other Properties of 4- Fluoroaniline. Int J Chem Sci. 2018;16(1):241
Abstract
The FTIR (4000 cm-1-450 cm-1), FT-Raman and SERS (4000 cm-1-50 cm-1) spectra of 4-fluoroaniline (4FA) have been recorded. The DFT/B3LYP method is used to compute the vibrational frequencies. Tentative assignments of the observed and computed wavenumbers are provided. The observed and scaled wavenumber values show very good agreement. Optimized geometrical parameters and frontier molecular orbitals are carried out by DFT/B3LYP method combined with 6-31+G (d, p) and 6-311++G (d, p) basis sets. Further, the molecular electrostatic potential (MEP) and the first order hyperpolarizability are investigated using theoretical calculations. In addition, the Mulliken’s charges analysis and several thermodynamic properties were calculated.
Keywords
FTIR; FT-Raman; SERS; 4-fluoroaniline; DFT calculations
Introduction
In the synthesis of a large amount of dyes, pharmaceuticals, chemicals and electro-optical industrial processes, aniline and its derivatives are used widely used as starting materials [1]. Polyaniline, the conducting polymer of aniline, is used as diodes and transistors in microelectronic devices. Derivatives of aniline are used particularly in the production of pesticides, antioxidants and dyes [2,3]. Wojciechowski et al. have investigated para-halogen anilines and the theoretical infrared and Raman spectra and vibrational assignments are done [4]. Kavitha et al. [5] have studied the vibrational spectra, molecular structure and HOMO, LUMO studies of 4-nitroaniline. Arjunan et al. [6] have reported the studies of vibrational spectra and non-linear optical properties of 2-(trifluoromethyl) aniline and 3-(trifluoromethyl) aniline. Moreover, Femina Jasmine et al. [7] have reported the molecular structure and charge transfer contributions to nonlinear optical property of 2-methyl-4-nitroaniline. More recently, Revathi et al. [8] deliberated the NLO properties of 4-chloro-3-(trifluoromethyl) aniline, 4-bromo-3-(trifluoromethyl) aniline and 4-fluoro-3-(trifluoromethyl) aniline. However, no density functional theory (DFT) with 6-31+G (d, p) and 6-311++G (d, p) basis set calculations of 4-fluoro aniline (4FA) have been reported so far, to the best of our knowledge. Therefore, in the present work an attempt has been made to study the detailed theoretical and experimental investigation of the vibrational spectra of 4FA.
Experimental
The fine polycrystalline sample of 4FA was obtained from Lancaster Chemical Company, UK and used as such for spectral measurements. A Perkin Elmer Spectrum-1 FTIR Spectrometer, with a resolution of 1 cm-1, was used to record the FTIR spectrum of the compound at room temperature, in the range 450 cm-1 to 4000 cm-1. The sample was taken in a cuvette.
The sample solution was prepared in three different concentrations using de-ionized water, with sample to water ratios 1:5 (S1), 1:10 (S2) and 1:20 (S3). The Raman spectra were recorded for three samples S1, S2 and S3, using BRUKER RFS 27, a multi-RAM stand-alone model, Raman spectrophotometer, in the spectral range is 4000 cm-1-50 cm-1, using the 1064 nm line of Nd:YAG laser, operating at 200 mW power. The reported wavenumbers are believed to be accurate within ? 1 cm-1. The SERS spectra were recorded using the same Raman spectrophotometer, by mixing the samples with silver sol prepared by Crieghton method [9], at two sample-sol ratios (1:5 and 1:10).
Computational details
The observed bands of the molecule are to be essentially assigned to the different vibrations, for solving various chemical and structural problems. To understand the Raman and IR bands well, these have to be essentially assigned to different vibrations of the molecule. The industrial importance of substituted anilines prompted the authors to undertake an extensive spectroscopic study of 4FA. The FTIR, FT-Raman and SERS spectra at different concentrations are recorded for the compound and an effort has been made to give possible explanation for the vibrational fundamentals and to understand the effect of halogen group substitution on the characteristic frequencies of the amino group. The software package GAUSSIAN 09W [10] at the DFT/B3LYP level, combined with 6-31+G (d, p) and 6-311++G (d, p) basis sets, has been used to estimate the optimized structural parameters, optimized minimum energy, vibrational frequencies, IR intensity and Raman activity, for the compound. In order to improve the agreement of theoretically calculated frequencies with experimentally calculated frequencies, it is essential to scale down the theoretically calculated harmonic frequencies. Hence, MOLVIB 7.0 version written by Tom Sundius [11,12], was used to scale down the theoretically calculated vibrational frequencies.
Results and Discussion
Molecular geometry
Figure 1 shows the molecular structure (optimized) of 4FA having C1 point group symmetry. The global minimum energy obtained by the DFT structure optimization with 6-31+G (d, p) and 6-31+G (d, p) basis sets for 4FA is calculated as -386.86972381 Hartrees and -386.95473148 Hartrees. Table 1 shows the optimized geometrical parameters for 4FA obtained by B3LYP method with 6-31+G (d, p) and 6-311++G (d, p) basis set calculations. It can be seen that the bond lengths estimated in both the sets are almost equal.
| Bond length | Value (Å) | Expta | Bond angle | Value (°) | Expta | ||
|---|---|---|---|---|---|---|---|
| B3LYP/ 6-31+G (d, p) |
B3LYP/ 6-311++G (d, p) |
B3LYP/ 6-31+G (d, p) |
B3LYP/ 6-311++G (d, p) |
||||
| C1–C2 | 1.4058 | 1.4023 | 1.381 | C1–C2–C3 | 120.9082 | 120.911 | 119.1 |
| C2–C3 | 1.3958 | 1.3921 | 1.390 | C2–C3–C4 | 118.9604 | 119.056 | 118.5 |
| C3–C4 | 1.3884 | 1.3849 | 1.372 | C3–C4–C5 | 121.7261 | 121.5828 | 123.2 |
| C4–C5 | 1.3884 | 1.3849 | 1.373 | C4–C5–C6 | 118.9593 | 119.0561 | 118.2 |
| C5–C6 | 1.3958 | 1.3921 | 1.390 | C5–C6–C1 | 120.9091 | 120.911 | 119.2 |
| C6–C1 | 1.4058 | 1.4023 | 1.381 | C6–C1–C2 | 118.5368 | 118.4829 | 121.8 |
| C1–N7 | 1.4017 | 1.4008 | 1.464 | C6–C1–N7 | 120.695 | 120.7233 | 119.0 |
| N7–H8 | 1.011 | 1.0095 | 0.93 | C2–C1–N7 | 120.6993 | 120.7232 | 119.3 |
| N7–H9 | 1.011 | 1.0095 | 0.93 | H8–N7–H9 | 111.8115 | 111.7073 | 110.0 |
| C2–H10 | 1.0869 | 1.085 | 0.95 | C1–C2–H10 | 119.6819 | 119.6746 | 120.0 |
| C3–H11 | 1.0848 | 1.083 | 0.95 | C3–C2–H10 | 119.409 | 119.4136 | 121.0 |
| C4–F12 | 1.3655 | 1.3614 | 1.363 | C2–C3–H11 | 121.1387 | 121.112 | 123.0 |
| C5–H13 | 1.0848 | 1.083 | 0.97 | C4–C3–H11 | 119.9009 | 119.832 | 118.0 |
| C6–H14 | 1.0869 | 1.085 | 0.96 | C3–C4–F12 | 119.136 | 119.2086 | 118.2 |
| - | - | - | - | C5–C4–F12 | 119.1378 | 119.2086 | 118.6 |
| - | - | - | - | C4–C5–H13 | 119.9018 | 119.8319 | 121.0 |
| - | - | - | - | C6–C5–H13 | 121.1389 | 121.112 | 121.0 |
| - | - | - | - | C5–C6–H14 | 119.4127 | 119.4135 | 119.0 |
| - | - | - | - | C1–C6–H14 | 119.6771 | 119.6747 | 121.0 |
| - | - | - | - | C1–N7–H9 | 115.4728 | 115.3365 | 113.0 |
| - | - | - | - | C1–N7–H8 | 115.4825 | 115.3364 | 113.0 |
aExperimental values are taken from Ref. [13]
Table 1: Optimized geometrical parameters for 4-fluoroaniline computed at B3LYP/6-31+G (d, p) and 6-311++G (d, p) basis sets.

Figure 1: Molecular structure of 4-fluoroaniline.
The geometrical parameters, estimated theoretically, give a good approximation and these are used as bases for calculating the vibrational frequencies, thermodynamics properties etc. It can be seen that the benzene ring is slightly distorted and angles are out of perfect hexagonal structure, slightly. The substitutions of the NH2 group and fluorine atom in the place of H atoms, is responsible for this. As per the experimentally obtained values [13], order of the optimized length of the six C–C bonds of the ring are as C3–C4<C4–C5<C1–C2=C6–C1<C2–C3=C5–C6. According to the calculated values (B3LYP/6-311++G (d, p)), the order of the bond lengths is slightly differed as C3–C4=C4–C5<C2–C3=C5–C6<C1–C2=C6–C1, since the substitutions are different.
As seen from the Table 1, the bond length of C-N is found to be 1.4017 Å by B3LYP/6-31+G (d, p) method and is higher than other bond lengths, since nitrogen is electronegative in nature. For the title compound, the C-C bond lengths are in between 1.3884 and 1.4058 Å by DFT/B3LYP/6-31+G (d, p) method. In particular, the bond lengths of C1-C2 and C6-C1 are increased slightly with other bond lengths in the skeleton. The bond lengths of C-H appear in the characteristics region. The C–F bond length indicates a considerable increase when substituted in place of C–H. Fluorine atom is in the plane of the benzene ring. The C–F bond length is found to be 1.363Å by expt. [13], 0.0016Å larger than the calculated value (1.3614Å) by B3LYP/6-311++G (d, p). Asymmetry of the benzene ring is also evident from the positive deviation of C3-C4-C5 and negative deviation of C6-C1-C2 bond-angles from the normal value of 120°, since the substitution of fluorine atom and NH2 group at C4 and C1 atoms, respectively. Other C–C–C angles are calculated bigger and smaller than the hexagonal angle due to the effect of substitutions in the benzene ring.
Vibrational spectra
There are 14 atoms and its 36 normal modes of vibration, for the title compound, which are active both in IR and Raman spectra. Table 2 gives the detailed assignment of the vibrational bands of 4FA calculated by the DFT, with 6-31+G (d, p) and 6-311++G (d, p) basis sets, along with the theoretically estimated Raman and IR intensities and normal mode descriptions (characterized by TED). The FTIR spectrum of the sample is given in Figure 2. The Figure 3 shows the UV absorption spectrum of the silver sol. The peak observed at 390 nm shows the presence of silver nano particles in the colloid. The experimental FT-Raman spectra of the three solutions S1, S2 and S3 are shown in Figure 4.
| Sl. No. |
Species C1 |
Observed fundamentals (cm-1) | Calculated frequencies νi (cm-1) | TED(%) among types of internal coordinates | ||||||||
|---|---|---|---|---|---|---|---|---|---|---|---|---|
| B3LYP/6-31+G(d,p) | B3LYP/6-311++G(d,p) | |||||||||||
| FTIR | Raman | Unscaled νi | Scaled | IR intensitya |
Raman activityb |
Unscaled νi | Scaled | IR intensitya |
Raman activityb |
|||
| 1 | A | 3659(ms) | 3506(w) | 3679 | 3535 | 17.01 | 53.22 | 3679 | 3535 | 16.22 | 57.16 | NH2 ass (99) |
| 2 | A | 3438(vs) | 3424(w) | 3574 | 3434 | 16.99 | 173.52 | 3573 | 3433 | 15.75 | 189.61 | NH2ss (98) |
| 3 | A | 3360(ms) | 3360(ms) | 3217 | 3091 | 2.09 | 229.26 | 3216 | 3090 | 2.07 | 229.93 | ν CH (96) |
| 4 | A | 3222(s) | 3236(ms) | 3216 | 3090 | 4.20 | 51.59 | 3215 | 3089 | 4.25 | 51.68 | ν CH (94) |
| 5 | A | 3050(ms) | 3099(w) | 3181 | 3056 | 17.20 | 78.90 | 3181 | 3056 | 17.22 | 77.93 | ν CH (92) |
| 6 | A | 3022(w) | 3028(vw) | 3181 | 3056 | 11.24 | 81.69 | 3180 | 3055 | 11.32 | 82.27 | ν CH (90) |
| 7 | A | 1735(vw) | - | 1673 | 1607 | 68.67 | 27.33 | 1672 | 1606 | 67.82 | 28.96 | ν CC (88) |
| 8 | A | 1624(vs) | - | 1657 | 1592 | 19.69 | 4.58 | 1656 | 1591 | 20.07 | 4.14 | NH2sciss (85) |
| 9 | A | - | 1630(w) | 1645 | 1580 | 0.15 | 2.99 | 1645 | 1580 | 0.16 | 2.88 | ν CC (84) |
| 10 | A | 1509(vs) | 1530(vw) | 1548 | 1487 | 237.76 | 0.46 | 1548 | 1487 | 237.66 | 0.53 | ν CC (86) |
| 11 | A | 1434(ms) | 1458(w) | 1471 | 1413 | 0.27 | 0.36 | 1470 | 1412 | 0.27 | 0.38 | ν CC (82) |
| 12 | A | - | 1317(w) | 1361 | 1308 | 7.67 | 1.41 | 1361 | 1307 | 7.61 | 1.46 | ν CC (80) |
| 13 | A | 1320(s) | - | 1324 | 1272 | 0.01 | 2.17 | 1325 | 1273 | 0.01 | 2.21 | ν CC (81) |
| 14 | A | 1272(s) | - | 1302 | 1251 | 27.50 | 23.54 | 1302 | 1251 | 28.16 | 23.13 | ν CN (78) |
| 15 | A | 1220(vs) | - | 1239 | 1190 | 151.96 | 7.58 | 1239 | 1190 | 151.81 | 8.13 | ν CF (76) |
| 16 | A | 1154(s) | - | 1178 | 1132 | 3.49 | 8.12 | 1178 | 1132 | 3.48 | 8.13 | b CH (75) |
| 17 | A | 1116(s) | - | 1141 | 1096 | 11.15 | 0.02 | 1141 | 1096 | 11.29 | 0.03 | b CH (74) |
| 18 | A | 1076(ms) | - | 1079 | 1037 | 3.22 | 1.85 | 1079 | 1036 | 3.12 | 1.97 | NH2 rock (73) |
| 19 | A | 1010(w) | - | 1025 | 985 | 2.27 | 0.02 | 1025 | 985 | 2.20 | 0.03 | b CH (72) |
| 20 | A | - | 949(ms) | 946 | 909 | 0.01 | 0.01 | 945 | 908 | 0.01 | 0.01 | b CH (71) |
| 21 | A | 920(w) | 930(w) | 930 | 893 | 1.25 | 0.05 | 927 | 891 | 1.67 | 0.31 | ω CH (64) |
| 22 | A | - | 856(ms) | 860 | 826 | 6.58 | 46.25 | 860 | 826 | 6.38 | 46.55 | ω CH (65) |
| 23 | A | 827(vs) | - | 835 | 802 | 81.74 | 0.82 | 834 | 801 | 81.45 | 0.97 | ω CH (63) |
| 24 | A | - | 802(w) | 807 | 775 | 0.03 | 0.54 | 807 | 775 | 0.03 | 0.25 | ω CH (64) |
| 25 | A | 733(vw) | - | 758 | 728 | 25.37 | 0.08 | 758 | 728 | 25.42 | 0.09 | R asymd (70) |
| 26 | A | 689(w) | - | 698 | 671 | 2.22 | 1.64 | 694 | 666 | 2.23 | 2.23 | R trigd (69) |
| 27 | A | - | 650(w) | 652 | 626 | 0.04 | 6.33 | 652 | 626 | 0.04 | 6.23 | b CF (71) |
| 28 | A | - | 555(vw) | 580 | 557 | 279.88 | 3.01 | 580 | 557 | 280.40 | 2.55 | NH2 wag (64) |
| 29 | A | 507(s) | - | 508 | 488 | 70.47 | 0.58 | 508 | 488 | 70.01 | 0.67 | R symd (68) |
| 30 | A | 460(vw) | - | 462 | 444 | 2.29 | 8.12 | 462 | 443 | 2.30 | 8.10 | t R trigd (65) |
| 31 | A | - | 420(vw) | 436 | 419 | 1.72 | 0.32 | 436 | 419 | 1.72 | 0.31 | t R symd (64) |
| 32 | A | - | 397(s) | 426 | 409 | 0.35 | 0.01 | 426 | 409 | 0.35 | 0.03 | t R asymd (65) |
| 33 | A | - | 330(vw) | 358 | 344 | 7.89 | 3.36 | 357 | 343 | 7.71 | 2.81 | b CF (67) |
| 34 | A | - | 309(ms) | 330 | 317 | 0.14 | 0.43 | 330 | 317 | 0.13 | 0.43 | w CN (64) |
| 35 | A | - | 250(w) | 254 | 244 | 19.81 | 0.21 | 251 | 241 | 19.81 | 0.24 | w CF (63) |
| 36 | A | - | 150(ms) | 152 | 146 | 1.25 | 0.43 | 151 | 145 | 1.23 | 0.45 | NH2 twist (62) |
Abbreviations used:ν-Stretching; ss: Symmetric Stretching; ass: Asymmetric Stretching; b: Bending; ω: Out-of-Plane Bending; R: Ring; t: Torsion; s: Strong; vs: Very Strong;
ms: Medium Strong; w: Weak; vw: Very Weak
aRelativeAbsorption Intensities in km mol-1 and Normalized with the Highest Peak Absorbance
b Relative Raman Intensities in Å4amu-1 and normalized to 100
Table 2: Vibrational assignments of fundamental modes of 4-fluoroaniline along with calculated IR intensity (km/mol), Raman activity (Å amu-1) and normal mode descriptions (characterized by TED) based on quantum mechanical calculations using DFT method.

Figure 2: FTIR spectrum of 4-fluoroaniline.

Figure 3: UV absorption spectrum of the silver sol.

Figure 4: Raman spectra of the sample solutions (S1, S2, S3).
Vibrational band assignments
The vibrational analysis involves the assignment of the bands observed at specific wave numbers in the IR and Raman spectra to the different vibrational modes giving rise to each of these observed bands.
C–H Vibrations
The C-H stretching vibrations of aromatic and hetero-aromatic structure are normally appearing in the region 3000-3100 cm-1 [14]. In this region, the bands are not affected appreciably by the nature of the substituent. Hence, in the present investigation, the C–H stretching vibrations of 4FA are observed at 3360 cm-1, 3222 cm-1, 3050 cm-1, 3022 cm-1 in IR and 3360 cm-1, 3236 cm-1, 3099 cm-1, 3028 cm-1 in Raman spectrum. Generally, the bands due to C-H in-plane bending vibrations interact with ring vibrations, are observed as a number of sharp bands in the region 1300 cm-1-1000 cm-1. The FTIR bands observed at 1154 cm-1, 1116 cm-1, 1010 cm-1 and Raman band found at 949 cm-1 are assigned to C–H in-plane bending vibrations of 4FA and these modes are confirmed by their TED values. The C–H out-of-plane bending vibrations of 4FA have also been identified and listed in Table 2.
C–C Vibrations
The bands between 1400 cm-1 and 1650 cm-1 in benzene derivatives are due to C–C stretching vibrations [15]. Therefore, the stretching vibrations of 4FA are observed at 1735 cm-1, 1509 cm-1, 1434 cm-1, 1320 cm-1 in IR and 1630 cm-1, 1530 cm-1, 1458 cm-1, 1317 cm-1 in Raman spectrum. The substitutions in the aromatic ring have affected most of the ring vibrational modes of the title compound. The bands observed in the FTIR spectra at 733 cm-1, 689 cm-1 and 507 cm-1 have been assigned to ring in-plane bending modes. These modes are confirmed by their TED values. The ring out-of-plane bending modes of 4FA are also listed in the Table 2. Due to the change in force constant and the vibrations of the functional groups, the ring out-of-plane bending frequencies are reduced.
C–F Vibrations
In the vibrational spectra of related compounds, the bands due to C–F stretching vibrations [16] may be found over a wide frequency range 1360 cm-1-1000 cm-1, since the vibration is easily affected by adjacent atoms or groups. In the present investigation, the FTIR band observed at 1220 cm-1 has been assigned to C–F stretching mode of vibration for 4FA. The Raman bands found at 650 cm-1 and 250 cm−1 have been designated to C–F in-plane bending and out-of-plane bending modes, respectively.
C–N Vibrations
In aromatic compounds, the C–N stretching vibration usually lies in the region 1400 cm-1-1200 cm−1. The identification of C–N stretching frequencies is not an easy task, due to the possible mixing of vibrations in this region [17]. In this study, the band observed at 1272 cm−1 in IR spectrum has been assigned to C–N stretching vibration of 4FA. The in-plane and out-of-plane bending C–N vibrations have also been identified and presented in Table 2 for the title compound. These assignments are also supported by the TED values.
NH2 Group vibrations
The frequencies of amino group appear around 3500 cm-1-3300 cm-1 for NH2 stretching, 1700 cm-1-1600 cm-1 for scissoring and 1150 cm-1-900 cm-1 for rocking deformation [18]. In the present study, the asymmetric stretching modes of NH2 group in 4FA are assigned at 3659 cm-1 in IR and 3506 cm-1 in Raman spectra. The symmetric stretching modes of NH2 group are found at 3438 cm-1 and 3424 cm-1 in IR and Raman spectra, respectively. The band appeared at 1624 cm-1 in IR has been assigned to scissoring modes of NH2 group for 4FA. The Rocking, wagging and twisting vibrational modes of NH2 for the title compound are also presented in Table 2. The values computed theoretically, by B3LYP method, for NH2 vibrational modes are in very good agreement with experimental data.
SERS spectra
Comparisons of the SERS spectra of the sample at different concentrations, with normal Raman spectra are shown in Figure 5-9. It can be seen that main enhancement of lines is observed only in the region below 1000 cm-1. There is moderate enhancement in the region between 1000 cm-1 and 2000 cm-1. The enhancement is not very clear after 3000 cm-1. Significant differences in relative intensities from SERS spectra are expected from the normal Raman spectrum, due to the specific surface selection rules [19].

Figure 5: SERS spectra of the sample at three different concentrations (S1, S2, S3) with sample: sol ratio 1:5.

Figure 6: SERS spectra of the sample at three different concentrations (S1, S2, S3) with sample:sol ratio 1:10.

Figure 7: Comparison of Raman spectrum and SERS for sample S1.

Figure 8: Comparison of Raman spectrum and SERS for sample S2.

Figure 9: Comparison of Raman spectrum and SERS for sample S3.
The surface selection rule suggests that for a molecule adsorbed flat on the silver surface, compared to the in-plane vibrational modes, the out of plane vibrational modes will be more enhanced and when it is adsorbed perpendicular to the surface the in-plane vibrational modes will be more enhanced than out of plane vibrational modes [19,20]. It is further seemed that vibrations involving atoms that are close to the silver surface will be enhanced. In the normal Raman spectra of the three solutions a variation in intensity is observed. As expected, the intensity of Raman lines for the sample with higher concentration (blue line) is maximum, in the region upto 1600 cm-1. But in 2000 to 3500 regions, the lowest concentration sample shows very high intensity, which can be due to excess of water.
In the region up to 600 cm-1, there is considerable enhancement for almost all lines. But there is no considerable dependence of the enhancement on the concentration of the solution, as well as sample-sol ratio. However, there is a slight increase in the enhancement for the sample-sol ratio 1:5 and for the solution concentration 1:10. Even though there is considerable difference in the intensities of the lines in the region 2000 cm-1 to 3500 cm-1, this cannot be fully attributed to the enhancement due to the metal surface, since the difference in water content also may contribute to this. It could be a combined effect of both.
First hyperpolarizability
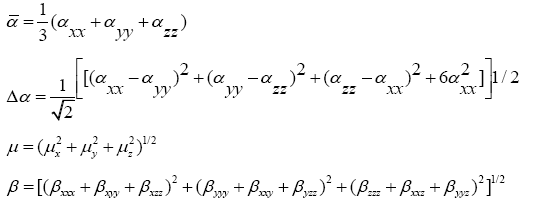
The quantum chemistry based prediction of non-linear optical (NLO) properties of a molecule has an essential role in the design of materials in modern communication technology, signal processing and optical interconnections [21,22]. Such studies of organic molecules are more important because of their larger NLO susceptibilities arising from π-electron cloud movement from donor to acceptor, high laser damage thresholds, fast NLO response times and low dielectric constants. Table 3 shows the components of dipole moment, polarizability and the first hyperpolarizability of 4FA. The following equations [22] are used to calculate the average linear polarizability? , the total static dipole moment μ, the first hyperpolarizability β and the anisotropy of the polarizability Δα:
| Components | Values | Components | Values |
|---|---|---|---|
| µx | -3.0011 | βxxx | 121.3888747 |
| µy | -0.0005 | βxxy | 0.0001906 |
| µz | 1.0085 | βxyy | -10.0299357 |
| - | - | βyyy | 0.0038738 |
| αxx | 101.7321162 | βxxz | 7.0992237 |
| αxy | 0.0000979 | βxyz | 0.0225299 |
| αyy | 84.6695337 | βyyz | 7.2113197 |
| αxz | 0.1856079 | βxzz | -25.6726973 |
| αyz | -0.0005829 | βyzz | -0.0065616 |
| αzz | 46.2713182 | βzzz | 20.2200354 |
Table 3: Calculated dipole moment μ (Debye), polarizability (α) and the first hyperpolarizability (β) components (a.u.) for 4-fluoroaniline.
The values calculated using the DFT-B3LYP/6-31+G (d, p) method are as follows:
Total static dipole moment μ=3.166 Debye
The average linear polarizability  =11.482 Å3
The anisotropy of the polarizability Δα=27.083 Å3
The first hyperpolarizability β=0.798×10⁻³⁰ e.s.u.-1
The values of obtained by Sun et al. [23] with the B3LYP method for urea are:
μ=1.373 Debye,
=3.831 Å3
And β=0.3729×10⁻³⁰ e.s.u.-1.
The first hyperpolarizability of 4FA molecule is 2 times greater than that of urea. According to these results, the title compound may be a potential candidate for the development of NLO materials.
HOMO, LUMO analysis
The frontier molecular orbitals (FMOs), i.e., highest occupied molecular orbitals (HOMOs) and the lowest unoccupied molecular orbitals (LUMOs), play an important role in the electric and optical properties, UV-Vis absorption as well as chemical reactions [24]. The energies of the highest and the second highest occupied MO’s (HOMO and HOMO-1), the lowest and the second lowest unoccupied MO’s (LUMO and LUMO+1) were calculated using B3LYP/6- 311++G (d, p). These are illustrated in Figure 10. This indicates that4FA has 29 occupied MOs. The HOMO-LUMO energy gap for 4FA is found to be 5.1391 eV.

Figure 10: The atomic orbital HOMO and LUMO compositions of the frontier molecular orbital for 4-fluoroaniline.
The LUMO: of π nature, (i.e. benzene ring) is delocalized over the whole C-C bond. By contrast, the HOMO is located over NH2 group and fluorine atom; consequently the HOMO → LUMO transition implies an electron density transfer to C-C bond of the benzene ring from NH2 group and fluorine atom. Moreover, these orbitals are found to overlap significantly in their position of the benzene ring for 4FA. The HOMO represents the ability to donate an electron and LUMO represents the ability to obtain an electron (electron acceptor). A decrease in HOMO-LUMO energy gap facilitates intra molecular charge transfer. This makes the material NLO active.
Mulliken population analysis
The calculation of Mulliken atomic charge [25] is important in the application of quantum chemical analysis to molecular systems due to the change in dipole moment, polarizability, electronic structure and much more properties of molecular systems. The total atomic charges of 4FA obtained by B3LYP method with 6-31+G (d, p) and 6-311++G (d, p) basis sets are listed in Table 4. The charge distribution on the molecule has an important influence on the vibrational spectra.
| Atoms | Atomic charges (Mulliken) | |
|---|---|---|
| B3LYP/6-31+G (d, p) | B3LYP/6-311++G (d, p) | |
| C1 | -0.086279 | -0.590967 |
| C2 | 0.013463 | 0.157407 |
| C3 | 0.006318 | 0.066420 |
| C4 | -0.050909 | -0.538783 |
| C5 | 0.006254 | 0.066423 |
| C6 | 0.013598 | 0.157446 |
| N7 | -0.595652 | -0.301430 |
| H8 | 0.286238 | 0.231949 |
| H9 | 0.286231 | 0.231949 |
| H10 | 0.114040 | 0.164176 |
| H11 | 0.139411 | 0.190105 |
| F12 | -0.361007 | -0.188972 |
| H13 | 0.139411 | 0.190105 |
| H14 | 0.114027 | 0.164173 |
Table 4: The charge distribution calculated by the Mulliken method.
The graphical representation of the results has been done in Figure 11 and it gives us information about the charge shifts relative to 4FA. More charge density was found at C1, C4, N7 and F12 than that of other ring carbon atoms. The high positive charge at C2, C3, C5 and C6 is due to the effect of electron releasing NH2 group and fluorine atom attached in the ring. The electron donating character of the NH2 group in the title compound is demonstrated by a decrease in electron density on C1 atom. From the result it is clear that the substitution of NH2 and fluorine atom in the aromatic ring leads to a redistribution of electron density.

Figure 11: Mulliken’s plot for 4-fluoroaniline.
Electrostatic potential and molecular electrostatic potential total electron density
The electrostatic potential is used primarily for predicting sites and relative reactivities towards electrophilic attack and in studies of biological recognition and hydrogen bonding interactions [26,27]. The MEP at the B3LYP/6-31+G (d, p) optimized geometry was calculated, for predicting reactive sites for electrophilic and nucleophilic attack for the investigated molecule.
Figure 12 shows the electron density (ED), electrostatic potential (ESP) and the molecular electrostatic potential (MEP) map figures for 4FA. The ED plots for the title molecule show a uniform distribution. However, the ESP figures show that the negative potential is localized more over the NH2 group and fluorine atom and is reflected as a yellowish blob, the positive ESP is localized on the rest of the molecule. This result is expected, because ESP correlates with electro negativity and partial charges. The different values of the electrostatic potential at the surface are represented by different colours. Potential increases in the order red<orange<yellow<green<blue. In the Figure 12, the positive (blue) regions to nucleophilic reactivity and the negative (red and yellow) regions of the MEP are related to electrophilic reactivity. As can be seen from the figure and the computed results, the MEP map shows that the negative potential sites are in fluorine atom and the positive region is over the hydrogen atoms of NH2 group. From these results, the H atoms of NH2 group indicate the strongest attraction and fluorine atom indicates the strongest repulsion. These sites give information about the region from where the compound can have intermolecular interactions. Thus, it would be predicted that the 4FA molecule will be the most reactive site for both electrophilic and nucleophilic attack.

Figure 12: (a) Electrostatic potential (ESP) (b) Electron density (ED) and (c) The molecular electrostatic potential (MEP) map for 4-fluoroaniline.
Other molecular properties
Normally, the thermodynamical analysis on aromatic compound provides the necessary information regarding the chemical reactivity. Table 5 gives the standard statistical thermodynamic functions: heat capacity, zero point energy, entropy of 4FA, on the basis of vibrational analysis at B3LYP method. There is only a marginal difference in the values calculated by both the methods. The variation in the ZPVE seems to be significant. The molecular charge distribution is reflected by the dipole moment and is given as a vector in three dimensions. Therefore, it can be used as descriptor to depict the charge movement across the molecule.
| Parameters | Method/Basis set | |
|---|---|---|
| B3LYP/6-31+G (d, p) | B3LYP/6-311++G (d, p) | |
| Optimized global minimum Energy (Hartrees) | -386.86972381 | -386.95473148 |
| Total energy(thermal), Etotal (kcal mol-1) | 72.375 | 72.130 |
| Heat capacity, Cv(cal mol-1 k-1) | 26.377 | 26.413 |
| Entropy, S (cal mol-1 k-1) | - | - |
| Total | 80.415 | 80.430 |
| Translational | 40.030 | 40.030 |
| Rotational | 27.951 | 27.937 |
| Vibrational | 12.434 | 12.462 |
| Vibrational energy, Evib(kcal mol-1) | 70.597 | 70.352 |
| Zero point vibrational energy, (kcal mol-1) | 68.17493 | 67.92611 |
| Rotational constants (GHz) | - | - |
| A | 5.57988 | 5.61161 |
| B | 1.43787 | 1.44350 |
| C | 1.14436 | 1.14928 |
| Dipole moment (Debye) | - | - |
| μx | -3.0011 | 2.9829 |
| μy | -0.0005 | 0.0000 |
| μz | 1.0085 | 0.9871 |
| μtotal | 3.1660 | 3.1420 |
Table 5: Thermodynamic properties of 4-fluoroaniline.
Direction of the dipole moment vector in a molecule depends on the centers of positive and negative charges. The total dipole moment of 4FA determined by the B3LYP method using 6-31+G (d, p) and 6-311++G (d, p) basis sets are 3.166 and 3.142 Debye, respectively. The total energy and the change in the total entropy of the compound at room temperature are also presented. All the thermodynamic data are helpful for the further study on the 4FA. They can be used to compute the other thermodynamic energies and estimate directions of chemical reactions.
Conclusion
The molecular structural parameters and fundamental vibrational frequencies of 4-fluoroaniline have been obtained from DFT/B3LYP calculation. The effect of halogen substituent on vibrational frequencies is analysed in detail. In the present, most of the fundamentals are believed to be assigned, unambiguously. The SERS spectra show enhancement in most of regions of the spectra. But concentration dependence of the enhancement is not very clear.
The frequency assignments are strongly supported by the TED calculation about the normal modes of vibratio. The calculated first order hyperpolarizability was found to be 0.798 × 10⁻³⁰ esu, which is 2 times greater than reported in literature for urea. The HOMO and LUMO energy gap shows that the charge transfer occurs within the molecule, which is responsible for the bioactive property of the molecule. The MEP map predicts the reactive sites for electrophilic and nucleophilic attack the molecule and the results are discussed. Furthermore, the thermodynamic and Mulliken charge analysis of the compound have been calculated in order to get insight into the compound.
References
- Diaz FR, Sanchez CO, Del Valle MA, et al. Synthesis, characterization and electrical properties of poly(2,5-, 2,3- and 3,5-dichloroaniline)s: Part II. Copolymers with aniline. Synth Met. 2001;118:25-31.
- Dong Y, Mu S.Photoelectrochemicalbehaviour of polyaniline affected by potentials and pH of solutions.ElectrochemActa. 1991;36:2015-8.
- Evgen’ev MI, Evgen’eva II, Garmonov SY, et al. Sorption-Chromatographic Determination of Aniline, 4-Chloroaniline and 2,5-Dichloroaniline in Air.J Analyt Chem. 2003;58:542-7.
- Wojciechowski PM, Michalska D. Theoretical Raman and infrared spectra and vibrational assignment for para-halogenoanilines: DFT study.SpectrochimActa. 2007;68:948-55.
- Kavitha E, Sundaraganesan N, Sebastian S. Molecular structure, vibrational spectroscopic and HOMO, LUMO studies of 4-nitroaniline by density functional method.Ind J Pure Appl Phys. 2010;48:20-30.
- Arjunan V, Rani T, Mohan S. Spectroscopic and quantum chemical electronic structure investigations of 2-(trifluoromethyl)aniline and 3-(trifluoromethyl)aniline. J MolStruct. 2011;994:179-93.
- Femina Jasmine G, Amalanathan M, Dawn Dharma Roy S. Molecular structure and charge transfer contributions to nonlinear optical property of 2-Methyl-4-nitroaniline: A DFT study. J MolStruct. 2016;1112:63-70.
- Revathi B, Balachandran V, Raja B, et al. Potentially useful to NLO materials: 4-Chloro-3-(trifluoromethyl)aniline, 4-bromo-3-(trifluoromethyl)aniline and 4-fluoro-3-(trifluoromethyl)aniline are combined experimental and theoretical vibrational analysis. J MolStruct. 2017;1141:81-92.
- Creighton JA, Blatchford CG, Albrecht MG. Plasma resonance enhancement of Raman scattering by pyridine adsorbed on silver or gold sol particles of size comparable to the excitation wavelength. J ChemSoc Farad Trans. 1979;75:790-8.
- Frisch MJ, Trucks GW, Schlegel HB, et al. Gaussian09, Revision A.02, Gaussian Inc., Wallingford CT, 2009.
- Sundius T. ‘Scaling of ab initio force fields by MOLVIB.VibSpectrosc. 2002;29:89-95.
- Molvib V.7.0: Calculation of Harmonic Force Fields and Vibrational Modes of Molecules, QCPE Program No. 202;807.
- Colapietro M, Domenicano A, Marciante C, et al. Structural studies of benzene derivatives. IX. The structures of p-fluoroaniline and p-cyanoaniline hydrochlorides.ActaCryst. 1981;B37:387-94.
- Arivazhagan M, Jeyavijayan S, Geethapriya J. Conformational stability, vibrational spectra, molecular structure, NBO and HOMO–LUMO analysis of 5-nitro-2-furaldehyde oxime based on DFT calculations.SpectrochimActa. 2013;104A:14-25.
- Jeyavijayan S. Spectroscopic (FTIR, FT-Raman), molecular electrostatic potential, NBO and HOMO–LUMO analysis of P-bromobenzenesulfonyl chloride based on DFT calculations.SpectrochimActa. 2015;136A:890-9.
- Gunasekaran S, Seshadri S, Muthu S, Vibrational spectra and normal coordinate analysis of flucytosine. Indian J Pure Appl Phys. 2006;4:581-6.
- Arivazhagan M, Jeyavijayan S. Vibrational spectroscopic, first-order hyperpolarizability and HOMO, LUMO studies of 1,2-dichloro-4-nitrobenzene based on Hartree-Fock and DFT calculations.SpectrochimActa. 2011;79A:376-83.
- Socrates G. Infrared and Raman Characteristic Group Frequencies-TABLES at Charts.3rd ed. Wiley; New York. 2001.
- Gao X, Davies JP, Weaver MJ. Test of surface selection rules for surface-enhanced Raman scattering: The orientation of adsorbed benzene and monosubstituted benzenes on gold. J Phys Chem. 1990;94:6858-64.
- Cross AD. Introduction to Practical Infrared Spectroscopy. London;Butterworths Scientific Publications. 1960.
- Geskin VM, Lambert C, Bredas JL. Origin of high second- and third-order nonlinear optical response in ammonio/boratodiphenylpolyene zwitterions: The remarkable role of polarized aromatic groups. J Am Chem Soc. 2003;125:15651-8.
- Sajan D, Hubert Joe I, Jayakumar VS, et al. Structural and electronic contributions to hyperpolarizability in methyl p-hydroxy benzoate. J MolStruct. 2006;785:43-53.
- Sun YX, Hao QL, Wei WX, et al. Experimental and density functional studies on 4-(3,4-dihydroxybenzylideneamino) antipyrine and 4-(2,3,4-trihydroxybenzylideneamino)antipyrine. J MolStruct (Theochem.) 2009;904:74-82.
- Fleming I. Frontier Orbitals and Organic Chemical Reactions, Wiley; London. 1976.
- Rastogi VK, Palafox MA, Mittal L, et al. FTIR and FT-Raman spectra and density functional computations of the vibrational spectra, molecular geometry and atomic charges of the biomolecule: 5-bromouracil. J Raman Spectrosc. 2007;38:1227-41.
- Murray JS, Sen K. Molecular Electrostatic Potentials, Concepts and Applications, Elsevier; Amsterdam.1996;pp:7-624.
- Scrocco E, Tomasi J. Electronic molecular structure, reactivity and intermolecular forces: Aneuristic interpretation by means of electrostatic molecular potentials.Adv Quantum Chem. 1978;11:115-93.
