Original Article
, Volume: 15( 1)Catalytic Wet Peroxide Oxidation of Phenol Over CaO-CuO-CeO2 Mixed Oxide
- *Correspondence:
- Hoang Thi Huong Hue Faculty of Chemistry, Hanoi University of Science, Vietnam, Tel: +844 38253503; E-mail: hoangthihuonghue@hus.edu.vn
Received: March 06, 2017 Accepted: March 15, 2017 Published: March 21, 2017
Citation:Hue TH, Son PA, Quang NV. Catalytic Wet Peroxide Oxidation of Phenol Over Cao-Cuo-Ceo2 Mixed Oxide. Int J Chem Sci. 2017;15(1):113.
Abstract
CaO-CuO-CeO2 materials with different contents of CaO and CuO are fabricated by the sol-gel method and used as the catalysts for the complete decomposition of phenol with hydrogen peroxide. The prepared solids are characterized by various techniques such as X-ray diffraction (XRD), thermal analysis (TG/DTA), scanning electron microscopy (SEM), temperature-programmed reduction (H2-TPR), Raman Spectroscopy, and X-ray photoelectron spectroscopy (XPS). The relationship between catalytic activity and properties of materials is carefully investigated. The XPS results confirm the existence of copper species in the bivalent form, while the H2-TPR elucidates the three existence states of copper species in sample, namely amorphous, crystalline CuO and copper ions participating the crystal lattice of CeO2 to form solid solution. The results show that the optimum concentrations of CuO and CaO mixed oxide are 15 mol% and 7.5 mol% in order to obtain single CeO2 phase possessing higher catalytic activity. The gel aging and calcination conditions also significantly impact the surface morphology and the activity of the formed solids. Under the optimum fabrication conditions of catalyst, the highest phenol conversion is 96%. It was proven that the modification of CeO2 by both copper and calcium generates the large amount of oxygen vacancies, which positively effect on the catalytic activity.
Keywords
CaO-CuO-CeO2; Mixed oxide; Sol-gel; Oxidation of phenol
Introduction
Volatile organic compounds (VOCs) emitted from a variety of industrial processes and transportation activities are considered as an important class of air pollutants. Catalytic oxidation is one of the most developed techniques used for the elimination of VOCs, because the catalytic oxidation occurs at lower temperature compared with the normal thermal oxidation. The typical catalysts for the VOC oxidation are mainly noble metals, which show high activity at low temperatures, but such metals are costly and have low stability in the presence of chloride compounds. Normally, the metal oxides (Fe, Cr, Cu, Mn and Co) are alternative to the noble metals as catalysts for the VOC oxidation. Although they are less active than the noble metals at low temperatures, they are cheaper and present sufficient activity. CuO-CeO2 mixed metal oxide comprises a promising family of catalysts and has been studied by many investigators in various reactions, such as, the combustion of CO and CH4, the water-gas shift reaction, the reduction of NO, the decomposition of H2O2 and the wet oxidation of phenol [1]. The high activity of CuO-CeO2 is attributed to the promoting effect of ceria due to its high oxygen storage capacity, the facile Ce4+/Ce3+ redox cycle and the strong interaction between the copper oxide and oxygen vacancies on ceria support at the interface boundary. In addition, the increase of oxygen bulk mobility of ceria-based catalysts by introducing defective sites seems to be effective for the promotion of oxidation reactions. It was reported that calcium-doped CeO2 would tend to introduce defects and oxygen vacancies in the CeO2 fluorite structure, and also could lower the energy for charge transfer from oxygen ions to cerium ions [2]. However, to the best of our knowledge, there has been no study on the effect of Ca on the CuO-CeO2 composite oxide catalysts for the phenol oxidation reaction.
In the present work, a series of CaO-CuO-CeO2 mixed oxides with a change in the mole fractions of CaO and CuO were prepared by the sol-gel method, and were characterized by XRD, Raman, TG and H2-TPR techniques. The catalytic activity of CaO-CuO-CeO2 mixed oxide was investigated in the phenol oxidation with hydrogen peroxide.
Materials and Methods
Materials
Ce(NO3)3.6H2O, Cu(NO3)2.3H2O, Ca(NO3)2.4H2O, citric acid (C6H8O7) are reagent grade and used without purification.
Catalyst preparation
The CaO-CuO-CeO2 mixed oxides with the CaO content of 2.5, 5.0, 7.5, 10, 15 mol.%, and CuO content of 5, 10, 15, 20, 25 mol.% were prepared by the citric acid sol-gel method [2]. The nitrate salts, Ce(NO3)3.6H2O, Cu(NO3)2.3H2O and Ca(NO3)2.2H2O, were dissolved in suitable amounts of distilled water. Citric acid was added with double molar amounts to the premixed nitrate solutions of cerium, copper and calcium. Then, the obtained solution was stirred at 70°C to 80°C until the color of reaction solution changed from blue to green. Once the gel formed, the temperature was quickly elevated to 150°C, and the gel was foamed with production of nitrogen oxide vapors and burnt with sparks. A solid product was obtained after the sparks were extinguished. The as-obtained powder was calcined at 400°C, 500°C, 600°C and 700°C for 10, 30, 60, 120, 180 and 240 min in air.
Catalytic activity tests
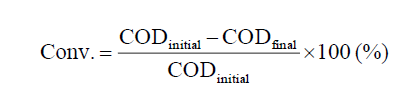
The catalysts were tested for the phenol oxidation reaction in a 250 mL batch reactor equipped with a thermocouple. The experiments were performed at 70°C under atmospheric pressure with stirring rate of 600 rpm for 45 min. In a typical run, 0.025 g of catalyst powder was added into 150 mL of 536 mg L-1 aqueous phenol solution. When the reaction temperature reached 70°C, 3.5 mL of 30 wt.% hydrogen peroxide solution were charged into the reactor. Complementary experiments were performed by varying the reaction conditions. During the reaction, liquid samples were taken at different time intervals and analyzed. Phenol concentrations were measured by the chemical oxygen demand (COD) that was determined by the colorimetric method after reflux with K2Cr2O7 [3]. The phenol conversion was calculated by the following formula:
Techniques for characterizing materials
XRD patterns were obtained on a Bruker D8 Advance diffractometer using the CuK α radiation,λ =1.5406 nm, with an X-ray generator working at 40 kV and 40 mA. The data (2θ) were collected from 20° to 70° with the scanning rate of 2° min-1. Thermogravimetric analysis was performed with Labsys TG/DSC 1600 Setaram using Pt crucible in the temperature range from RT to 800°C with the heating rate of 10°C min-1 in air flow (40 mL min-1). Temperature-programed reduction (TPR) experiments were performed on an Auto Chem II 2920 V4.01 under 10 vol.% H2/Ar mixture at flow rate of 50 cm3/min-1 and a heating rate of 10°C min-1. The Raman spectra were recorded on a Labram HR 800 Raman spectrometer at RT and moisture-free conditions using the emission line at 632.8 nm from a laser source. The scanning electron micrographs (SEM) were taken by a HITACHI S-4800 operating at 40 kV. The surface areas of the samples were estimated at 77K by N2 adsorption using a Quantachrome Autosorb Automated Gas Sorption System. Before each measurement, samples were outgassed at 573 K for 3 h.
Results and Discussion
Firstly, a series of CaO-CuO-CeO2, in which the CuO content was varied from 5 mol% to 25 mol% while the content of CaO was fixed at 5 mol%, was fabricated. The second series of mixed oxide was prepared when remaining concentration CuO at 15 mol.% and varying CaO concentration from 2.5 mol% to 15 mol%. The other conditions were kept as following: the gel aging temperature of 80°C, the calcination temperature and time of 500°C and 60 min, respectively.On XRD patterns of all materials of the first series, (Figure. 1a) there are 4 distinguishable diffraction peaks at the values of 2θ of 28.61°C, 33.26°C, 47.61°C and 56.45°C, which are characteristics of the fluorite structure of CeO2. However, on XRD patterns of solids containing 20 and 25 mol% CuO, the additional weak peaks appear at 35.7°C and 38.8°C. These peaks correspond to the CuO phase with the monoclinic structure. It means that copper may exist in the solids in different forms. At low concentrations of CuO, all added Cu species could replace Ce ions in the crystal lattice, thereby producing solid solution [4,5]. When the amount of CuO exceeds 15 mol%, the individual CuO phase appears in the samples. Similar to the first series, the main phase of all solids in second series is CeO2 and the individual CuO phase is observable when the concentration of CaO over 7.5 mol% (Figure. 1b). Although the content of CuO in second series is kept at 15 mol%, the monoclinic CuO phase still presents in the solids (entries 9-10). This is due to the fact that the presence of CaO reduces the solubility of CuO in CeO2 substrate of the solid solution. In other words, the solubility of CuO was inversely related with the CaO concentration [2].

Figure 1: XRD patterns of CaO-CuO-CeO2 mixed oxides with various CuO and CaO contents. Fabrication conditions: Citric acid (double molar amount to the total of Ce, Cu, Ca), aging temp. (80°C), calcination temp. (500°C), calcination time (60 min).
Reaction conditions: catalyst (0.025 g), phenol solution (150 mL with CODinitial=1420 mg(O2) L-1), temperature (70°C), 30 wt.% H2O2 (3.5 mL), time (45 min). 5 mol% CaO for entries 1-5, 15 mol% CuO for entries 6-10.
The estimation of the influence of the CuO and CaO contents on the catalytic activity of the prepared materials, is introduced in the Table 1. It is easy to recognize that in each series, the increase in the concentration of changed metal leads to the increase of phenol conversion (entries 1-3 and entries 6-8). The catalysts in those experiments contain only one phase of CeO2. The continuing rise of CuO or CaO content reduces the phenol conversion (entries 4-5 and entries 9-10) and, at the same time, causes the appearance of the monoclinic CuO phase. Consequently, the presence of CuO phase in the materials is responsible for the decline in their catalytic activity and whithin the defined ranges of CuO and CaO concentrations, the phenol conversion is found to be directly related with the content of CuO or CaO.
| Entry | Changed element | Content (mol%) | Phase composition | CODfinal | Phenol conv. (%) |
|---|---|---|---|---|---|
| 1 | Cu | 5.0 | CeO2 (cubic) | 275 | 80.6 |
| 2 | Cu | 10 | CeO2 (cubic) | 249 | 82.5 |
| 3 | Cu | 15 | CeO2 (cubic) | 183 | 87.1 |
| 4 | Cu | 20 | CeO2 (cubic) CuO (monoclinic) |
220 | 84.5 |
| 5 | Cu | 25 | CeO2 (cubic) CuO (monoclinic) |
281 | 80.2 |
| 6 | Ca | 2.5 | CeO2 (cubic) | 276 | 80.6 |
| 7 | Ca | 5.0 | CeO2 (cubic) | 183 | 87.1 |
| 8 | Ca | 7.5 | CeO2 (cubic) | 142 | 90.0 |
| 9 | Ca | 10.0 | CeO2 (cubic) CuO (monoclinic) |
203 | 85.7 |
| 10 | Ca | 15.0 | CeO2 (cubic) CuO (monoclinic) |
235 | 83.5 |
Table 1. The effect of CuO and CaO contents on the phase composition and the catalytic activity of the mixed oxides.
At low concentration, part of copper ions could exist in samples as amorphous CuO form, and the other part might replace Ce4+ in the crystal lattice of CeO2 to produce solid solutions. Because of the difference of positive charge between copper and cerium ions, some oxygen ions O2- must go out in order to preserve the electroneutrality of the solid, thereby forming the vacancies in the solid solution. In these cases, the characteristic peaks of CuO are not observed on the XRD patterns [6-8]. If the added amounts of the modifying oxides were large enough (above 15 mol% for CuO, and 7.5 mol% for CaO), the CuO would play the role of the contamination phase, which is responsible for the decrease in the phenol conversion (entries 4,5,9,10). From above results, the appropriate contents of CuO and CaO in mixed oxides in order to reach the maximum phenol conversion should be 15 and 7.5 mol%, respectively. That composition prevents the formation of an individual CuO phase, while generates the maximum quantity of oxygen vacancies in the crystal lattice [9,10], thus, give rises to the best catalytic activity of the mixed oxide (entry 8).
The effects of the age and calcination of gel on the catalytic activity were carefully investigated. To evaluate the effect of gel, aging temperature, the concentrations of CuO and CaO were fixed at 15 mol% and 7.5 mol%, and the calcination was carried out at 500°C for 60 min, while the aging temperature was varied from 40°C to 120°C.
The results indicate the increase in the catalytic activity as the decrease of the gel aging temperature. Particularly, the lower aging temperature is, the higher phenol conversion is Figure. 2. At the low aging temperatures, the gel formation takes a longer time but the formed gel is more homogeneous. The slow emission of NO2 from the gel formation process yields the xerogel with very large volume, therefore produces the very fine mixed oxide powder. This is the reason of the gain in the catalytic activity as the decrease of the gel aging temperature. The best phenol conversion (92.3%) was obtained at the aging temperature of 50°C. However, at this temperature, the time of the gel formation is too long. Thus, in order to reduce the gel formation time, the aging temperature is selected to be 70°C. At this temperature, the gel formation time is shortened, while the high catalytic activity is still conserved (90% phenol conversion).

Figure 2: The dependence of phenol conversion on the gel aging temperature. Reaction conditions: catalyst (0.025 g), phenol solution (150 mL with CODinitial=1420 mg(O2) L-1), temperature (70°C), 30 wt.% H2O2 (3.5 mL), time (45 min).
The calcination process also exerts significant influence on the catalytic activity. The calcination at low temperatures causes the incomplete decomposition of the precursors, and hence the formation of contamination. In the opposite direction, at too high temperature may occur the aggregation of particles, which is unfavorable for the catalytic activity. In order to choose the suitable temperature range, the TG/DTA curves of the dried gel were recorded (Figure. 3).

Figure 3: TG/DTA diagram of a xerogel.
The mass loss of ca. 63 wt.% occurring in the temperature range from RT to 500°C accompanies a strong exothermic effect at 283°C with long tail vanishing at 450°C. This effect is assigned to the combustion of the xerogel in air flow. From the TG/DSC results, the calcination temperatures are selected in the range over 300°C for 60 min. The phenol conversion increases gradually versus the calcination temperature in the range of 300°C to 600°C, but decreases dramatically at the temperature higher than 600°C (Figure. 4a). At the temperature, lower than 600°C, the decomposition is not complete. However, over the temperature of 600°C the formed particles might aggregate to produce larger blocks, which can be indicated in SEM results of the samples (Figure. 5c). At 400°C, the solid exhibits a sponge-like morphology and the particles are ambiguously formed (Figure. 5a). At 600°C, the particles are quite uniform with the size of 50 nm to 70 nm (Figure. 5b).

Figure 4: The dependence of the phenol conversion on the gel calcination temperature and time. Reaction conditions: catalyst (0.025 g), phenol solution (150 mL with CODinitial=1420 mg(O2) L-1), temperature (70°C), 30 wt.% H2O2 (3.5 mL), time (45 min).

Figure 5: SEM photographs of a mixed oxide calcined at (a) 400°C, (b) 600°C and (c) 700°C for 60 min, and at 600°C for (d) 10 min, (e) 30 min and (f) 240 min.
Figure. 5b and Figure. 5d-5f are SEM photographs of a solid calcined at 600°C for 60, 10, 30 and 240 min, respectively. If the calcination time is too short, the precursors do not decompose completely, and the surface morphology of solid looks like a foam pieces. The fine particles are clearly observed when calcination time is set in range of 30 to 60 min. In this range, the particle size slightly increases from ca. 40 nm to ca. 60 nm (Figure. 5b and Figure. 5e). The particles seem to agglomerate forming lager grains as the calcination time increases. The Figure. 5f represents the agglomeration of particles when the sample is calcined at 600°C for 4 h. The catalytic activity of the materials calcined at 600°C for 10 to 240 min was exhibited in Figure. 4b. The phenol conversion is very low at 10 min of calcination, and reaches the maximum at 30 min, and gradually decrease at the longer calcination times.
The above results firmly indicate the effect of the calcination time and temperature on the morphology and the catalytic activity of the prepared materials. The optimum condition for calcination could be inferred to be 600°C for 30 min. Under this condition, the phenol conversion could achieve the value of 96.3%.
In oder to estimate the preeminent property of CaO-CuO-CeO2, its catalytic activity is compared to one of other catalysts under the same reaction conditions. The results are shown in Figure. 6.

Figure 6: Phenol conversion of various tested catalysts. Reaction conditions: catalyst (0.025 g), phenol solution (150 mL with CODinitial=1420 mg(O2) L-1), temperature (70°C), 30 wt.% H2O2 (3.5 mL), time (45 min).
In the absence of any catalyst, the phenol conversion is very low (4.23%). The individual CuO and CeO2 also give low catalytic activities with 16.8% and 14.4% of the phenol conversion, respectively. The catalytic activity of CeO2 increased significantly when it is modified by CaO or CuO. The phenol conversion could reach 37.2% or 62.6% when CaO-CeO2 or CuO-CeO2 mixed oxide is used as catalyst. However, those results are not comparable with the activity of CeO2 modified by both CuO and CaO, which could catalyse the decomposition of 96.3% of phenol.
The very high activity of CaO-CuO-CeO2 material confirms the important role of CuO in significant improvment of the activity of CeO2 as well as the positive impact of the CaO doping to the CuO-CeO2 mixed oxide. The phenol conversion over CaO-CuO-CeO2 catalyst increases 1.5 times compared to the case of using CuO-CeO2 as catalyst. The role of CaO doping is to increase the concentration of oxygen vacancies in the crystal lattice of CeO2 [2,11].
Because of its limitation, the XRD technique was not adequate to explain the all states of metals in samples. To elucidate the chemical existence states of copper and cerium species in the mixed oxides, the H2-TPR, XPS and Raman techniques are utilized.
The H2-TPR profile of CaO-CuO-CeO2 catalyst exihibits a narrow peak at low temperature, which is a characteristic of solid possessing very fine and uniform particles, and a broaden peak at higher temperature [12]. The former is deconvoluted into three reduction peaks in the temperature range of 100°C to 250°C corresponding to three existence states of copper species in the mixture. The peak at about 168°C is attributed to the reduction of the CuO species which are very fine particles and well dispersed on the surface of the CeO2 substrate [13-15], while the peak at about 202°C is assigned to the reduction of the crystalline CuO species [15-17]. The peak mainly contributing to the total reduction peak of copper appears at 191°C. This peak result from the reduction of the copper ions substituting cerium ions in the CeO2 crystal lattice [14-16]. Comparing to the H2-TPR profile of the pure CuO, which shows only one reduction peak at 294°C [17], all reduction peaks of Cu species in the mixed oxide appear at lower temperatures. This observation reveals the good interaction of the all existence states of copper with the CeO2 substrate. The second peak in H2-TPR profile widely spreads from 400°C to 850°C and corresponds with the reduction peak of CeO2 in solid solution [8,17,18] (Figure. 7).

Figure 7: H2-TPR profile of a CaO-CuO-CeO2 catalyst.
XPS is a powerful technique to clarify the oxidation state of the transition metal compounds based on the different energies of the photoelectrons. In this research, the chemical state of copper and cerium are carefully analyzed. The Cu 2p and Ce 3d core level spectra of a mixed oxide sample are shown in Figure. 8.

Figure 8: Cu 2p and Ce 3d core level photoelectron profiles of mixed oxide sample.
The Cu 2p region is fitted to four components using the CasaXPS 2.3.16 software. The spectrum has two main peaks center at 933.51 and 953.26 eV attributed to Cu 2p3/2 and 2p1/2 levels with the spin-orbit splitting of 19.75 eV. These binding energy values are characteristics of copper with oxidation state of +2. Another evidence for the existence of bivalent copper is the apparence of two shakeup satellite peaks at 941.91 and 962.16 eV. These satellite signals originate from an electron transfer from 2p orbital of oxygen to a 3d orbital of copper [19]. It is known that while the Cu+ and Cu° species have closed 3d electron valence shell, the Cu2+ species have lone 3d valence electron. Therefore, the shakeup satellite peaks with high intensity are exclusively observed on spectra of Cu (II) compounds as being demonstrated from the curve-fitted spectra.
The Ce 3d region could be deconvoluted into ten components originated from its different chemical states (Ce4+ and Ce3+) as shown in Figure. 8. In detail, three sets of spin-orbit split doublets comprising (v, u), (v’’, u’’), and (v’’’, u’’’) represent the 3d104f0 initial electronic state assigned to Ce4+. Contributed by Ce3+ with the valence electronic configuration of 3d104f1. The remaining components consist of the signals (vo, uo) and (v’, u’) [20]. The relative abundance of the Ce3+ and Ce4+ can be inferred by considering the contribution of each oxidation state to the 3d region. According to the areas of v and vo peaks, the relative amounts of CeO2 and CeO1.5 are 73% and 27%, respectively. Therefore, the average chemical formula of cerium oxide in the mixed oxide is CeO1.87.
As discussed above, CuO might exist in CaO-CuO-CeO2 mixed oxide under three states: amorphous CuO, crystalline CuO, and copper ions in the crystal lattice of the solid solution Ce1-x-y CaxCuyO2-δ. The first and third type of copper strongly interact with CeO2 to form oxygen vacancies located on the surface as well as inside the CeO2 lattice [14,15]. The presence of oxygen vacancies can be demonstrated by the Raman spectroscopy.
Figure. 9 represents the Raman spectra of the pure CeO2 and a mixed oxide. Both of the spectra exhibit a strong absorption band at 462 cm-1 corresponding to the coordination of oxygen anions around cerium cations. This peak is characteristic of face-centered cubic structure of CeO2 [21,22].

Figure 9: FigureRaman spectra of CeO2 and CaO-CuO-CeO2 materials.
Besides the main peak, there is a weak and broad peak at 584 cm-1 confirming the presence of defects in the crystal lattice of CeO2 [21,23,24]. In this case, the defects are formed due to the substitution of Ce4+ by Cu2+ and Ca2+. According to the literature [21], the relative concentration of oxygen vacancies can be represented by the area ratio of peaks 584 cm-1 and 462 cm-1 (noted as A584/A462). For the representative CaO-CuO-CeO2 sample, the calculated value of the A584/A462 is 0.23. This value is similar to those of similar systems.
Conclusion
A series of CaO-CuO-CeO2 mixture oxides are successfully fabricated via the sol-gel method and characterized by XRD, SEM, H2-TPR and Raman techniques. The catalytic activity of CaO-CuO-CeO2 depends not only on concentrations of CaO and CuO, but also on the aging and calcination conditions. Under the optimum fabrication conditions of catalyst (15 mol% CuO, 7.5 mol.% CaO, aging at 70°C and calcination at 600°C for 30 min), the catalyst particles are very small and uniform with the particle size of ca. 30 nm to 40 nm and the maximum of the phenol conversion could reach 96%. The excess of CuO amount results in the formation of the individual CuO phase, which causes the decline of the catalytic activity. The oxidation state of +2 of copper species is elucidated by the Cu 2p binding energies as well as the apparence of shakeup satellite peaks in XPS spectra. The existence of three states of copper species in solid, namely copper ions in the crystal structure of solid solution, the amorphous and crystalline CuO phases, is clarified by H2-TPR. Furthermore, the substitution of Ce4+ by copper and calcium cations brings about the apparence of the large amount of oxygen vacancies, the relative concentration A584/A462 of which is estimated to be 0.23 from Raman spectra. The catalytic activity directly relates with the concentration of defects in the crystal lattice of the solid solution.
Acknowledgement
This work is financially supported by the QG.14.20 project.
References
- Delimaris D, Ioannides T. VOC oxidation over CuO-CeO2 catalysts prepared by a combustion method. Appl Catal B: Environ. 2009;89:295-6.
- Qiao D, Lu G, Mao D, et al. Effect of Ca doping on the catalytic performance of CuO-CeO2 catalysts for methane combustion.Catal Commun. 2010;11:858.
- Clesceri LS, Geenberg A. In: Eaton A, editor. Standard method for the examination of water and wastewater, 20th edition, American Public Health Association, Washington DC 1998.
- Liu Y, Fu Q, Stephanopoulos MF. Preferential oxidation of CO in H2 over CuO-CeO2 catalysts. Catal Today. 2004;241:93-5.
- Astudillo J, Aguila G, Diaz F, et al. Study of CuO-CeO2 catalysts supported on SiO2 on the low-temperature oxidation of CO. Appl Catal A: General.2010;381:169.
- Ribeiro NFP, Souza MMVM, Schmal M. Combustion synthesis of copper catalysts for selective CO oxidation. J Power Sources. 2008;179:329.
- Massa P, Ivorra F, Haure P, et al. Catalytic wet peroxide oxidation of phenol solutions over CuO/CeO2 systems.J Hazard Mater. 2011;190:1068.
- Zheng XC, Wang SP, Wang SR, et al. Preparation, characterization and catalytic properties of CuO/CeO2 system. Mater Sci Eng C. 2005;25:516.
- Hu C.Enhanced catalytic activity and stability of Cu0.13Ce0.87Oy catalyst for acetone combustion: Effect of calcination temperature.Chem Eng J.2010;159:129.
- Fu M, Yue X, Ye D, et al. Soot oxidation via CuO doped CeO2 catalysts prepared using coprecipitation and citrate acid complex-combustion synthesis. Catal Today. 2010;153:125.
- The behavior of mixed-metal oxides: Structural and electronic properties of Ce1−xCaxO2 and Ce1−xCaxO2−x. J Chem Phys. 2003;119:5659.
- Xiaoyuan J, Guanglie L, Renxian Z, et al. Studies of pore structure, temperature-programmed reduction performance, and micro-structure of CuO/CeO2 catalysts.Appl Surf Sci. 2001;173:208.
- Liu Z, Zhou R, Zheng X. Influence of preparation methods on CuO-CeO2 catalysts in the preferential oxidation of CO in excess hydrogen.J Nat Gas Chem. 2008;17:125.
- Liu Z, Zhou R, Zheng X. Comparative study of different methods of preparing CuO-CeO2 catalysts for preferential oxidation of CO in excess hydrogen. J Mol Catal A: Chem. 2007;267:137.
- Luo MF, Song YP, Lu JQ, et al. The preferential oxidation of CO in excess hydrogen: A study of the influence of KOH/K2CO2 on CuO-CeO2−xcatalysts. J Phys Chem C. 2007;111:12686.
- Liu Z, Zhou R, Zheng X. The preferential oxidation of CO in excess hydrogen: A study of the influence of KOH/K2CO3 on CuO-CeO2−xcatalysts. J of Mol Catal A: Chem. 2006;255:103.
- Avgouropoulos G, Ioannides T, Matralis H. Influence of the preparation on the performance of CuO-CeO2 catalysts for the selective oxidation of CO. Appl Catal B: Environ.2005;56:87.
- Tabakova T, Idakiev V, Papavasiliou J, et al. Effect of additives on the WGS activity of combustion synthesized CuO/CeO2 catalysts Catalysis. Catal Commun. 2007;8:101.
- Chanquia CM, Sapag K, Rodríguez-Castellón E, et al. Nature and location of copper nano species in mesoporous molecular sieves. J Phys Chem C. 2010;114:1481.
- Zhou Y, Perket JM, Zhou J, et al. Growth of Pt nanoparticles on reducible CeO2(111) thin films: Effect of nanostructures and redox properties of Ceria. J Phys Chem C. 2010;27:11853.
- Gurbani A, Ayastuy JL, González-Marcos MP, et al. CuO-CeO2 catalysts synthesized by various methods: Comparative study of redox properties.Int J Hydrogen Energy. 2010;35:11582.
- Shan W, Feng Z, Li Z, et al. Oxidative steam reforming of methanol on Ce0.9Cu0.1Oy catalysts prepared by deposition-precipitation, coprcipitation, and complexation-combustion methods. J Catal. 2004;228:206.
- Chen J, Zhan Y, Zhu J, et al. The synergetic mechanism between copper species and ceria in NO abatement over Cu/CeO2catalysts. Appl Catal A: General. 2010;377:121.
- Martínez-Arias A, Gamarra D, García MF, et al. Comparative study on redox properties of nanosized CeO2 and CuO/CeO2 under CO/O2. J Catal. 2006;240:1.
