Original Article
, Volume: 15( 4)Application of Taguchi Approach to Optimize Performance and Emission Parameters of Single Cylinder Direct Injection Diesel Engine Using Karanja Methyl Ester
- *Correspondence:
- Venkatanarayana B Department of Mechanical Engineering Andhra University, Visakhapatnam Andhra Pradesh, India
Tel: 08912844000; E-mail: pulven75@gmail.com
Received Date: May 02, 2017 Accepted Date: October 31, 2017 Published Date: November 03, 2017
Citation:Venkatanarayana B, Ratnam CH. Application of Taguchi Approach to Optimize Performance and Emission Parameters of Single Cylinder Direct Injection Diesel Engine Using Karanja Methyl Ester. Int J Chem Sci. 2017;15(4):213.
Abstract
The present study deals with the use of Taguchi approach to optimize the engine performance and emission characteristics of single cylinder DI engine which operates with Karanja oil methyl ester called KOME of 10% blend, 20% blend, 30% blend and 40% blend. As per the DOE, Taguchi L16 orthogonal array was considered. The signal-to-noise (S/N) ratio and the analysis of variance (ANOVA) were exploited to establish the optimal factor levels and to analyze the effect of the significant conditions on performance and emission characteristics. Among all the key engine operating parameters, 5 critical factors were selected which are namely load (L), the percentage of KOME, compression ratio (CR), injection pressure (IP) and injection timing (IT). The confirmative experiment was conducted and tested at the confidence level. Analysis of brake thermal efficiency (BTHE), HC and NOx presented and discussed. The results of this study revealed that BTHE was highly influenced by the percentage of the blend; NOx was influenced by the CR.a
Keywords
Karanja methyl ester; Taguchi; Orthogonal array; ANOVA; Signal-noise ratio
Introduction
The depletion of fossil fuel invigorates the researchers to identify the suitable alternate for conventional diesel fuel. Biodiesel usage is rapidly increasing in developing countries as the alternative fuel for a diesel engine [1]. An alternative fuel with neat karanja oil is having major problem in diesel engines due to higher viscosity, which is reduced by the transesterification process [2,3]. Karanja methyl ester gives better results on testing on DI diesel engine in order to determine the performance and emissions [4]. The evaluation of performance such bsfc, bthe and emissions such as CO, HC, NOX and Smoke using karanaja methyl ester on single cylinder diesel engine was investigated [5]. Optimization of control factors of a direct injection single cylinder diesel engine with respect to fuel emissions was evaluated [6]. Researchers evaluated that the performance and emissions using the biodiesel blend and operating conditions such as injection pressure, injection timing and compression ratio [7] influence of biodiesel characteristics was investigated [8]. Determination of engine optimum combination of factors using Taguchi approach was investigated [9]. The effect of biofuel blends on bsfc and emissions are evaluated [10]. Controlled factors varied at two levels and the resulting responses of fuel consumption, emissions of HC, NOX and CO were investigated. Bio-ethanol increases the emissions comparatively pure diesel. Investigation process involves three parameters such as blend proportion, injection timing and injection pressure, a simultaneous optimization method called Taguchi was used [11]. Optimization is a technique through which better results are obtained under certain circumstance [12]. The main objective of this work is to study the individual and combined effects of engine operating parameters on the performance and emission characteristics of the diesel engine employing karanja methyl oil ester biodiesel–diesel blend as fuel using Taguchi approach in order to determine the optimal levels of load, percentage of fuel blend, compression ratio, injection pressure and injection timing and optimal values of BTHE, HC, NOx.
Experimental
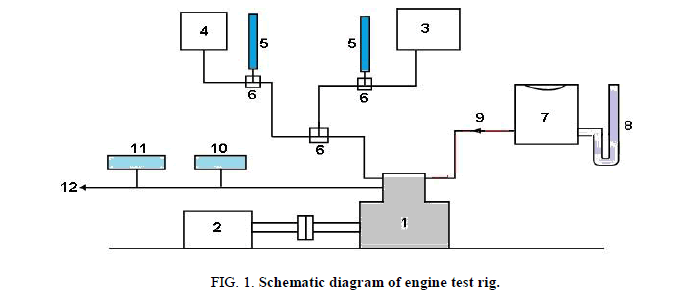
The experimental setup consists of a direct injection single cylinder four-stroke cycle diesel engine, eddy current type dynamometer for loading as shown in Figure 1. The fuel used in this present study was KOME biodiesel. The experiments were carried out by using 10% biodiesel+90% diesel fuel (denoted as B10), 20% biodiesel+80% diesel fuel (denoted as B20), 30% biodiesel+70% diesel fuel (denoted as B30), 40% biodiesel+60% diesel fuel (denoted as B40) at different engine loads from 25% to 100% rated engine load in approximate steps of 25%. The engine was before running with a new fuel, it was endorsed to run for enough time to consume the remaining part of fuel from the earlier experiment.
The engine was started at first with diesel fuel and warmed up. Then, the same tests were performed with biodiesel blends. Three readings were taken at the conditions of the engine to get an average value. When the engine reaches the steady state working condition, fuel consumption is measured. Fuel consumption measured using with the help of a burette (10 ml in volume) and a stopwatch. The change in compression ratio is obtained by adding a various number of gaskets between the head of the cylinder and the cylinder block, this method may not require major modification in the engine setup. In this experimentation process, the number of gaskets increased to the maximum of four gaskets. Injection timing was varied by the number of shims under the place of the mounting flange of the fuel pump. By adding the shims, the injection time was obtained to retardation. The thickness of one shim, placed between engine and fuel pump, is 0.20 mm and adding or removing one shim changes the IT 2°, This process was repeated for five times to get the correct timings in terms of crank angle. By adjusting the nozzle spring tension leads to obtaining the nozzle opening pressure. Nozzle spring preload is altered by tightening the nut above the spring, therefore the nozzle opening pressure increases.
The performance and emission parameters of biodiesel blends (B10, B20, B30 and B40) were determined. Performance parameters namely brake thermal efficiency (BTE) was computed. Similarly, exhaust emissions like unburned hydrocarbon (HC) and oxides of nitrogen (NOx) were measured.
Design of experiment
Design of experiments is a dominant statistical tool for modeling and analyzing the influence of control factors on performance output. The most considerable stage in the design of experiments is selection of the control parameters. An extensive literature review on engine performance and emissions reveal that the parameters such as load, blend, compression ratio and injection pressure and injection time) largely influence the engine performance and emissions characteristics.
Impacts of these five parameters were studied by using an L16 orthogonal array. Processing conditions under which engine was tested are given in Table 1. The five process parameters have four levels. In a full factorial experiment design, it would require 45=1024 combination of runs to study the effect of five parameters each at four levels; Taguchi’s approach is reducing it to only 16 runs, offering a great advantage in terms of experimental cost and time. Experimental observations were further transformed into signal-to-noise (S/N) ratios, which were calculated as a logarithmic transformation of loss function as shown below:
| Engine | Engine four-stroke, single cylinder, constant speed diesel engine |
|---|---|
| Make | Kirloskar |
| Rated power | 3.75 Kw |
| Speed | 1500 rpm |
| Bore | 87.5 mm |
| Stroke | 110 mm |
| Compression ratio | 17.5 |
| Crank angle | Resolution 1 degree |
Table 1. Engine test rig specifications.
Higher is better characteristic:  eqn. (1)
Lower is better characteristic:  eqn. (2)
Where n is the number of observations and y is the observed data. Levels of the process parameters used in the experiment were finalized after thorough brainstorming with I.C. Engine experts and automobile manufacturers and same is presented in Table 2. The designed experiments are shown in Table 3 each column represents a process parameter. The engine was tested with 16 different combinations of parameter levels. Each experiment was repeated for three times.
| Process parameters | Levels | |||
|---|---|---|---|---|
| 1 | 2 | 3 | 4 | |
| Load in Kg (A) | 4 | 8 | 12 | 16 |
| Blend in% (B) | 10 | 20 | 30 | 40 |
| Compression ratio (C) | 17.5 | 17.7 | 17.9 | 18.1 |
| Injection pressure in bar (D) | 160 | 180 | 200 | 220 |
| Injection time in degrees (E) | 23 | 25 | 27 | 29 |
Table 2. Process parameters and their levels.
| Trail no | A | B | C | D | E |
|---|---|---|---|---|---|
| 1 | 4 | 10 | 17.5 | 160 | 23 |
| 2 | 4 | 20 | 17.7 | 180 | 25 |
| 3 | 4 | 30 | 17.9 | 200 | 27 |
| 4 | 4 | 40 | 18.1 | 220 | 29 |
| 5 | 8 | 10 | 17.7 | 200 | 29 |
| 6 | 8 | 20 | 17.5 | 220 | 27 |
| 7 | 8 | 30 | 18.1 | 160 | 25 |
| 8 | 8 | 40 | 17.9 | 180 | 23 |
| 9 | 12 | 10 | 17.9 | 220 | 25 |
| 10 | 12 | 20 | 18.1 | 200 | 23 |
| 11 | 12 | 30 | 17.5 | 180 | 29 |
| 12 | 12 | 40 | 17.7 | 160 | 27 |
| 13 | 16 | 10 | 18.1 | 180 | 27 |
| 14 | 16 | 20 | 17.9 | 160 | 29 |
| 15 | 16 | 30 | 17.7 | 220 | 23 |
| 16 | 16 | 40 | 17.5 | 200 | 25 |
Table 3. Orthogonal array L16.
Results and Discussion
S/N ratio analysis
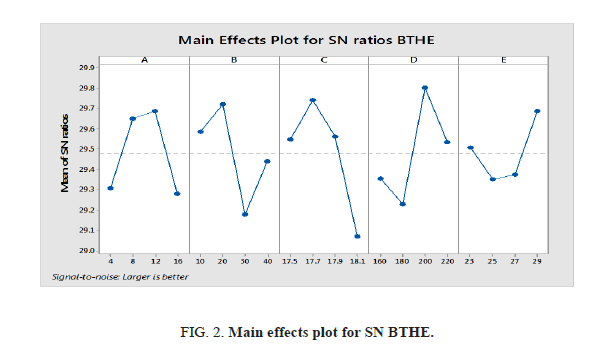
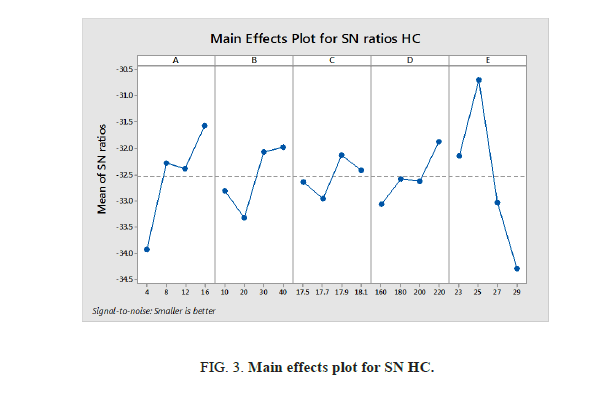
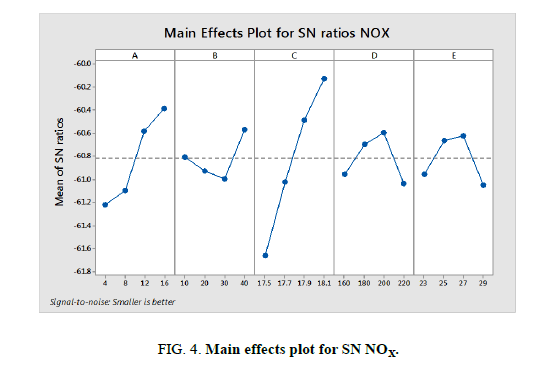
S/N ratios which are expressed on a decibel scale, computed from the quadratic (quality) loss function. The S/N ratios are calculated for each experiment. The term ‘signal’ indicates the mean value and the term ‘noise’ indicate the variance value (undesirable) for the output response of the process. This technique is used to identify the controllable factors that reduce the effect of the uncontrollable (noise) factors on the response. The chosen factors with the highest S/N ratio would give the optimum quality with the least variance. Figure 2 shows the significance level of each parameter. It may be remembered that the highest S/N ratio corresponds to the optimum combination of parameter setting for lowest responses. Thus, for BTHE the peak points of each factor occur at the A (12 Kg), B (20% of blend), C (17.7), D (200 bar) and E (29°). The optimum combination of the lowest HC obtained at A (16 Kg), B (40% of blend), C (17.9), D (220 bar) and E (25°). The optimum combination of the lowest NOX obtained at A (16 Kg), B (40% of blend), C (18.1), D (200 bar) and E (27°).
Setting optimum conditions and prediction of response variables
The next step in DOE analysis is determining optimal conditions of the control parameters to give the optimum responses. In this work the response variables to be optimized were brake thermal efficiency (BTHE) has to be maximized and emissions to be reduced as much as possible. Hence the optimum parameter settings will be those that give maximum values of the BTHE and minimum values of HC and NOx.
The optimum settings of the parameters were achieved from the S/N tables of the control parameters. The optimum value of response variable can be predicted using the additivity law:
 eqn. (3)
where T is the overall mean value of the output response variable for the test runs conducted and Xi – the design and control parameter value for the i level of the parameter X.
Optimal combination of engine performance parameters
The criterion for optimization of the response parameters was based on the Higher the better S/N ratio. The experimental results were substituted in eqn. 3. The optimal engine parameters obtained were A3B2C2D3E4. The value of BTHE is calculated OPT BTHE=Ybar+(Abar3-Ybar)+(Bbar2-Ybar)+(Cbar2-Ybar)+(Dbar3-Ybar)+(Ebar4-Ybar). The value of BTHE is 33.32%. The experimental results were substituted in eqn. 3. The optimal engine parameters for HC obtained A4B4C3D4E2. The value of HC is 121.75 ppm. The experimental results were substituted in eqn. 3. To calculate the S/N ratios for all response variables shown in Figure 2. The optimal engine parameters obtained were A4B4C4D3E3. The value of NOx is 1265.38 ppm (Figures 3 and 4).
Analysis of Variance
Analysis of variance (ANOVA) was performed to identify significant factors in BTHE, BSFC, CO, HC, NOX and SMOKE and the results are shown in Table 4. The purpose of the statistical analysis of variance (ANOVA) is to investigate which process parameter is significantly affecting the quality characteristic. This analysis of variance is carried out for the level of significance 5% (i.e. the level of confidence 95%). It can be observed from Table 4 that the BTHE is significantly influenced by the process parameters CR (36%), IP (35%), Blend (23%) and load (18.10%). In the case of BSFC the CR (88.74%) is greatly influencing, the parameters are insignificant. However, the carbon monoxide is significantly influenced by the load (28.98%), IP (27.71%) and IT (24.36%). It was found that the HC is significantly influencing by the IT (56%) and it was moderately influencing by the load (24.40%). However, for the NOX it can be observed that the IP (61.82%) and load (21.43%) are significant factors. In the case of smoke, the IT (45.06%) is the most significant factor and other factors load and blend followed moderately.
| BTHE | Source | Degree of freedom | Sum of squares | Mean square | F-Ratio | Contribution (%) |
|---|---|---|---|---|---|---|
| A (Load) | 3 | 20.91 | 6.97 | 16.39 | 18.10 | |
| B (Blend) | 3 | 23.31 | 7.77 | 18.27 | 20.17 | |
| C (Compression ratio) | 3 | 33.93 | 11.31 | 26.59 | 29.36 | |
| D (Injection pressure) | 3 | 26.99 | 9 | 21.15 | 23.35 | |
| E (Injection timing) | 3 | 10.41 | 3.47 | 8.16 | 9.01 | |
| Residual | 32 | 13.61 | 0.43 | |||
| Total | 47 | 129.16 | 2.75 | 90.56 | ||
| HC | A (Load) | 3 | 780.56 | 260.19 | 81.63 | 24.40 |
| B (Blend) | 3 | 300.4 | 100.13 | 31.41 | 9.39 | |
| C (Compression ratio) | 3 | 103.4 | 34.47 | 10.81 | 3.23 | |
| D (Injection pressure) | 3 | 195.56 | 65.19 | 20.45 | 6.11 | |
| E (Injection timing) | 3 | 1819.4 | 606.47 | 190.26 | 56.87 | |
| Residual | 32 | 102 | 3.19 | |||
| Total | 47 | 3301.31 | 70.24 | 334.56 | ||
| NOX | A (Load) | 3 | 93271.17 | 31090.39 | 2.52 | 21.43 |
| B (Blend) | 3 | 22333.5 | 7444.5 | 0.6 | 5.10 | |
| C (Compression ratio) | 3 | 268912.33 | 89637.44 | 7.27 | 61.82 | |
| D (Injection pressure) | 3 | 25928.5 | 8642.83 | 0.7 | 5.95 | |
| E (Injection timing) | 3 | 24868.5 | 8289.5 | 0.67 | 5.70 | |
| Residual | 32 | 394544.67 | 12329.52 | |||
| Total | 47 | 829858.67 | 17656.57 | 11.76 |
Table 4. Summarized ANOVA for means of responses, F-ratio and PC.
Confirmative Experiment
The final step in the Taguchi method is confirmation test, once the optimum combination of factors is selected; the average of the results from the confirmation experiment compared with the predicted average based on the factor levels tested. In this study, a confirmation experiment was conducted by considering the optimum combination of factors by using the eqn. 4 and eqn. 5 and tabulated in Table 5.
| Response | Optimal combination of factors | Predicted | Confirmation experiment | ||
|---|---|---|---|---|---|
| Decibels (dB) |
Decibels (dB) | ||||
| BTHE | A3B2C2D3E4 | 34.1% | 30.71 | 30.68% | 29.72 |
| HC | A4B4C3D4E2 | 84.83 Ppm | 28.045 | 78.19 Ppm | 31.62 |
| NOX | A4B4C4D3E3 | 916.14 Ppm | 58.73 | 1070.11 Ppm | 60.31 |
Table 5. Summarized predicted S/N ratio and mean values at optimum level of each factor.
 eqn. (4)
 eqn. (5)
where F (α, 1, fe) is the F–ratio required for 100 (1-α) percent confidence interval; DOFe the degree of freedom (DOF) for error; VARe the error variance, Re the number of replications for the confirmation experiment; Neff the effective number of replications; N is the total number of experiments and DOFT is the total degree of freedom for the estimate of the mean optimum.
Conclusion
The BTHE was highly influenced by the compression ratio and it was followed by injection pressure (IP), blend percentage and load. The hydrocarbon emission was significantly influenced by the injection timing (IT) and the influence of load is comparatively moderate. The nitric oxide (NOx) was highly influenced by the compression ratio (CR). The confirmation test is verified at 95% confidence level and it supports the Taguchi’s approach.
References
- Kaushik N, Mann S, Kumar K. Pongamia pinnata: A Candidate Tree for Biodiesel Feedstock. Energy Sources, Part A: Recovery, Utilization and Environmental Effects. 2015;37(14):1526-33.
- Baiju B, Naik MK, Das LM. A comparative evaluation of compression ignition engine characteristics using methyl and ethyl esters of Karanja oil. Renewable Energy. 2009;34:1616-21.
- Nurun Nabi Md, Najmul Hoque SM, Shamim Akhter Md, et al. Pongamia pinnata biodiesel production in Bangladesh, characterization of karanja biodiesel and its effect on diesel emissions. Fuel Processing Technol. 2009;90:1080-6.
- Nantha Gopal K, Thundil Karupparaj R. Effect of Pongamia biodiesel on emission and combustion characteristics of DI compression ignition engine. Ain Shams Engineering. 2015;6:297-305.
- Raheman H, Phadatare AG. Diesel engine emissions and performance from blends of Karanja methyl ester and diesel. Biomass and Bioenergy. 2004;27:393-7.
- Vincent Wilson H. Optimization of diesel engine parameters using Taguchi method and design of evolution. J Braz Soc of Mech Sci and Eng. 2012;34:423.
- Sivaramakrishnan K, Ravikumar P. Investigation on performance and emissions of a biodiesel engine through optimization techniques. Thermal Science. 2013;17(1):179-93.
- Lesnik L, Vajda B, Zoran Z, et al. The influence of biodiesel fuel on injection characteristics, diesel engine performance and emission formation. Applied Energy. 2013;111:558-70.
- Ganapathy T, Krishnan M. Performance optimization of Jatropha biodiesel engine model using Taguchi approach. Applied Energy. 2009;86:2476-86.
- Millo F, Debnath BK, Vlachos T, et al. Effects of different biofuels blends on performance and emissions 4 of an automotive diesel engine. Fuel. 2015.
- Karthikeyan R, Nallusamy N, Alagumoorthi N, et al. Optimization of engine operating parameters for turpentine mixed diesel fueled di diesel engine using Taguchi method. Modern App Sci. 2010;4(12):182-92.
- Raju G, Rao PV, Ratnam Ch. Optimal design of an I.C. engine cylinder fin arrays using binary coded genetic algorithm.National Conference on Vehicle Dynamics-Andhra University, Visakhapatnam, India. 2003.


