Original Article
, Volume: 13( 2)1H and 13C NMR Investigation of Quinoline Pharmaceutical Derivatives: Interpretation of Chemical Shifts and their Comparison with the Experimental Value
- *Correspondence:
- Zakiyeh Bayat , Department of Chemistry, Quchan Branch, Islamic Azad University, Quchan, Iran, Tel: +989151811750; E-Mail: z.bayat@ymail.com
Received: June 5, 2018; Accepted: June 26, 2018; Published: June 28, 2018
Citation: Z.Bayat, M Shir Mohammadi, and E Mohammadi Nasab. 1H and 13C NMR Investigation of Quinoline Pharmaceutical Derivatives: Interpretation of chemical shifts and their comparison with the experimental value. Phys Chem Ind J. 2018;13(2):122.
Abstract
In this paper, 1H and 13C chemical shift values have been calculated for the optimized structures of the quinoline pharmaceutical derivatives of compounds by theoretically method and compared to the experimental chemical shift values. Theoretically chemical shifts values were determined at GIAO HF/6-31++G(d,p) level of theory by Gaussian 09 program and are fully interpreted. Highest frequency are observed for the nitrogen, Oxygen and chlorine substitutions occurring in ipso carbons and also on nitrogen heteroatom occur at ortho and para positions in heterocyclic carbons and Hydrogen attached to them. The aliphatic Hydrogen at high frequency for the Hydrogen attached on Carbon adjacent to Oxygen, Nitrogen and carbons include double bond. The correlation analysis of the calculation and experimental data was performed in order to quantify the disagreement.
Keywords
NMR; Quinoline; Computational; Comparison; Chemical shift
Introduction
The use of heterocyclic compounds in our lives is irrefutable. So there is a growing request for heterocyclic compounds, and this has incited research activities in the field of heterocyclic compound chemistry. Amongst the wide diversity of heterocyclic compounds, those containing the nitrogen atom are usual in nature, and their biological usage distinguishes them [1]. Quinoline and its derivatives have evermore engrossed both biological and synthetic chemist due to its various pharmacological and chemical attributes [2]. 1,10-Phenanthroline (FIG. 1) has been widely used for decades as a chemically Multipurpose module displaying a good combination of structural and chemical attributes. 1,10-phenanthroline derivatives provided the development of sophisticated synthetic strategies that have yielded fascinating molecular architectures. Remarkable, some of these systems can be designed to work as molecular-level machines. Another capacity of 1,10- phenanthroline is connected to its Flat structure, that prompts intercalation or binding with DNA or RNA [3]. Chloroquine (FIG. 2) was introduced in the 1940s and quickly became the mainstay of treatment and prevention because it was inexpensive and nontoxic and malaria parasites were generally susceptible to it [4]. Cinchocaine (FIG. 3) is a member of a category of drugs known as local anesthetics [5]. Imiquimod (FIG. 4) have been shown to have attributes as immune response modifiers in vitro and in vivo, and display antiviral and antitumor activity via endogenous cytokine production [6]. Nitroxoline (FIG. 5) is an antibiotic, which does not belong to any known antimicrobial class and is used as a urinary antibacterial agent, active against oversensitive Gram-positive and Gram-negative bacterial strains that generally exist in urinary tracts and cause infections [7]. Primaquine (FIG. 6) is the only 8-aminoquinoline which is extensively employed as an antimalarial drug [8]. Proflavine (FIG. 7) is the prototype of DNA-intercalating aminoacridines and is a planar polyaromatic chromophore that is mono-protonated in the physiological situation [9]. Quinine and quinidine, two cinchona alkaloids so freely provided by Nature, are not only important pharmacological drugs,' but their contribution to chemistry certainly deserves respect [10]. Quinine (FIG. 8) and quinidine (FIG. 9) have been used widely in the medical profession as antimalarial and antiarrhythmic drugs, respectively [11]. Tacrine (FIG. 10) is the first factor approved by the Food and Drug Administration for the treatment of Alzheimer's disease and has been extensively employed in the infirmary. Tacrine acts as an acetylcholinesterase inhibitor blocking the degradation of acetylcholine in neurons of the cerebral cortex thereby increasing cholinergic transmission [12]. Of the specific importance of NMR studies has been the use of various multidimensional sequences of NMR programs to define the detailed molecular structure. The standard NMR experiences are enough to obtain a perfect assignment of organic compounds, and efficient to obtain molecular structure information [13]. NMR chemical shifts, however, depend on the electronic environment of the nucleus studied. This gives us the unique leisure to quantify the effect of the packing on the chemical shifts in such a complex system [14]. This Presentation is a theoretical study of NMR magnetic shielding spectra of quinoline pharmaceutical derivatives. Presented here is calculated 13C and 1H isotropic NMR chemical shifts for 1,10-Phenanthroline, Chloroquine, cinchocaine, Imiquimod, Nitroxoline, Primaquine, Proflavine, Quinine, quinidine, and Tacrine. The optimized geometrical parameters of quinoline pharmaceutical derivatives which are calculated by HF methods with 6-31++G(d,p) basis sets are consistent with the atom numbering scheme.1H and 13C chemical shift values have been calculated for the optimized structures of the quinoline pharmaceutical derivatives of compounds and compared to the experimental chemical shift values.

Figure 1: The structure of optimized 1,10 Phenanthroline.

Figure 2: The structure of optimized chloroquine.

Figure 3: The structure of optimized cinchocaine.

Figure 4: The structure of optimized imiquimod.

Figure 5: The structure of optimized Nitroxoline.

Figure 6: The structure of optimized Primaquine.

Figure 7: The structure of optimized Proflavine.

Figure 8: The structure of optimized Quinidine.

Figure 9: The structure of optimized Quinine.

Figure 10: The structure of optimized Tacrine.
Materials and Methods
Ab initio NMR calculations are now attainable and accurate enough to be useful in exploring the relationship between chemical shift and molecular structure. Study on quinoline derivatives the structural formula of the drug. Using the structure molecules were using the software Gauss view drawing. The program Gaussian optimized structures at the beginning of the Gauss view software structure was obtained as a Gaussian input. In general, studies on 10 cases of selected derivatives of quinolines that the computational method ab initio with the level of computational HF calculations with 6-31++G(d,p) basis sets. This basis set was chosen since it had been successfully used in the study of NMR chemical shielding tensors. The term, σ is a second rank tensor called NMR chemical shielding tensor whose elements describe the size of chemical shielding as a function of molecular orientation with respect to the external magnetic field. The isotropic chemical shielding σiso parameters can be related to the principal components by the following equation:
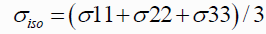
and the chemical shift to note is the Isotropic value. To convert the shifts to ppm subtract the isotropic value from the isotropic chemical shift of the protons in TMS:

Results and Discussion
In this work, we study magnetic properties of atomic nuclei to determine properties of atoms in the titled compound by NMR spectroscopy. Ab initio calculation of nu0063lear magnetic shielding has become an aid for the analysis of molecular structure. So, NMR is based on the quantum mechanical property of nuclei. Based on NMR study, calculated magnetic shielding tensor (σ, ppm), magnetic shielding anisotropy (σaniso ppm), and chemical shift (δ) were calculated. These results are, listed in TABLES 1-20. On the other hand, experimental 13C and 1H NMR data have been extracted from previous research and Along with referrals are presented in TABLES 1-20 too. Experimental and computational data were compared and full explanations were given on NMR shifts. As can be seen in FIG. 1, the molecular structure of the 1, 10-phenanthroline includes tree aromatic ring. It is a heterocyclic compound with five carbon and one nitrogen atoms in the hetero rings. The study of Chloroquine shows 13 different carbon atoms, which is consistent with the structure on the basis of molecular symmetry. It includes two aromatic rings. The molecular structure of the Cinchocaine includes two aromatic ring, the studied molecule shows 20 different carbon atoms, which is consistent with the structure on the basis of molecular symmetry. So the study of Imiquimod shows 14 different carbon atoms, which is consistent with the structure on the basis of molecular symmetry. it includes three aromatic rings. The molecular structure of the Nitroxoline includes two aromatic ring and molecular structure of the Primaquine includes two aromatic ring and the molecular structure of the Proflavine includes tree aromatic ring. it is a heterocyclic compound with 13 carbon, two NH2 and substitutions and one nitrogen atoms in the hetero rings. The molecular structure of the Quinidine includes two aromatic ring and molecular structure of the Quinine includes two aromatic rings. The study of molecule shows 13 different carbon atoms, which is consistent with the structure on the basis of molecular symmetry. The molecular structure of the Tacrine includes two aromatic and one aliphatic rings. Results of all of the compounds show the calculated and experimental values are comparable. There is an excellent agreement between the experimental and theoretical data. We present here the chemical shifts for each compound and we try to present a complete interpretation based on its structure. Let's start with 1, 10-phenanthroline. Chemical shifts of it are given in TABLE 1 and 2.
| Atom | δtheo | δExp | Δδ |
|---|---|---|---|
| 1 | 129.52 | 147.42 | 17.9 |
| 3 | 130.48 | 151.24 | 20.76 |
| 4 | 100.45 | 124.43 | 23.98 |
| 5 | 117.97 | 137.24 | 19.27 |
| 6 | 108.16 | 130.12 | 21.96 |
| 7 | 104.88 | 127.96 | 23.08 |
| 8 | 104.91 | 127.96 | 23.05 |
| 9 | 108.14 | 130.12 | 21.98 |
| 10 | 129.63 | 147.42 | 17.79 |
| 11 | 117.97 | 137.24 | 19.27 |
| 12 | 100.46 | 124.43 | 23.97 |
| 13 | 130.35 | 151.24 | 20.89 |
Table 1: Theoretical and experimental values of chemical shift)13c NMR( and the difference between of 1,10 phenanthroline [15].
| Atom | δtheo | δExp | Δδ |
|---|---|---|---|
| 15,22 | 9.0762 | 9.17 | 0.0938 |
| 17,20 | 8.2974 | 8.45 | 0.1526 |
| 19,18 | 7.62435 | 7.98 | 0.35565 |
| 16,21 | 7.4327 | 7.77 | 0.3373 |
Table 2: Theoretical and experimental values of chemical shift)1H NMR( and the difference between of 1,10 Phenanthroline [15].
| Atom | δtheo | δExp | Δδ |
|---|---|---|---|
| 8 | 138.6032 | 154.8 | 16.1968 |
| 12 | 134.3873 | 142 | 7.6127 |
| 3 | 133.5483 | 138.9 | 5.3517 |
| 1 | 121.2667 | 137.6 | 16.3333 |
| 2 | 109.704 | 126.9 | 17.196 |
| 5 | 107.3318 | 118.5 | 11.1682 |
| 6 | 103.6583 | 123.8 | 20.1417 |
| 4 | 101.777 | 114.6 | 12.823 |
| 11 | 89.2534 | 98.5 | 9.2466 |
| 19 | 30.8767 | 47.1 | 16.2233 |
| 29 | 30.7723 | 51.1 | 20.3277 |
| 42 | 23.2405 | 49.4 | 26.1595 |
| 35 | 18.7263 | 49.4 | 30.6737 |
| 25 | 13.1495 | 31.8 | 18.6505 |
| 26 | 6.3769 | 20.2 | 13.8231 |
| 20 | 2.3083 | 18.6 | 16.2917 |
| 36 | -3.8914 | 8 | 11.8914 |
| 43 | -11.5089 | 8 | 19.5089 |
Table 3: Theoretical and experimental values of chemical shift)13C NMR( and the difference between of chloroquine [16].
| Atom | δtheo | δExp | Δδ |
|---|---|---|---|
| 14 | 8.4867 | 8.1 | -0.3867 |
| 7 | 8.1724 | 7.4 | -0.7724 |
| 9 | 8.0405 | 7.8 | -0.2405 |
| 10 | 7.2674 | 7.3 | 0.0326 |
| 13 | 6.4088 | 6.7 | 0.2912 |
| 21 | 2.5185 | 3.9 | 1.3815 |
| 45 | 2.3429 | 3 | 0.6571 |
| 18 | 1.8943 | 3 | 1.1057 |
| 44,37 | 1.6919 | 3 | 1.3081 |
| 38,45 | 1.6023 | 3 | 1.3977 |
| 33,23 | 1.36795 | 3 | 1.63205 |
| 28 | 1.0591 | 1.7 | 0.6409 |
| 22,23,24 | 0.9238 | 1.1 | 0.1762 |
| 41,31 | 0.8503 | 1.1 | 0.2497 |
| 27 | 0.7654 | 1.1 | 0.3346 |
| 48,40 | 0.62775 | 1.1 | 0.47225 |
| 24,39 | 0.5492 | 1.1 | 0.5508 |
| 47 | 0.36 | 1.1 | 0.74 |
| 46,30 | -0.01655 | 1.1 | 1.11655 |
Table 4: Theoretical and experimental values of chemical shift)1H NMR ( and the difference between of chloroquine [16].
| Atom | δtheo | δExp | Δδ |
|---|---|---|---|
| 30 | 147.3312 | 167 | 19.6688 |
| 13 | 140.3558 | 161.5 | 21.1442 |
| 9 | 132.7935 | 147.2 | 14.4065 |
| 3 | 130.1242 | 145.1 | 14.9758 |
| 1 | 112.5122 | 129.8 | 17.2878 |
| 5 | 108.9804 | 125.3 | 16.3196 |
| 2 | 107.0759 | 127.5 | 20.4241 |
| 6 | 101.823 | 124.5 | 22.677 |
| 4 | 100.0413 | 121.5 | 21.4587 |
| 12 | 89.1233 | 111.2 | 22.0767 |
| 17 | 41.7184 | 65.9 | 24.1816 |
| 35 | 30.3526 | 51.2 | 20.8474 |
| 41 | 26.5909 | 46.6 | 20.0091 |
| 48 | 24.5595 | 46.6 | 22.0405 |
| 34 | 19.8895 | 37.4 | 17.5105 |
| 18 | 11.6443 | 31 | 19.3557 |
| 21 | 0.1684 | 19.3 | 19.1316 |
| 42 | -2.484 | 11.8 | 14.284 |
| 49 | -2.5654 | 11.8 | 14.3654 |
| 24 | -3.3412 | 13.9 | 17.2412 |
Table 5: Theoretical and experimental values of chemical shift)13C NMR( and the difference between of cinchocaine [5].
| Atom | δtheo | δExp | Δδ |
|---|---|---|---|
| 10 | 8.4281 | 8.1 | -0.3281 |
| 8 | 7.9361 | 7.84 | -0.0961 |
| 7 | 7.6519 | 7.63 | -0.0219 |
| 11 | 7.2681 | 7.39 | 0.1219 |
| 14 | 6.6085 | 6.95 | 0.3415 |
| 19, 20 | 3.6027 | 4.47 | 0.8673 |
| 36 | 3.4563 | 3.55 | 0.0937 |
| 38 | 2.4875 | 2.66 | 0.1725 |
| 37 | 2.082 | 3.55 | 1.468 |
| 50 | 1.7692 | 2.54 | 0.7708 |
| 43, 44 | 1.61465 | 2.54 | 0.92535 |
| 51 | 1.4526 | 2.54 | 1.0874 |
| 39 | 1.3442 | 2.66 | 1.3158 |
| 22, 23 | 1.3442 | 1.81 | 0.4658 |
| 54 | 1.1522 | 0.99 | -0.1622 |
| 25,26 | 0.82554 | 1.51 | 0.68446 |
| 27 | 0.82554 | 0.99 | 0.16446 |
| 47,53 | 0.82554 | 0.99 | 0.16446 |
| 46 | 0.7245 | 0.99 | 0.2655 |
| 29,28 | 0.60515 | 0.99 | 0.38485 |
| 52,45 | 0.43865 | 0.99 | 0.55135 |
Table 6: Theoretical and experimental values of chemical shift)1H NMR( and the difference between of Cinchocaine [5].
| Atom | δtheo | δExp | Δδ |
|---|---|---|---|
| 12 | 135.2619 | 148.2 | 12.9381 |
| 4 | 129.821 | 137.13 | 7.309 |
| 16 | 121.3296 | 145.85 | 24.5204 |
| 9 | 116.3767 | 138.74 | 22.3633 |
| 5 | 109.7951 | 124.47 | 14.6749 |
| 6 | 109.0687 | 130.41 | 21.3413 |
| 13 | 106.0072 | 118.89 | 12.8828 |
| 2 | 102.0309 | 121.68 | 19.6491 |
| 1 | 99.7642 | 136.19 | 36.4258 |
| 3 | 93.6592 | 113.34 | 19.6808 |
| 18 | 30.8647 | 60.52 | 29.6553 |
| 19 | 7.4717 | 30.63 | 23.1583 |
| 22 | 0.6284 | 20.07 | 19.4416 |
| 27 | -0.3664 | 20.07 | 20.4364 |
Table 7: Theoretical and experimental values of chemical shift)13C NMR( and the difference between of imiquimod [17].
| Atom | δtheo | δExp | Δδ |
|---|---|---|---|
| 8.33 | 8.0206 | 8.33 | 0.3094 |
| 7.94 | 7.7768 | 7.94 | 0.1632 |
| 7.9 | 7.518 | 7.9 | 0.382 |
| 9.48 | 7.3779 | 9.48 | 2.1021 |
| 7 | 7.145 | 8.05 | 0.905 |
| 33 | 4.8524 | 5 | 0.1476 |
| 34 | 4.2008 | 5 | 0.7992 |
| 20 | 3.9512 | 4.8 | 0.8488 |
| 21 | 3.0832 | 4.8 | 1.7168 |
| 23 | 1.7307 | 2.54 | 0.8093 |
| 24,26 | 0.8805 | 1.23 | 0.3495 |
| 25,28,30 | 0.5252 | 1.23 | 0.7048 |
| 29 | 0.2506 | 1.23 | 0.9794 |
Table 8: Theoretical and experimental values of chemical shift)1H NMR( and the difference between of imiquimod [17].
| Atom | δtheo | δExp | Δδ |
|---|---|---|---|
| 6 | 141.5031 | 159.9 | 18.3969 |
| 9 | 129.4509 | 148.5 | 19.0491 |
| 5 | 118.6535 | 136.7 | 18.0465 |
| 7 | 115.7548 | 131.7 | 15.9452 |
| 2 | 114.3525 | 128.4 | 14.0475 |
| 3 | 113.2211 | 122.0 | 8.7789 |
| 4 | 107.9696 | 124.4 | 16.4304 |
| 8 | 104.2444 | 124.6 | 20.3556 |
| 1 | 81.4541 | 109.4 | 27.9459 |
Table 9: Theoretical and experimental values of chemical shift)13C NMR( and the difference between of Nitroxolin [18].
| Atom | δtheo | δExp | Δδ |
|---|---|---|---|
| 17 | 9.7063 | 9.14 | -0.5663 |
| 16 | 8.9323 | 8.53 | -0.4023 |
| 19 | 8.8514 | 9.025 | 0.1736 |
| 18 | 7.596 | 7.87 | 0.274 |
| 15 | 6.3845 | 7.2 | 0.8155 |
| 20 | 4.5302 | 4.93 | 0.4 |
Table 10: Theoretical and experimental values of chemical shift)1H NMR( and the difference between of Nitroxolin [18].
| Atom | δtheo | δExp | Δδ |
|---|---|---|---|
| 13 | 137.0734 | 159.6 | 22.5266 |
| 10 | 132.1573 | 145.2 | 13.0427 |
| 5 | 126.219 | 144.3 | 18.081 |
| 4 | 121.1624 | 135.5 | 14.3376 |
| 2 | 118.2818 | 134.8 | 16.5182 |
| 3 | 112.4115 | 130 | 17.5885 |
| 1 | 100.4469 | 121.8 | 21.3531 |
| 12 | 91.5396 | 98.9 | 7.3604 |
| 9 | 87.3098 | 91.9 | 4.5902 |
| 19 | 37.8414 | 55.2 | 17.3586 |
| 23 | 27.2771 | 48.1 | 20.8229 |
| 33 | 21.541 | 41.7 | 20.159 |
| 29 | 13.9052 | 34.1 | 20.1948 |
| 30 | 10.5073 | 29.3 | 18.7927 |
| 25 | 2.0535 | 20.5 | 18.4465 |
Table 11: Theoretical and experimental values of chemical shift)1c NMR( and the difference between of Primaquine [8].
| Atom | δtheo | δExp | Δδ |
|---|---|---|---|
| 11 | 8.6757 | 8.45 | -0.2257 |
| 8 | 8.0959 | 7.8 | -0.2959 |
| 7 | 7.2151 | 7.15 | -0.0651 |
| 6 | 6.8982 | 6.25 | -0.6482 |
| 14 | 6.5108 | 6.25 | -0.2608 |
| 24 | 4.2927 | 3.5 | -0.7927 |
| 21 | 3.5456 | 3.75 | 0.2044 |
| 20 | 3.1717 | 3.75 | 0.5783 |
| 22 | 2.9055 | 3.75 | 0.8445 |
| 17 | 1.8816 | 6 | 4.1184 |
| 36 | 1.8816 | 2.55 | 0.6684 |
| 37 | 1.5463 | 2.55 | 1.0037 |
| 28 | 1.4396 | 1.2 | -0.2396 |
| 27 | 0.9474 | 1.2 | 0.2526 |
| 31 | 0.76985 | 1.6 | 0.83015 |
| 34 | 0.76985 | 1.5 | 0.73015 |
| 35 | 0.6117 | 1.5 | 0.8883 |
| 26 | 0.2443 | 1.2 | 0.9557 |
| 32 | 0.2443 | 1.6 | 1.3557 |
| 40 | -0.0197 | 1.8 | 1.8197 |
| 39 | -0.4114 | 1.8 | 2.2114 |
Table 12: Theoretical and experimental values of chemical shift)1H NMR( and the difference between of Primaquine [8].
| Atom | δtheo | δExp | Δδ |
|---|---|---|---|
| 5,9 | 136.7097 | 149.66 | 12.9503 |
| 14,1 | 131.5815 | 140.85 | 9.2685 |
| 7 | 121.625 | 134.87 | 13.245 |
| 12 | 113.5437 | 128.59 | 15.0463 |
| 3 | 113.4859 | 128.59 | 15.1041 |
| 8,4 | 96.93065 | 122.47 | 25.53935 |
| 2,13 | 94.6209 | 121.00 | 26.3791 |
| 15 | 84.3246 | 115.13 | 30.8054 |
| 6 | 84.1013 | 115.13 | 31.0287 |
Table 13: Theoretical and experimental values of chemical shift)13c NMR( and the difference between of proflavine [19].
| Atom | δtheo | δExp | Δδ |
|---|---|---|---|
| 20 | 8.5304 | 8.731 | 0.2006 |
| 18,23 | 7.7528 | 7.811 | 0.0582 |
| 19,25 | 7.1074 | 6.78 | -0.3274 |
| 17,24 | 6.63095 | 7.019 | 0.38805 |
| 21,26 | 3.1124 | 7.2 | 4.0876 |
| 22,27 | 2.7359 | 7.2 | 4.4641 |
Table 14: Theoretical and experimental values of chemical shift)1H NMR( and the difference between of Proflavine[19].
| Atom | δtheo | δExp | Δδ |
|---|---|---|---|
| 33 | 8.5971 | 8.474 | -0.1231 |
| 29 | 8.4089 | 7.864 | -0.5449 |
| 34 | 7.5363 | 7.495 | -0.0413 |
| 27 | 7.3471 | 7.113 | -0.2341 |
| 28 | 7.1686 | 7.213 | 0.0444 |
| 42 | 6.4429 | 6.065 | -0.3779 |
| 35 | 4.9705 | 5.593 | 0.6225 |
| 44 | 4.8888 | 5.45 | 0.5612 |
| 43 | 4.7923 | 5.04 | 0.2477 |
| 31 | 3.6708 | 3.788 | 0.1172 |
| 30,32 | 3.24495 | 3.788 | 0.54305 |
| 41 | 2.9419 | 3.404 | 0.4621 |
| 48 | 2.2943 | 2.969 | 0.6747 |
| 40 | 2.2229 | 2.87 | 0.6471 |
| 47 | 2.0596 | 2.84 | 0.7804 |
| 24 | 1.982 | 2.711 | 0.729 |
| 37 | 1.7031 | 2.206 | 0.5029 |
| 39 | 1.3917 | 2.07 | 0.6783 |
| 23,45 | 0.8213 | 1.73 | 0.9087 |
| 46 | 152.889 | 1.039 | -151.85 |
Table 15: Theoretical and experimental values of chemical shift)13C NMR( and the difference between of Quinidine [20].
| Atom | δtheo | δExp | Δδ |
|---|---|---|---|
| 33 | 8.5971 | 8.474 | -0.1231 |
| 29 | 8.4089 | 7.864 | -0.5449 |
| 34 | 7.5363 | 7.495 | -0.0413 |
| 27 | 7.3471 | 7.113 | -0.2341 |
| 28 | 7.1686 | 7.213 | 0.0444 |
| 42 | 6.4429 | 6.065 | -0.3779 |
| 35 | 4.9705 | 5.593 | 0.6225 |
| 44 | 4.8888 | 5.45 | 0.5612 |
| 43 | 4.7923 | 5.04 | 0.2477 |
| 31 | 3.6708 | 3.788 | 0.1172 |
| 30,32 | 3.24495 | 3.788 | 0.54305 |
| 41 | 2.9419 | 3.404 | 0.4621 |
| 48 | 2.2943 | 2.969 | 0.6747 |
| 40 | 2.2229 | 2.87 | 0.6471 |
| 47 | 2.0596 | 2.84 | 0.7804 |
| 24 | 1.982 | 2.711 | 0.729 |
| 37 | 1.7031 | 2.206 | 0.5029 |
| 39 | 1.3917 | 2.07 | 0.6783 |
| 23,45 | 0.8213 | 1.73 | 0.9087 |
| 46 | 152.889 | 1.039 | -151.85 |
Table 16: Theoretical and experimental values of chemical shift)1H NMR( and the difference between of Quinidine[20].
| Atom | δtheo | δExp | Δδ |
|---|---|---|---|
| 1,10 | 133.3377 | 157.7 | 24.36235 |
| 8 | 128.0208 | 147.3 | 19.2792 |
| 4 | 125.4435 | 143.8 | 18.3565 |
| 24 | 123.3287 | 141.7 | 18.3713 |
| 3 | 114.7397 | 131.2 | 16.4603 |
| 5 | 108.7657 | 126.2 | 17.4343 |
| 9 | 99.8936 | 118.5 | 18.6064 |
| 2 | 93.9553 | 121.4 | 27.4447 |
| 25 | 92.4771 | 114.4 | 21.9229 |
| 6 | 90.4357 | 101.3 | 10.8643 |
| 13 | 57.0937 | 71.52 | 14.4263 |
| 15 | 37.9491 | 59.94 | 21.9909 |
| 12 | 29.7441 | 56.6 | 26.8559 |
| 23 | 26.0446 | 56.9 | 30.8554 |
| 22 | 25.9823 | 43.24 | 17.2577 |
| 20 | 20.4145 | 39.85 | 19.4355 |
| 19 | 8.724 | 27.83 | 19.106 |
| 21 | 6.8739 | 27.49 | 20.6161 |
| 17 | 1.2289 | 21.48 | 20.2511 |
Table 17: Theoretical and experimental values of chemical shift)13C NMR( and the difference between of Quinine [21].
| Atom | δtheo | δExp | Δδ |
|---|---|---|---|
| 29 | 8.5036 | 8.67 | 0.1664 |
| 27,28 | 8.39215 | 7.82 | -0.57215 |
| 26 | 7.2142 | 7.38 | 0.1658 |
| 30 | 7.0167 | 7.5 | 0.4833 |
| 46 | 6.4852 | 5.86 | -0.6252 |
| 48 | 4.9213 | 5 | 0.0787 |
| 47 | 4.8505 | 5 | 0.1495 |
| 34 | 4.7449 | 5.24 | 0.4951 |
| 31 | 3.6896 | 3.89 | 0.2004 |
| 32,33 | 3.2389 | 3.89 | 0.6511 |
| 44 | 2.8285 | 2.85 | 0.0215 |
| 42,45 | 2.19835 | 3.19 | 0.99165 |
| 36 | 2.0644 | 1.64 | -0.4244 |
| 43 | 2.0093 | 2.43 | 0.4207 |
| 18 | 1.7185 | 3.05 | 1.3315 |
| 39 | 1.3932 | 2.19 | 0.7968 |
| 38 | 0.8956 | 1.72 | 0.8244 |
| 40 | 0.7941 | 1.72 | 0.9259 |
| 35,41 | 0.71795 | 1.72 | 1.00205 |
| 37 | 152.7406 | 1.64 | -151.101 |
Table 18: Theoretical and experimental values of chemical shift)1H NMR( and the difference between of Quinine [21].
| Atom | δtheo | δExp | Δδ |
|---|---|---|---|
| 4 | 145.7461 | 157 | 11.2539 |
| 8 | 131.007 | 152 | 20.993 |
| 7 | 128.8446 | 138 | 9.1554 |
| 14 | 111.1168 | 136 | 24.8832 |
| 13 | 109.4853 | 129 | 19.5147 |
| 10 | 102.0501 | 124 | 21.94995 |
| 12 | 102.0501 | 116 | 13.94995 |
| 9 | 97.7301 | 120 | 22.2699 |
| 3 | 87.8941 | 115 | 27.1059 |
| 5 | 11.7331 | 32 | 20.2669 |
| 2 | 1.1847 | 26 | 24.8153 |
| 1 | 0.9807 | 24 | 23.0193 |
| 6 | -0.6916 | 23 | 23.6916 |
Table 19: Theoretical and experimental values of chemical shift)13C NMR( and the difference between of Tacrine [22].
| Atom | δtheo | δExp | Δδ |
|---|---|---|---|
| 21 | 8.0924 | 7.5 | -0.5924 |
| 11 | 7.6334 | 7.2 | -0.4334 |
| 20 | 7.5626 | 7.2 | -0.3626 |
| 19 | 7.2678 | 6.75 | -0.5178 |
| 28 | 3.3913 | 4.9 | 1.5087 |
| 27 | 3.1576 | 4.9 | 1.7424 |
| 17 | 2.5144 | 2.3 | -0.2144 |
| 25 | 2.1965 | 2.3 | 0.1035 |
| 16 | 2.0933 | 1.9 | -0.1933 |
| 22 | 1.9699 | 1.9 | -0.0699 |
| 15,18 | 1.4176 | 1.7 | 0.2824 |
| 24 | 1.1499 | 1.7 | 0.5501 |
| 23 | 1.0093 | 1.7 | 0.6907 |
Table 20: Theoretical and experimental values of chemical shift)1H NMR( and the difference between of Tacrine[22].
The aromatic carbon in 13C NMR spectra usually locates in the range of 110–135 ppm. As a rule, Ortho-carbon chemical shifts (C1=147.42, C3=151.24, C10=147.42, C13=151.24) oxygen and nitrogen containing rings is further to the left than Meta carbon chemical shifts (C4=124.43, C6=130.12, C9=130.12, C12=124.43) due to Ortho-carbon lower electron density Caused by the high electro-negative of N heteroatom. data for all 12 aromatic carbons for which experimental data are available. It can be seen that the calculated results are comparable. There is excellent agreement with the experimental data. Even though all of the carbons are aromatic, the range of 006Eearly 100 ppm is about half of the total 13C NMR chemical shift range. The prediction of chemical shifts to this accuracy is remarkable, considering that solvent effects were not considered.it can be seen that the aromatic carbons at highest frequency are those in the range of 130-152 ppm for the ortho and para of the N heteroatom (C1, C3, C10, C13, C11 and C5) Calculated results for all carbons are greater by averages of 20 ppm if polarization functions are included. There are also clear trends in the calculated 13C NMR chemical shifts. All of the 13C NMR chemical shifts in TABLE 1 for the Theoretical shift are lesser than those experimental data. calculations underestimate the 13C NMR chemical shifts at ortho and para carbons of N heteroatom.
As in TABLE 2, the presence of four peaks in 1H NMR spectra suggests that there are four distinct types of protons in 1, 10-phenanthroline. Normally, the protons on phenyl ring are expected to yield NMR signals in the 1H NMR range of 6–8 ppm. The electronegative property of the N heteroatom causes a decrease in shielding constants around the ortho protons connected to C3 and C13. The calculated chemical shifts of 9.0762 ppm are ascribed to these two hydrogen atoms. Para protons connected to C5 and C11 behave similarly. The calculated chemical shifts of 8.2974 ppm are ascribed to these two hydrogen atoms. The second drug we are examining is Chloroquine. Chemical shifts of it are given in TABLE 3 and 4.
One of Chloroquine`s (FIG. 2 ) rings includes nitrogen atom which shows the electronegative property. On the other side, nitrogen atom substitute shows more electronegative property than chloride atom substitute. Therefore, it can be seen that the aromatic carbons at highest frequency are those in the range of 142-155 ppm for the ipso and meta (C1, C3, C8, and C12) carbons of the NH group. Also, it can be seen that the aliphatic carbons at highest frequency are those in the range of 49-48 ppm for the attached (C19, C29, C35, and C42) carbons of the N atoms. data for all nine aromatic carbons for which experimental data are available. It can be seen that the calculated results are comparable. There is excellent agreement with the experimental data. Even though all of the carbons are aromatic, the range of nearly 100 ppm is about half of the total 13C NMR chemical shift range. The prediction of chemical shifts to this accuracy is remarkable, considering that solvent effects were not considered.it can be seen that the aromatic carbons at highest frequency are those in the range of 130-160 ppm for the ortho and para of the N heteroatom (C3, C8, and C12) and ipso of Subordinate (C1) carbons. Calculated results for all carbons are greater by averages of 20 ppm if polarization functions are included. There are also clear trends in the calculated 13C NMR chemical shifts. All of the 13C NMR chemical shifts in TABLE 3 for the Theoretical shift are lesser than those experimental data. calculations underestimate the 13C NMR chemical shifts at ortho and para carbons of N heteroatom and the shifts for ipso carbons.
The methyl and methylene protons of –NH–CH2–CH3 group in Chloroquine showed signals at 3.9 ppm and 1.1 ppm (H21, H22, H23, H32 and H24, Respectively) integrating for three and two protons respectively in its 1H NMR spectra. A broad signal at 3.7273 ppm was observed for the – NH– proton of the amino moiety. Presence of singlets at 3.0 ppm and 1.1 ppm integrating for two protons in 1H NMR of N(CH2-CH3)2 (H37, H38, H44, H45 and H39, H40, H41, H46, H47, H48 respectively). The electronegative property of the N heteroatom causes a decrease in shielding constants around the ortho protons connected to C12. The calculated chemical shifts of 8.4867 ppm are attributed to this hydrogen atom. In this study the third drug is Cinchocaine. Chemical shifts of it are given in TABLE 5 and 6.
The structure of cinchocaine (FIG. 3) shows one of two rings include nitrogen atom which has electronegative property. In TABLE 5 it can be seen that the signal at 145.1 ppm is assigned to the C3 on account of the strong electronegative property of the N hetero atom. data for all 13 aromatic carbons for which experimental data are available. It can be seen that the calculated results are comparable. There is excellent agreement with the experimental data. Even though all of the carbons are aromatic, the range of nearly 100 ppm is about half of the total 13C NMR chemical shift range. The prediction of chemical shifts to this accuracy is remarkable, considering that solvent effects were not considered. There are also clear trends in the calculated 13C NMR chemical shifts. All of the 13C NMR chemical shifts in TABLE 5 for the Theoretical shift are lesser than those experimental data. calculations underestimate the 13C NMR chemical shifts at ortho and para carbons of N hetero atom. The carbon of (C=O) group shows the highest chemical shifts, due to carbon lower electron density Caused by the high electro-negative of (=O) and (N-H) attached groups. Also, it can be seen that the aliphatic carbons at high frequency are those in the range of 37- 66 ppm for the attached carbons of the N-H (C34), N(35, 41, 48) and O (C17) atoms.
In TABLE 6 it can be seen that the aliphatic Hydrogen at high frequency for the Hydrogen attached to carbon connected to Oxygen atom (C17) and N atoms (C34 and C35). Normally, the protons on phenyl ring are expected to yield NMR signals in the δHrange of 6–8 ppm. Unlike the frequency calculations, the basis set effect is rather significant for chemical shifts. The correlation analysis of the calculation and experimental data was performed in order to quantify the disagreement, and the result is listed in TABLE 5 and 6. 1H and 13C chemical shift values have been calculated for the optimized structures of the Cinchocaine compound and compared to the experimental chemical shift values. The fourth drug that was studied was Imiquimod. Chemical shifts of it are given in TABLE 7 and 8.
These rings include nitrogen atom which shows the electronegative property. On the other side, NH2 substitute shows the more electronegative property. In FIG. 4 it can be seen that the aromatic carbons at highest frequency are those in the range of 138-149 ppm for the Ipso and Meta (C4, C9, and C12) carbons of the aminopyrimidines and C16 in imidazole ring. Also, it can be seen that the aliphatic carbons at highest frequency are those in the 60.52 ppm for the Attached (C18) carbons to Nitrogen atom. Even though all of the carbons are aromatic, the range of nearly 100 ppm is about half of the total 13C NMR chemical shift range. The prediction of chemical shifts to this accuracy is remarkable, considering that solvent effects were not considered.it can be seen that the aromatic carbons at highest frequency are those in the range of 130-150 ppm for the ortho and para of the N hetero atom (C4, C12, C16 and C9). Calculated results for all carbons are greater by averages of 20 ppm if polarization functions are included. There are also clear trends in the calculated 13C NMR chemical shifts. All of the 13C NMR chemical shifts in TABLE 7 for the Theoretical shift are lesser than those experimental data. calculations underestimate the 13C NMR chemical shifts at ortho and para carbons of N hetero atom.
The methyl and methylene protons of –N–CH2–CH-CH3 group in Imiquimod showed signals at 4.8 ppm, 2.54 ppm and 1.23 ppm (H20, H21, H23 and H24, H25, H26, H28, H29, H30 Respectively) integrating for two, one and six protons respectively in its 1H NMR spectra. The electronegative property of the N heteroatoms causes a decrease in shielding constants around the protons connected to C12 in the imidazole ring (FIG. 4). The fifth drug we are examining is Nitroxoline. Chemical shifts of it are given in TABLE 9 and 10.
Nitroxoline: the studied molecule shows nine different carbon atoms (FIG. 5), which is consistent with the structure on the basis of molecular symmetry. Due to that fact, nine peaks were observed in 13C NMR spectrum.[19] One of two rings includes nitrogen atom which shows the electronegative property. The aromatic carbon in 13C NMR spectra usually locates in the δC range of 110–135 ppm. Due to the conjugation arising from the phenyl ring and the lone-pair electron of an oxygen atom, the signal at 159.9 ppm is assigned to the C6 with high electron density. Equally, the signal at 148.5 and 136.7 ppm is assigned to the C9 and C5 respectively on account of the strong electronegative property of the N hetero atom. Since C1 is located in the meta-position to the NO2, C4 and C8 are located in the meta-position to the N hetero atom, the induction effect is strong. Thus, the peaks at 109.4 ppm, 124.4 ppm, and 124.6 ppm are assigned to C1, C4, and C8, respectively, due to their lower electron density. The relatively high chemical shifts at 129.9 ppm and 129.4 ppm are ascribed to C3 and C5, respectively. Since C3 is Attachment to the NO2. Thus, the peaks at 122.0 ppm are assigned to C2, due to their lower electron density. The relatively high chemical shift at 131.7 ppm is ascribed to C7. Data for all nine aromatic carbons for which experimental data are available. Even though all of the carbons are aromatic, the range of nearly 100 ppm is about half of the total 13C NMR chemical shift range. It can be seen that the aromatic carbons at highest frequency are those in the range of 130-160 ppm for the ortho and para of the N hetero atom (C5, C7, and C9) and ipso of OH Subordinate (C6) carbons. Calculated results for all carbons are greater by averages of 20 ppm if polarization functions are included. There are also clear trends in the calculated 13C NMR chemical shifts. All of the 13C NMR chemical shifts in TABLE 9 for the Theoretical shift are lesser than those experimental data. calculations underestimate the 13C NMR chemical shifts at ortho and para carbons of N hetero atom and overestimate the shifts for ipso carbons.
As in TABLE 10, the presence of other six peaks in 1H NMR spectra suggests that there are six distinct types of protons in Nitroxoline. Normally, the protons on phenyl ring are expected to yield NMR signals in the δHrange of 6–8 ppm. The substitution of the proton for NO2 and nitrogen atom in ring changes the chemical environment of the remaining aryl protons. The strong electronegative property of the N heteroatom and More than that NO2 substitution causes a decrease in shielding constants around the meta-protons connected to C8 and C1 (FIG. 5). The calculated chemical shifts of 7.596 ppm and 6.3845 ppm are attributed to this two hydrogen atom. Unlike the frequency calculations, the basis set effect is rather significant for chemical shifts. The correlation analysis of the calculation and experimental data was performed in order to quantify the disagreement, and the result is listed in TABLE 9 and 10. 1H and 13C chemical shift values have been calculated for the optimized structures of the Nitroxoline compound and compared to the experimental chemical shift values. In this study the sixth drug is Primaquine. Chemical shifts of it are given in TABLE 11 and 12.
As in TABLE 11, the studied molecule (FIG. 6) shows 15 different carbon atoms, which is consistent with the structure on the basis of molecular symmetry. Due to that fact, nine peaks are observed in 13C NMR spectrum. One of two rings includes nitrogen atom which shows the electronegative property. On the other side, NH substitute shows the more electronegative property. The aromatic carbon in 13C NMR spectra usually locates in the δC range of 110–135 ppm. Due to the conjugation arising from the phenyl ring and the lone-pair electron of an oxygen atom, the signal at 159.9 ppm is assigned to the C13 with high electron density. also In TABLE 1 it can be seen that the aromatic carbons at high frequency are those in the range of 130-146 ppm for the ipso (C10=145.2)and meta (C3= 130) carbons of the NH2 groups and the signal at 135.5 and 144.8 ppm is assigned to the C4 (135.5) and C5 (144.3) respectively on account of the strong electronegative property of the N heteroatom. data for all 13 aromatic carbons for which experimental data are available. It can be seen that the calculated results are comparable. There is excellent agreement with the experimental data. Even though all of the carbons are aromatic, the range of nearly 100 ppm is about half of the total 13C NMR chemical shift range. The prediction of chemical shifts to this accuracy is remarkable, considering that solvent effects were not considered. There are also clear trends in the calculated 13C NMR chemical shifts. All of the 13C NMR chemical shifts in TABLE 11 for the Theoretical shift are lesser than those experimental data. calculations underestimate the 13C NMR chemical shifts at ortho and para carbons of N hetero atom and oVerestimate the shifts for ipso carbons. Also, it can be seen that the aliphatic carbons at highest frequency are those in the range of 40-49 ppm for the attached (C23 and C33) carbons of the N atoms.
The methyl and methylene protons of –NH–CH2(CH3)–CH2-CH2-CH2-NH2 group in Primaquine showed signals in the δH range of 1.2-3.5 ppm. In TABLE 12 it can be seen that the aliphatic Hydrogen at high frequency for the Hydrogen attached on carbons connected to the NH and NH2 groups on account of the strong electronegative property of the N atom. A broad signal at 6 and 1.8 ppm was observed for the –NH– and –NH2- protons respectively. Normally, the protons on phenyl ring are expected to yield NMR signals in the δH range of 6–8 ppm. The electronegative property of the N heteroatom causes a decrease in shielding constants around the ortho protons connected to C5 (FIG. 6). The calculated chemical shifts of 8.6757 ppm are attributed to this hydrogen atom. Unlike the frequency calculations, the basis set effect is rather significant for chemical shifts. The Seventh drug that was studied was Proflavine (FIG. 7). Chemical shifts of it are given in TABLE 13 and 14.
As a rule, Ortho (C9 and C5 =149.66) and para (C7= 134.87) carbon chemical shifts oxygen and nitrogen-containing rings are further to the left than Meta carbon chemical shifts (C4 and C8=122.47) due to Ortho-carbon lower electron density Caused by the high electro-negative of N hetero atom also in TABLE 13 it can be seen that the aromatic carbons at high frequency are those in the range of 128-141 ppm for the ipso (C1 and C14=140.85) and meta (C12 and C3= 128.59) carbons of the NH2 groups. data for all nine aromatic carbons for which experimental data are available. It can be seen that the calculated results are comparable. There is excellent agreement with the experimental data. Even though all of the carbons are aromatic, the range of nearly 100 ppm is about half of the total 13C NMR chemical shift range Calculated results for all carbons are greater by averages of 20 ppm, if polarization functions are included. There are also clear trends in the calculated 13C NMR chemical shifts. All of the 13C NMR chemical shifts in TABLE 13 for the Theoretical shift are lesser than those experimental data. calculations underestimate the 13C NMR chemical shifts at ortho and para carbons of N hetero atom and the shifts for ipso carbons.
Regularly, the protons on the aromatic ring are expected to yield NMR signals in the δHrange of 6–8 ppm. The substitution of the proton for NH2 and the presence of nitrogen hetero atom in the ring changes the chemical environment of the remaining aryl protons and consequently protons chemical shift (TABLE 14). The presence of other six peaks in 1H NMR spectra suggests that there are six distinct types of protons in Proflavine. The Eighth drug we are examining is Quinidine. Chemical shifts of it are given in TABLE 15 and 16.
As in TABLE 15, the studied molecule (FIG. 8) shows 19 different carbon atoms, which is consistent with the structure on the basis of molecular symmetry. Due to that fact, 19 peaks are observed in 13C NMR spectrum. One of two rings includes nitrogen atom which shows the electronegative property. The aromatic carbon in 13C NMR spectra usually locates in the δC range of 110–135 ppm. Due to the conjugation arising from the phenyl ring and the lone-pair electron of an oxygen atom, the signal at 157.55 and 147.11 ppm is assigned to the C1 and C10 respectively with high electron density. Also in TABLE 15, it can be seen that the signal at 148.69 and 143.66 ppm is assigned to the C10 and C1 respectively on account of the strong electronegative property of the N hetero atom. data for all 13 aromatic carbons for which experimental data are available. It can be seen that the calculated results are comparable. There is excellent agreement with the experimental data. Even though all of the carbons are aromatic, the range of nearly 100 ppm is about half of the total 13C NMR chemical shift range. The prediction of chemical shifts to this accuracy is remarkable, considering that solvent effects were not considered. There are also clear trends in the calculated 13C NMR chemical shifts. All of the 13C NMR chemical shifts in TABLE 15 for the Theoretical shift are lesser than those experimental data. calculations underestimate the 13C NMR chemical shifts at ortho and para carbons of N hetero atom. In general, the terminal =CH2 group absorbs (C22=114.44) to the right relative to an internal =CH- group (C21=140.78), Also it can be seen that the aliphatic carbons at highest frequency are those in the range of 43-72 ppm for the attached carbons of the N(C14, C20, and C26) and O (C8 and C13) atoms.
In TABLE 16 it can be seen that the aliphatic Hydrogen at high frequency for the Hydrogen attached on carbons include double bond (C21 and C22). Also, Hydrogen attached to carbon connected to Oxygen atom (C8) showed a chemical shift at 3.778. Normally, the protons on phenyl ring are expected to yield NMR signals in the δHrange of 6–8 ppm. The electronegative property of the N heteroatom causes a decrease in shielding constants around the ortho protons connected to C10 (FIG. 8). The calculated chemical shifts of 8.474 ppm are attributed to this hydrogen atom. Unlike the frequency calculations, the basis set effect is rather significant for chemical shifts. In this study the ninth drug is Quinine. Chemical shifts of it are given in TABLE 17 and 18.
As in TABLE 17, the studied molecule (FIG. 9) shows 19 different carbon atoms, which is consistent with the structure on the basis of molecular symmetry. Due to that fact, 19 peaks are observed in 13C NMR spectrum. One of two rings includes nitrogen atom which shows the electronegative property. The aromatic carbon in 13C NMR spectra usually locates in the δC range of 110–135ppm. Due to the conjugation arising from the phenyl ring and the lone-pair electron of an oxygen atom, the signal at 157.7 ppm is assigned to the C1 and C10 with high electron density. Also in TABLE 17, it can be seen that the signal at 143.8 and 147.3 ppm is assigned to the C4 and C8 respectively on account of the strong electronegative property of the N hetero atom. data for all 13 aromatic carbons for which experimental data are available. It can be seen that the calculated results are comparable. There is excellent agreement with the experimental data. Even though all of the carbons are aromatic, the range of nearly 100 ppm is about half of the total 13C NMR chemical shift range. The prediction of chemical shifts to this accuracy is remarkable, considering that solvent effects were not considered. There are also clear trends in the calculated 13C NMR chemical shifts. All of the 13C NMR chemical shifts in TABLE 1 for Theoretical shift are lesser than those experimental data. calculations underestimate the 13C NMR chemical shifts at ortho and para carbons of N hetero atom. In general, the terminal =CH2 group absorbs (C25=114.4) to the right relative to an internal =CH- group (C24=141.7), Also it can be seen that the aliphatic carbons at highest frequency are those in the range of 43-72 ppm for the attached carbons of the N(C21, C22, and C23) and O (C12) atoms.
In TABLE 18 it can be seen that the aliphatic Hydrogen at high frequency for the Hydrogen attached on carbons include double bond (C24 and C25). Also, Hydrogen attached to carbon connected to Oxygen atom (C12) showed a chemical shift at 3.89. Normally, the protons on phenyl ring are expected to yield NMR signals in the δHrange of 6–8 ppm. The electronegative property of the N heteroatom causes a decrease in shielding constants around the ortho protons connected to C8 (FIG. 9). The calculated chemical shifts of 8.5036 ppm are attributed to this hydrogen atom. Unlike the frequency calculations, the basis set effect is rather significant for chemical shifts. The correlation analysis of the calculation and experimental data was performed in order to quantify the disagreement, and the result is listed in TABLE 17 and 18. 1H and 13C chemical shift values have been calculated for the optimized structures of the Quinine compound and compared to the experimental chemical shift values. The last drug we studied is Tacrine. Chemical shifts of it are given in TABLE 19 and 20.
These rings include nitrogen atom which shows the electronegative property. On the other side, NH2 substitute shows the more electronegative property. In TABLE 19 it can be seen that the aromatic carbons at highest frequency are those in the range of 138-157 ppm for the Ipso and Meta (C4, C9, and C12) carbons of the aminopyrimidines and C16 in imidazole ring. Also, it can be seen that the aliphatic carbons at highest frequency are those in the 60.52 ppm for the Attached (C18) carbons to Nitrogen atom. data for all 13 aromatic carbons for which experimental data are available. It can be seen that the calculated results are comparable [23]. There is excellent agreement with the experimental data. Even though all of the carbons are aromatic, the range of nearly 100 ppm is about half of the total 13C NMR chemical shift range. The prediction of chemical shifts to this accuracy is remarkable, considering that solvent effects were not considered. It can be seen that the aromatic carbons at highest frequency are those in the range of 130-150 ppm for the ortho and para of the N hetero atom (C4, C7, and C8). Calculated results for all carbons are greater by averages of 20 ppm if polarization functions are included. There are also clear trends in the calculated 13C NMR chemical shifts. All of the 13C NMR chemical shifts in TABLE 19 for the Theoretical shift are lesser than those experimental data. calculations underestimate the 13C NMR chemical shifts at ortho and para carbons of N hetero atom.
The methylene protons of Ar–(CH2)4-Ar group in Tacrine showed at 2.3 ppm, 1.9 ppm and 1.7 ppm (H17, H25, H16, H22 and H15, H18, H23, H24 Respectively) integrating for two, two and three protons respectively in its 1H NMR spectra. The electronegative property of the N heteroatoms causes a decrease in shielding constants around the protons connected to C2 in the aliphatic ring (FIG. 10).
References
- Kiasat AR, Noorizadeh S, Ghahremani M, et al. Experimental and theoretical study on one-pot, three component route to 2H-indazolo[2,1-b]phthalazine- triones catalyzed by nano-alumina sulfuric acid. J Mol Struct. 2013;1036:216-25.
- Kumar S, Bawa S, Gupta H. Biological Activities of Quinoline Derivatives: Mini- Reviews in Medicinal Chemistry. 2009;9(14):1648-54.
- Gale P. 2009 Themed issue dedicated to Professor Jean-Pierre Sauvage materials and metal complexes w. 2009;6.
- F R. C. P. DAVID C. WARHURST, D.SC.A MOLECULAR MARKER FOR CHLOROQUINE -RESISTANT FALCIPARUM MALARIA M. N Engl J Med. 2001;344(4):299-302.
- LaPlanche LA. 13 C NMR Chemical Shift Assignments in Dibucaine and Dibucaine Hydrochloride Determined by Two-Dimensional NMR Spectroscopy. Spectroscopy Letters. 1991;24(2):209-28.
- Dockrell DH, Bighorn GR. Imiquimod and resiquimod as novel immunomodulators. J Antimicrob Chemother. 2001;48(6)751-55.
- Wakil El N, Ghamry El H. Nitroxoline. Azo Dye Complexes as Effective Heterogeneous Catalysts for Color Removal and Degradation of Some Organic Textile Dyes. Int J Chem Kinet. 2017;7:464-76.
- Kristensen S, Grislingaas AL, Greenhill JV, et al. Photochemical stability of biologically active compounds: V. Photochemical degradation of primaquine in an aqueous medium. Int J Pharm. 1993;100(1-3):15-23.
- Ruiz R, García B, Ruisi G, et al. Computational study of the interaction of proflavine with d(ATATATATAT)2 and d(GCGCGCGCGC)2. J Mol Struct. 2009;915(1-3):86-92.
- Dijkstra G D H, Kellogg RM, Wynberg H, et al. Conformational study of cinchona alkaloids. A combined NMR, molecular mechanics, and x-ray approach. J Am Chem Soc.1989;111(21):8069-76.
- Díaz-Araúzo H, Cook JM, Christie DJ. Synthesis of 10, 11- Dihydroxydihydroquinidine N-oxide, a New Metabolite of Quinidine. Preparation and 1 H-NMR Spectroscopy of the Metabolites of Quinine and Quinidine and Conformational Analysis via 2D COSY NMR Spectroscopy. J Nat Prod.1990;53(1):112-24.
- Lou Y. The acute hepatotoxicity of tacrine explained by 1 H NMR based metabolomic profiling. Toxicol Res. 2015;4(6):1465-78.
- Alver Ö, Parlak C, Senyel M. FT-IR and NMR investigation of 1- phenylpiperazine: A combined experimental and theoretical study. Spectrochimica Acta - Part A: Molecular and Biomolecular Spectroscopy. 2007;67(3-4):793-801.
- F. A. A. Paz, Dudenko D, Spiess HW. Packing Interactions in Hydrated and Anhydrous Forms of the Antibiotic Ciprofloxacin: a Solid-State NMR, X-ray Diffraction, and Computer Simulation Study.2012;71-74.
- Frechette M, Ian R, Hynes R, et al. Structures in Solution and in the Solid State of the Complexes of Lanthanum ( II1 ) with Solution NMR Studies.1992;1650-56.
- Dongre VG, Ghugare PD, Karmuse PD et al. Identification and characterization of process related impurities in chloroquine and hydroxychloroquine by LC / IT / MS, LC / TOF / MS and NMR. J Pharm Biomed Anal.2009;49:873-79.
- Xia SJ, Guangxin, Zhang Rongxia, et al. Spectral data analysis and identification of imiquimod. Fresenius J Anal Chem.2003;31(10):1183-86.
- Kidric J, Had?i D, Kocjan D, et al. 1H and13C NMR study of 8- hydroxyquinoline and some of its 5-substituted analogs.
- Benchabane Y, Boyer G, Faure R. 1Hand 13C NMR signal assignments of some new N, N???-diacyl proflavine derivatives. Magn Reson Chem.2009;47(8);706-10.
- ?Quinidine.? [Online]. Available: http://www.hanhonggroup.com/nmr/nmr_en/6064.html.
- ?QUININE.? [Online]. Available: http://www.allfordrugs.com/2014/11/28/quinine/.
- ?QUININE.? [Online]. Available: http://www.allfordrugs.com/2014/11/28/quinine/
- Chapman OL. Spectrometric Identification of Organic Compounds. J Am Chem Soc.1963;85(20):3316-16.