Original Article
, Volume: 7( 2)The Study of the Factors Affecting Viscosity of Locally Made Bio-Resin from Raw Banana Peels
Received: June 02, 2016; Accepted: June 25, 2016; Published: June 30, 2016
Citation: Mwesigwa R, Mwasiagi JI, Nzila C, et al. The Study of the Factors Affecting Viscosity of Locally Made Bio-Resin from Raw Banana Peels. Res Rev Polym. 2016;7(2):101.
Abstract
Over 30 million tons of banana peels are thrown away annually worldwide, leading to disposal by burning which is environmentally unfriendly. Strong governments support for environmental conservation and increasing dangers of incineration emissions have directed research into eco-friendly materials. The aim of this research therefore, was to study the utilisation of banana peels, a case study of factors affecting viscosity of locally made bio-resin from raw banana peels. The peels were washed, boiled and pureed. Effect of temperature, time, resin, glycerin, and water ratios on bio-resin viscosity were studied through use of the universal rotatable design and regression analysis. Second order polynomial regression equation for viscosity was fitted and exhibited R2 value of 95.03%. According to the results obtained in this research paper, resin quantity was the most influential factor towards the desired viscosity of the bio-resin contributing 41% to the regression model. Other factors included water ratio (20%), glycerin ratio (18.6%) among others. The developed bio-resin had an optimized viscosity response value of 242.01 mPa.s within confidence interval limits of 229.6 mPa.s to 254.5 mPa.s. This viscosity value is in a close range to existing commercial resins including maize cornstarch bio-resin and synthetic urea formaldehyde used in reinforced bio-composites development.
Keywords
Raw banana peels; Banana peels bio-resin; Viscosity; Universal rotatable design; Regression analysis
Introduction
Banana plants are produced in over 135 countries and territories across the tropics and subtropics [1]. Being global food crops, banana plants have abundant agro-waste which is difficult to dispose of. Over 30 million tons of banana peels are thrown away annually worldwide, leading to disposal by burning which is environmentally unfriendly [2]. Strong governments support for environmental conservation, increasing dangers of incineration emissions and increased utilization of agricultural resources for production of new “green” materials are some of the reasons for increased public interest in development of materials from renewable sources [3]. Grade four ripe banana peels have been used for production of bio-plastics with a potential for use in insulation and cosmetic prosthetics [4]. Therefore, banana peels have a potential of conversion into thermoplastic bio-resins with suitable viscosity requirements favorably competiting with other commercial synthetic resins. Thermoplastic materials including polypropylene, polyethylene, polyetherethrketone, and poly vinyl alcohol currently dominate as resins for composites development. Phenolic, epoxy and polyester are the commonly used thermosetting resins [5]. However, demand for bio-materials with favorable properties is spearheading a paradigm shift from conventional polymers to bio-polymer materials. A new bio-degradable epoxy resin CHS-Epoxy G520 developed by Spolchemie Limited (Czech Republic) has been discovered to produce bio-composites with better strength properties for automotive instrument panel applications than synthetic epoxy composites [6].
Bio-resins from different starch sources including potatoes, maize corn and wheat have also been studied and used in bio-composites development [7]. Unfortunately, these starch sources are food items worldwide. However, raw banana fruits possess about 20% starch whereas ripe bananas have starch content between 11% to 13%. Grade 1 green banana peels possess 3% starch, which reduces to between 1% to 2% in grade 4 ripe banana peels [8,9]. Therefore, raw banana peels as agro-waste possess more starch content than ripe peels. According to Satin [10], starch has two major components: amylose and amylopectin. These components are very different structurally, amylose being linear and amylopectin highly branched.
The viscosity, shear resistance, gelatinization, textures, solubility, tackiness, gel stability, cold swelling and retro-gradation are all functions of starch amylose to amylopectin ratio. High percentage amylose content therefore, indicates high viscosity values. Despite the amylopectin’s high molecular weight, its intrinsic viscosity is very low because of its extensively branched molecular structure [11,12]. Viscosity is the most important technological characteristic in processing technologies of polymeric materials. It is the only parameter used for characterization of Newtonian liquid materials [13]. Several studies on properties of bio-degradable resins have been done [3,14,15]. However, no literature exists on the effect of various factors on the viscosity of bio-resins from raw banana peels.
Experimental
Development of the banana peels bio-resin
Three kilograms of raw banana peels were obtained from Naguru market (Kampala, Uganda). The peels were washed, boiled and allowed to cool after the water was discarded. The peels were thereafter chopped into smaller pieces, placed into an electric blender and pureed to obtain banana peels fluid paste. For every 500 g of raw banana peels, 250 ml of water were added for easy pureeing. These measurements were selected based on the amount of chopped banana peels that could fit in the blender at a time. Five litters of the fluid paste obtained were stored in a jerrican for testing. The fluid paste was treated with various ratios of glycerin supplied by Desbro Uganda limited. Glycerin was preferred over other plasticizers because it is a by-product waste material in the bio-fuel industry, added to avoid brittleness and increase flexibility of the final bio-product [16,17].
Characterization of the banana peels bio-resin
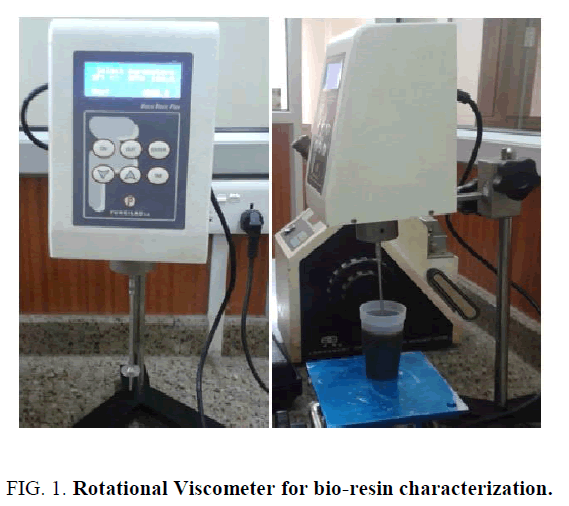
The oven, viscometer, measuring cylinders and glass containers for resin characterization were obtained from The Uganda Industrial Research Institute. Various resin, glycerin and water ratios were mixed in glass containers of over 85 mm diameter and 200 ml filling volume. An oven set at various temperatures was used for the prepared test specimens at different time intervals. The Visco Basic Plus Rotational Viscometer (VBCR 320810) with over eight rotational speeds and a set of seven spindles shown below in Figure 1 was employed. Viscosity of the samples was determined according to ASTM standard D2196-05 in (mPa.s) at a constant speed of 100 rpm.
Table 1 below also shows various viscosities of common commercial resins used globally in composites development. There was need for comparison between existing synthetic and bio-resins and the locally made bio-resin from raw banana peels in terms of viscosity.
| Matrices/Resins | Viscosity (mPa.s) | Reference |
|---|---|---|
| THERMOSETS | ||
| Epoxy @ 25°C | 25,000 - 45,000 | [18] |
| Green epoxy @ 25°C | 8,000 - 14,500 | [19] |
| Polyester | 3,000 | [20] |
| Phenolic | 500 - 40,000 | [21] |
| THERMOPLASTICS | ||
| Urea formaldehyde | 300 - 450 | [22] |
| Polypropylene | - | [20] |
| Poly vinyl alcohol | 65,000 | [20,22] |
| Cornstarch | 250 - 1,000 | [20,22] |
| Tapioca @ 113°C | 500 - 1,000 | [20,22] |
Table 1: Viscosity properties of common commercial resins.
Design of experiments for the banana peels bio-resin
Previous studies reveal that modern design of experiments, regression analysis and optimization of various responses can be achieved through computer software programs including Matlab, SAS, Design Expert, Monte Carlos and Minitab [6,23-25].
Therefore, using design of experiments under Minitab 17.0.1, response surface designs were considered. However, the central composite half unblocked rotatable design was preferred over the behnken and other experimental designs because of a few factors involved and optimization of a new experimental method required [26]. According to the design display under design of experiments in Minitab 17, 5 factors at 5 levels were employed to yield 32 experimental runs.
Three replicates were considered to obtain a wider sample size for better validation and analysis hence a total of 96 experimental runs. Each run was performed three times on the viscometer and the average viscosity recorded. Table 2 represents the relationship between factors and levels as input data. The alpha (α) of 2 was used in this experiment to calculate the actual values for the experiment.
| Factors | Levels | |||||
|---|---|---|---|---|---|---|
| -α | Low | Medium | High | +α | ||
| Coding | 2 | -1 | 0 | 1 | 2 | |
| Temperature (°C) | X1 | 25 | 40 | 60 | 80 | 100 |
| Time (min) | X2 | 20 | 30 | 40 | 50 | 60 |
| Resin (mls) | X3 | 20 | 40 | 60 | 80 | 100 |
| Glycerin (mls) | X4 | 0 | 10 | 15 | 20 | 25 |
| Water (mls) | X5 | 0 | 10 | 15 | 20 | 25 |
Table 2: Relationship between factors and levels.
This experimental design was used to determine the viscosity yield based on the linear, curvilinear and interaction effects of various factors using multiple regression analysis. The effect of several factors on a given yield(s) as outlined in the experimental design can be investigated using regression models, a well-established statistical tool [27,28]. A second order polynomial regression equation below was used to fit the model whereby Y=Viscosity, b0=Constant, b1 to b20=Coefficients and X1 to X5=Factors.
Y=b0+b1X1+b2X2+b3X3+b4X4+b5X5+b6X12+b7X22+b8X32+b9X42+b10X52+b11X1X2+b12X1X3+b13X1X4+b14X1X5+b15X2X3+b16X2X4+b17X2X5+b18X3X4+b19X3X5+b20X4X5 (1)
Results
Experimental data analysis for the banana peels bio-resin
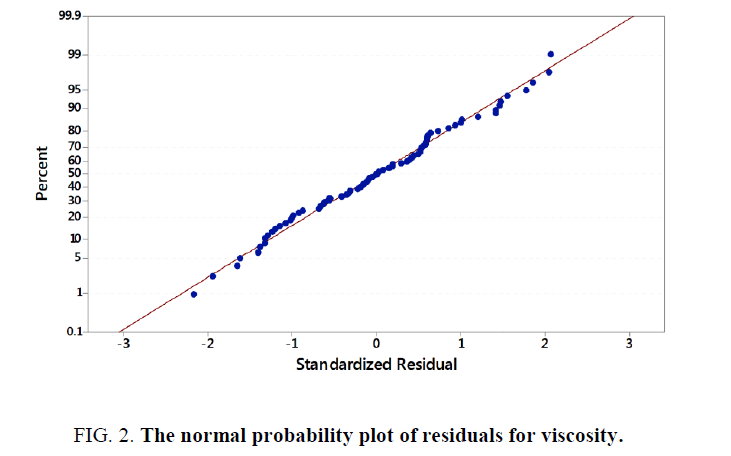
From design of experiments under Minitab 17.0.1, an experimental datasheet of 5 factors at 5 levels containing a total of 96 experimental runs was obtained and used for data collection. Various test samples were subjected to different ratios of temperature, time, resin, glycerin, and water as the inputs to study their effect on the viscosity (Y) of locally produced bio-resin. It was noted that each individual combination yielded different results of viscosity. Collected data was imported as a datasheet into Minitab 17.0.1 for analysis. During multiple regression analysis, standardization of the data was effected. The stepwise regression procedure was also employed by adding terms during the regression to maintain a hierarchical model at each step. Analysis of Variance (P-Values) and Variance Inflation Factors were checked and verified to ensure model accuracy. Multiple regression models were developed for the yield in viscosity of the bio-resin. According to the multiple regression model, the sample data of 96 points was a precise estimate of the strength of the model. There were no unusual data points to have a strong influence on the results. Furthermore, the normality test was passed since more than 15 data points were used. The normal probability plot of residuals for viscosity in Figure 2 below shows that the data points were normally distributed.
Prediction and optimization of the viscosity of banana peels bio-resin
According to the viscosity (Y) model summary report, the model strength exhibited an R2 value of 95.03%. This implies that 95.03% of the variations in viscosity yield can be explained by the obtained model below:
Y=203.4-1.689X1-6.514X2+3.168X3+0.74X4-3.146X5+0.00786X12+0.0511X22-0.00990X32-0.0877X42+0.04300X1 × X2-0.02205X1 × X3 (2)
According to Table 3, Analysis of Variance statistics showed that the P-value (0.0001) of the general model obtained was less than 5% (P<0.05). Therefore, the model was deemed to be significant. Furthermore, P-values for individual factors, curvilinear and interaction effects revealed that all the values were less than 0.05 hence significant in the model.
| Source | Analysis of Variance (P-Value) | Factor Contributions (%) | VIF |
|---|---|---|---|
| Regression | 0.000 | 95.03 | |
| X1 | 0.000 | 3.96 | 1.21 |
| X2 | 0.024 | 1.17 | 1.35 |
| X3 | 0.000 | 41.04 | 1.38 |
| X4 | 0.000 | 18.61 | 1.66 |
| X5 | 0.000 | 20.00 | 2.77 |
| X1× X1 | 0.016 | 0.61 | 1.55 |
| X2 × X2 | 0.000 | 2.07 | 1.56 |
| X3 × X3 | 0.001 | 0.65 | 1.43 |
| X4 × X4 | 0.022 | 0.04 | 2.81 |
| X1× X2 | 0.000 | 2.32 | 3.29 |
| X1× X3 | 0.000 | 4.54 | 1.36 |
| Error | 4.97 | ||
| Lack-of-Fit | 0.000 | 4.4 | |
| Pure Error | 0.57 | ||
| Total | 100.00 |
Table 3: Steady state optimum parameters for continuous surfactin production by immobilized cells of Bacillus subtilis.*
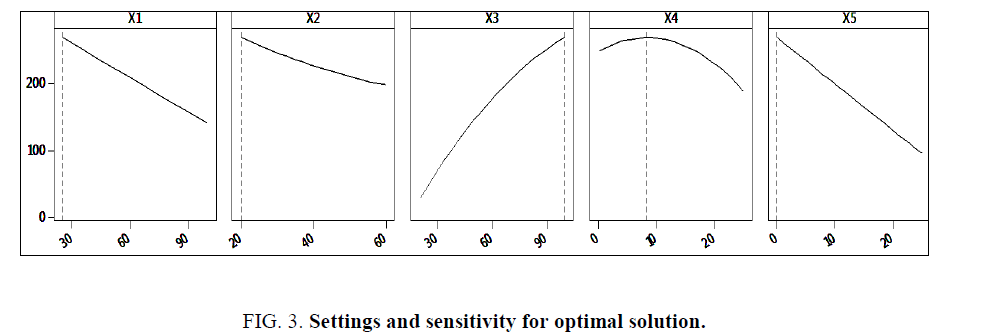
Percentage contributions of various factors are also outlined, with resin amount contributing the highest percentage of 41% to the model, water amount at 20% and glycerin amount at 18.6%. Temperature and time contributed 4% and 1.2% respectively. Curvilinear and interaction effects revealed that interacting temperature with resin amount (X1 × X3) contributed a higher percentage of 4.5% to the regression model compared to other effects. Variance Inflation Factors proved that there was no multi-colinearity among the variables, curvilinear and interaction effects. This is because all the values presented in Table 3 are below 5. The developed regression model was used to design a prediction and optimization report for viscosity of the developed banana peels bio-resin. The goal was to maximize viscosity yield in the bio-resin. Optimal settings for viscosity maximization (Table 4), top five alternative solutions closest to the optimum settings (Table 5), sensitivity analysis for the optimum solution (Figure 3) were obtained.
| Goal: Maximized viscosity | Solution: Optimal settings | ||||
|---|---|---|---|---|---|
| Predicted viscosity | 242.01 | X1 | 25 | X4 | 4.30 |
| 95% CI | (229.50, 254.52) | X2 | 20 | X5 | 0 |
| 95% PI | (217.55, 266.77) | X3 | 100 | ||
Table 4: Prediction and optimization report.
| X1 | X2 | X3 | X4 | X5 | Predicted viscosity |
|---|---|---|---|---|---|
| 25 | 20 | 100 | 0 | 0 | 240.468 |
| 100 | 60 | 100 | 0 | 0 | 161.611 |
| 40 | 50 | 80 | 20 | 10 | 104.262 |
| 60 | 60 | 60 | 15 | 15 | 97.554 |
| 25 | 40 | 60 | 15 | 15 | 95.822 |
Table 5: Alternative solutions: values close to optimal settings.
It was observed from Tables 4 and 5 that optimal settings required to obtain the maximum viscosity for this banana peels bio-resin, which was 242.01 mPa.s were presented alongside the top five predicted alternatives. The alternatives could be considered in case the optimal settings were not practical in reality. From the predictive model generated, it was evident that resin quantity (X3) contributed the highest percentage towards the model. This is also evidenced by Figure. 3, whereby increase in X3 resulted into increase in viscosity (Y).
Figure. 3 further revealed that glycerin quantity (X4) had a positive influence on the viscosity (Y) up to an optimum level beyond which it operates in the law of diminishing returns with a negative influence. Temperature (X1), time (X2) and water (X5) all had a negative effect on the viscosity yield.
Discussion
Consideration of viscosity as an important factor in characterization of the banana peels bio-resin is supported by Stabik J [29] which stated that viscosity is the most important technological characteristic in processing technologies of polymeric materials used for characterization of Newtonian liquid materials. The results show that increase in temperature leads to decrease in viscosity. This is most probably because temperature increases the kinetic energy of the resin molecules hence increasing their mobility and flow. Intermolecular forces holding the bio-resin molecules together are weakened by increase in temperature hence decrease in viscosity. This concurs with a study on preparation and properties of cornstarch adhesives whereby viscosity decreased with increase in temperature. Furthermore, increase in time in relation to gradual temperature rise contributes to continual decrease of viscosity. However, results also revealed that viscosity increases with increase in bio-resin concentration. This is due to the amylose and amylopectin ratios in the bio-resin. High bio-resin concentration implies high levels of amylose content that is responsible for high viscosity levels in starch compounds. This is in agreement with [30] who stated that despite the amylopectin’s high molecular weight, its intrinsic viscosity is very low because of its extensively branched molecular structure unlike amylose. Bananas are among the starch sources with relatively high amylose content of 20.7% as noted by YaÑez et al. [8]. Glycerin ratio was noted to increase the viscosity of the bio-resin up to an optimum level beyond which it decreases the viscosity value. According to Curvelo et al. [31] and Wattanakornsiri et al. [32], glycerol content in the ranges of 20% to 40% or 20% to 35% without added water has a positive effect on viscosity including improvement of strength and toughness of the resultant composite materials. However further increase has detrimental effect by reducing the viscosity as evidenced by the results in Figure. 3. This is also confirmed by de Graaf et al. [33], who stated that plasticizers generally have low molar mass, a high boiling point and exhibit low viscosities and low temperature coefficients of viscosity hence capable of reducing resin viscosity. Addition of water into the bio-resin also decreases bio-resin viscosity due to low viscosity of water molecules hence lowering the viscosity of the consequent bio-resin.
The goal of this analysis was to maximize viscosity yield hence optimal settings yielded maximum viscosity of 242.01 mPa.s (0.242 Pa.s) for this locally made bio-resin from raw banana peels. At 95%, confidence interval (CI) limits of 229.6 mPa.s to 254.5 mPa.s were established. Similarly, at 95% predicted interval (PI) a viscosity range was also determined between 217.55 mPa.s, and 266.77 mPa.s. This is attributed to high viscosity relating to better resin mechanical properties. Maximization of viscosity is evidenced by most of the commercial resins including the recently developed biodegradable epoxy resin (CHS-Epoxy G520: 12000 mPa.s to 14500 mPa.s) that have high viscosity values [6]. However, the obtained viscosity is in close proximity to some commercial resins including maize cornstarch (250 mPa.s to 1,000 mPa.s) and urea formaldehyde (300 mPa.s to 450 mPa.s) currently used in composites development [22,34]. Therefore, the banana peels bio-resin has potential for use in bio-composites production.
Conclusion
Raw banana peels bio-resin has been developed and characterized using statistical models. The regression model for viscosity exhibited an R2 value of 95.03%, and an optimum viscosity value of 242.01 mPa.s was recorded. The viscosity value was in close proximity to existing commercial resins including urea formaldehyde, and maize cornstarch.
Percentage contributions of various factors revealed that resin amount contributed the highest percentage of 41% to the model, water amount at 20% and glycerin amount at 18.6%. Temperature and time contributed 4% and 1.2% respectively.
Acknowledgement
We are grateful for the financial assistance extended to us by the European Commission through the Mobility for Enhancing Training of Engineering Graduates in Africa (METEGA), without which this research work will not have been undertaken.
References
- Bergh D, Smith M, Picq C, editors. Unravelling the banana's genomic potential. Proceedings of the 29th International Horticultural Congress on Horticulture: Sustaining Lives, Livelihoods and Landscapes (IHC2014): IX International Symposium on Banana: ISHS-ProMusa Symposium on Unravelling the Banana's Genomic Potential; 2014 Aug 18-20, Brisbane, Australia. Belgium: ISHS; 2016.
- Lisey C. The Banana Peel Water Filter. 2013.
- Mohanty AK, MisraM,Drzal LT, editors. Natural fibers, bio-polymers and bio-composites. Boca Raton: CRC Press; 2005.
- ElifB. Using banana peels in production of bio-plastic as a replacement of traditional petroleum based plastics. Google Science Fair, Istanbul, Turkey; 2014.
- Arpitha GR, Sanjay MR, YogeshaB. Review on comparative evaluation of fiber reinforced polymer matrix.Composites. 2014;4(4):44-7.
- Rwahwire S, Blanka T, Jiri M, et al. Development of a bio-composite based on green epoxy polymer and natural cellulose fabric (bark cloth) for automotive instrument panel applications. CompositB Eng.2015;81:149-57.
- Arikan A. Bio-plastics. PackagBull. 2009.
- YaÑez L, Armenta M, Mercado E, et al. Integral Handling of Bananas. In: Production Practices and Quality Assessment of Food Crops. New York: Kluwer Academic Publishers; 2004. p.129-168.
- Wachirasiri P, Julakarangka S, WanlapaS. The effects of banana peel preparations on the properties of banana peel dietary fibre concentrate.Songklanakarin JSciTechnol. 2009;31(6):605-11.
- Satin M. Functional Properties of Starches. 2007; 5.
- Reddy N, Yang Y. Innovative Biofibres from Renewable Resources. Fibers from Cotton Stalks; 2014.
- GraafRA, KarmanAP, Janssen LP. Material properties and glass transition temperatures of different thermoplastic starches after extrusion processing. Starch. 2003;55(2):80-6.
- Ka?ys R, Rekuviene R. Viscosity and density measurement methods for polymer melts.Ultrasound. 2011;66(4):20-5.
- VázquezA, AlvarezVA.Starch?Cellulose Fiber Composites. In:Yu L, editor, Biodegradable Polymer Blends and Composites from Renewable Resources. New Jersy: John Wiley & Sons, Inc.;2008. p. 239-86.
- Kalia S, KaithBS, Kaur I, editors. Cellulose Fibers: Bio- and Nano-Polymer Composites. New York: Springer; 2011.
- Yazdani SS, Gonzalez R. Aerobic fermentation of glycerol: a path to economic viability for the biofuels industry: CurrOpinBiotechnol. 2007;18:213-9.
- Thomas S, Paul SA, Pothan LA, et al. Natural Fibres: Structure, Properties and Applications. In: Cellulose Fibers: Bio- and Nano-Polymer Composites. New York: Springer; 2011. p. 3-42.
- Atur Limited, Polymers Division. Lapox A-31; Epoxy Resin. Gujarat (India): Atur Limited. 2015.
- Spolchemie Limited. Green Epoxy Resins. Ústí nad Labem (Czech Republic): Spolchemie Limited. 2014.
- Expert Process Systems. Fluid Viscosity. Hackettstown NJ: Expert Process Systems. 2014.
- Sumitomo Ltd. Properties of Phenolic Resins. Japan: Sumitomo Bakelite Company Limited.2015.
- Yang L, Liu J, Du C, et al. Preparation and properties of cornstarch adhesives. Adv J Food Sci Technol.2013;5(8):1068-72.
- Castro ACM, Ribeiro MCS, Santos J, et al. Sustainable waste recycling solution for the glass fibre reinforced polymer composite materials industry. Elsevier Ltd. 2013.
- Alwani S, Khalilab HPSA, Islamac N,et al. Microstructural Study, Tensile Properties, and Scanning Electron Microscopy Fractography Failure Analysis of Various Agricultural Residue Fibers. JNatFibers. 2015;12(2):154-68.
- Mburu AW, Mwasiagi JI, Anino EO. Optimisation of cotton wax removal using bacteria isolate from gin trash. JTextilInst. 2015.
- BreretonRG, Araujo PW. Experimental design: Optimisation.Trend Anal Chem.1996;15(2).
- Lind DA, MarchalWG,WathenSA. Basic Statistics for Business and Economics. New York: McGraw-Hill; 2000.
- Bowerman BL, O?Conell RT, HandML. Business Statistics in Practice. New York: McGraw-Hill Irwin; 2001.
- Stabik J, Dybowska A, Szczepanik M, et al. Viscosity measurements of epoxy resin filled with ferrite powders. IntSciJWorld AcadMaterSciEng. 2009;38(1):34-40.
- Mohanty A, Manjusri M, Lawrence TD. Natural Fibers, Biopolymers and Biocomposites. Florida: CRC Press; 2005.
- Curvelo AAS, Carvalho AJFD, Angelli JAM. Thermoplastic starch-cellulosic fibers composites: preliminary results. CarbohydrPolym. 2001;45:183-8.
- Wattanakornsiri A, Pachana K, Kaewpirom S, et al.Preparation and properties of green composites based on tapioca starch and differently recycled paper cellulose fibers. JPolymEnviron. 2012;20(3):801-9.
- de GraafRA, Karman AP, Janssen LP. Material properties and glass transition temperatures of different thermoplastic starches after extrusion processing.Starch. 2003;55(2):80-6.
- Suurpere A, Christjanson P, Siimer K. Rotational viscometry for the study of urea-formaldehyde resins. Proc Estonian Acad Sci Eng. 2006;12(2):134-46.
